Enantiomeric separation of ornithine in complex mixtures of amino acids by EKC with off line derivatization with 6 aminoquinolyl N hydroxysuccinimidyl carbamate
7
0
0
Texto completo
(2) Author's personal copy. Journal of Chromatography B, 875 (2008) 254–259. Contents lists available at ScienceDirect. Journal of Chromatography B journal homepage: www.elsevier.com/locate/chromb. Enantiomeric separation of ornithine in complex mixtures of amino acids by EKC with off-line derivatization with 6-aminoquinolyl-N-hydroxysuccinimidyl carbamate夽 Ana Belén Martı́nez-Girón, Elena Domı́nguez-Vega, Carmen Garcı́a-Ruiz, Antonio L. Crego, Maria Luisa Marina ∗ Departamento de Quı́mica Analı́tica, Facultad de Quı́mica, Universidad de Alcalá, Ctra. Madrid-Barcelona Km. 33.600, 28871 Alcalá de Henares, Madrid, Spain. a r t i c l e. i n f o. Article history: Received 18 April 2008 Accepted 16 June 2008 Available online 20 June 2008 Keywords: Ornithine Chiral separation Cyclodextrins AQC derivatization Amino acids Fermented foods Electrokinetic chromatography. a b s t r a c t A new analytical methodology was developed by EKC enabling the fast enantiomeric separation of Ornithine in complex mixtures of amino acids. A previous derivatization step with 6-aminoquinolyl-Nhydroxysuccinimidyl carbamate (AQC) was achieved to enable the sensitive UV detection of amino acids as well as to make possible their interaction with the CDs employed as chiral selectors. A dual CD system containing an anionic and a neutral CD in phosphate buffer at acid pH showed a high resolving power allowing the enantiomeric separation of 18 protein amino acids and Orn. The method was applied to the analysis of fermented foods to investigate the extent of the presence of Orn enantiomers. © 2008 Elsevier B.V. All rights reserved.. 1. Introduction Chiral analysis of free amino acids in foods is an increasingly active area of research since they can be indicative of the quality and safety of foods. In fact, it has been recognized that d and l enantiomers differ in their biological or physiological activities [1,2]. Although amino acids in nature occur in l-forms, several investigations have demonstrated high levels of d-amino acids in diverse foods as products formed during food processing or as a consequence of heat treatment (roasting, pasteurization, etc.), the use of alkaline conditions or fermentation processes [3]. Fermentation can produce different degrees of racemization from free amino acids conversing l enantiomers in d forms through substrate-specific enzymes contained in microorganisms [3–5]. Besides the 20 protein amino acids, there are other amino acids of non-protein origin present in foodstuffs [6]. ␥-Aminobutyric. 夽 This paper is part of the Special Issue ‘Enantioseparations’, dedicated to W. Lindner, edited by B. Chankvetadze and E. Francotte. ∗ Corresponding author. Fax: +34 91 8854971. E-mail address: mluisa.marina@uah.es (M.L. Marina). 1570-0232/$ – see front matter © 2008 Elsevier B.V. All rights reserved. doi:10.1016/j.jchromb.2008.06.022. acid (GABA) and Ornithine (Orn) are examples of non-protein amino acids found in fermented beverages like wines and beers [1,5,7–15]. GABA is widely distributed in nature and has several well-known physiological functions; moreover, it can be produced by microorganisms such as lactic acid bacteria used as starters in the production of fermented foods [16]. Orn can produce undesirable effects in fermented foods. It is the precursor of compounds that provides the bad taste (mousy off-flavor) in wines [17] and biogenic amines (BA), i.e. putrescine present in beers and wines which are undesired components of food products due to their toxic effects to humans at high concentrations [18–20]. As a consequence, the determination of Orn in foods has been found to have a high interest. Moreover, Orn is a chiral compound which enantiomeric determination is important due to the different biological activities of its enantiomers [2,21]. In fact, d-Orn has shown toxicity at high levels and other unhealthy effects on animals [22,23]. Thus, some studies in rats about the effect in the synthesis of urea of some compounds including d- and l-Orn, showed that the d-form inhibited the urea synthesis by competition with l-Orn in the enzymatic system, coming into a toxic effect due to the increase of ammonia in the organism [22]. Other authors had found other differences between l- and d-Orn [24,25], including that d-Orn is much less effective transported by proteins [25]. As a consequence, adequate.
(3) Author's personal copy. A.B. Martı́nez-Girón et al. / J. Chromatogr. B 875 (2008) 254–259. analytical methodologies for the enantiomeric determination of Orn in foods are needed. Up to date, only a few works on the chiral separation of Orn have been published by HPLC [26,27], GC [5,28,29], and CE [30,31]. Most of the HPLC and GC methods were applied to food analysis [5,26,27,29] but long separation times were needed to detect Orn enantiomers (from 35 to 60 min). However, the two works found by CE were not applied to food analysis. In these works, micellar electrokinetic chromatography (MEKC) methods were developed, using a chiral surfactant as (S)- and (R)-dodecanoylvaline and 6-aminoquinolyl-N-hydroxysuccinimidyl carbamate (AQC) as derivatizing reagent [30], or ␥-CD as chiral selector in a SDS micellar media with an additive (acetonitrile or 2-propanol) and fluorescein isothiocyanate as derivatizing reagent [31]. Due to the potential of CE in the chiral field and the possibilities that offers to reduce the separation times, it was chosen in this work. The aim of this work was the development of a new analytical methodology enabling the simple and fast enantiomeric separation of Orn in complex mixtures of amino acids by CE and to apply CE for the first time to the analysis of fermented foods to investigate the presence of Orn enantiomers.. 2. Experimental 2.1. Reagents and samples All reagents employed for the preparation of the separation buffers were of analytical grade. Orthophosphoric acid, sodium hydroxide, dodecyl sulfate sodium salt (SDS) and ethanol (EtOH) were supplied from Merck (Darmstadt, Germany). Hydrochloride acid, 1-propanol (1-PrOH) and 1-butanol (1-ButOH) were from Scharlau (Barcelona, Spain); triethanolamine was obtained from Riedel-de Haën (Seelze, Germany), methanol (MeOH) was supplied from Panreac (Barcelona, Spain) and Brij 35 was from Acros (Morris Plains, NJ, USA). Distilled water was purified through a Milli-Q System from Millipore (Bedford, MA, USA). Chiral selectors, ␣-CD, -CD, ␥-CD, methyl--CD, 2-hydroxypropyl--CD, 2,6-di-O-methyl--CD, heptakis(2,3,6-triO-methyl)--CD, succinyl--CD, highly sulfated--CD (HS--CD) and carboxymethyl--CD, were purchased from Fluka (Madrid, Spain). Acetylated--CD, acetylated-␥-CD, succinyl-␥-CD, carboxymethyl-␣-CD, carboxymethyl-␥-CD, carboxyethyl--CD and carboxyethyl-␥-CD were obtained from Cyclolab (Budapest, Hungary). The derivatization reagent 6-aminoquinolyl-N-hydroxysuccinimidyl carbamate (AQC) was purchased from Waters (Mildford, MA, USA) in a reagent kit containing borate buffer, reagent powder (AQC) and reagent diluent (acetonitrile). d- and l-Leu, dl- and l-Val, dl- and l-Met, dl- and d-Orn, dl- and l-His, dl- and l-Ser, dl- and l-Arg, dl-and l-Cys, dl- and l-Lys, dl- and l-Thr, d- and lTyr, d- and l-Trp, l-Glu, dl-Ala, l-Phe, l-Pro, l-Asn, d-Gln, and Gly amino acids were from Fluka, dl- and l-Asp, l-Gln, dl- and l-Ile, and dl-Pro were from Aldrich (Madrid, Spain), dl-Phe, d-Glu, l-Ala, dl-Asn, and GABA were from Sigma (Darmstadt, Germany), and lcistine ((Cys)2 ) was from Merck. Beer, wine and vinegar samples were supplied from a food store of Madrid, Spain. Standard solutions of amino acids were prepared dissolving the appropriate amount in Milli-Q water. Beer was degassed for 30 min to remove CO2 in an ultrasonic bath. Wine and vinegar did not require any pretreatment. All solvents and samples were filtered prior to use through 0.45 m pore size disposable nylon filters from Sugelabor (Madrid, Spain).. 255. 2.2. Derivatization procedure For the preparation of AQC-amino acids, solutions of amino acids, 200 mM borate buffer (pH 8.8) and reconstituted AQC reagent (approximately 10 mM AQC in acetonitrile) were mixed in a 1:3:1 volume ratio, respectively, to obtain an amino acid:AQC molar ratio ≥10. Resulting solutions were sonicated with Ultrasons-H from J.P. Selecta (Barcelona, Spain) for 10 min and kept at ambient temperature for one hour previously to their injection in the CE system.. 2.3. CE conditions CE experiments were carried out with an HP3D CE instrument (Agilent Technologies, Waldbron, Germany) equipped with an oncolumn DAD working at 260 nm with a bandwidth of 2 nm and a response time of 0.1 s. The instrument was controlled by a PC running the 3D-CE ChemStation from Agilent Technologies. Separations were performed on uncoated fused-silica capillaries of 50 m ID (375 m OD) with a total length of 48.5 cm (40 cm to the detector) or with a total length of 72.5 cm (64 cm to the detector) purchased from Composite Metal Services (Worcester, England). Injections were made at the cathodic end using a pressure of 5066.25 Pa (50 mbar) for 3 or 5 s followed by injection of BGE (50 mbar for 5 s). The electrophoretic separation was achieved with a voltage ranging from −15 to −30 kV (reverse-polarity mode). The temperature of the capillary was 15 ◦ C. Before its first use, the new capillary was rinsed with 1 M NaOH for 30 min, followed by 5 min with water and conditioned with phosphate buffer (pH 2.0) for 60 min and the separation media (background electrolyte, BGE) for 30 min. Between injections of samples, the capillary was conditioned with phosphoric acid 0.1 M (2 min), Milli-Q water (2 min) and BGE (2 min). A pressure of 101325 Pa (1 bar) was applied in all steps. Buffer solutions were prepared diluting the appropriate volume of orthophosphoric acid with Milli-Q water, adjusting the pH to the desired value (pH 2.0) with trietanolamine pure solution before completing the volume with water to get the desired buffer concentration (50 mM). The BGE was elaborated dissolving the suitable amount of chiral selector (CDs) in the separation buffer. A pH meter (Metrohn 744, Herisau, Switzerland) was used for the pH adjustment of the separation buffers. An ultrasonic bath (Ultrasons-H) was used for the preparation and degassing of the BGEs and all prepared solutions.. 2.4. Data treatment Resolution of the enantiomers was obtained from the Chemstation software using the equation: Rs = 1.18. t2 − t1 w1/2,1 + w1/2,2. where t1 and t2 are the migration times of the first- and secondmigrating enantiomers, respectively, and w1/2,1 , w1/2,2 their peak widths at half height. Corrected peak areas (Ac) were used to compensate fluctuations in electrophoretic conditions and to obtain a good reproducibility of data. They were calculated dividing the peak area (Ai ) by the corresponding migration time (ti ), that is, Ac = Ai /ti . Experimental data analysis and parameters were calculated using Excel Microsoft XP® and Origin 7.0. Graphs with different electrophoregrams were composed in Origin 7.0..
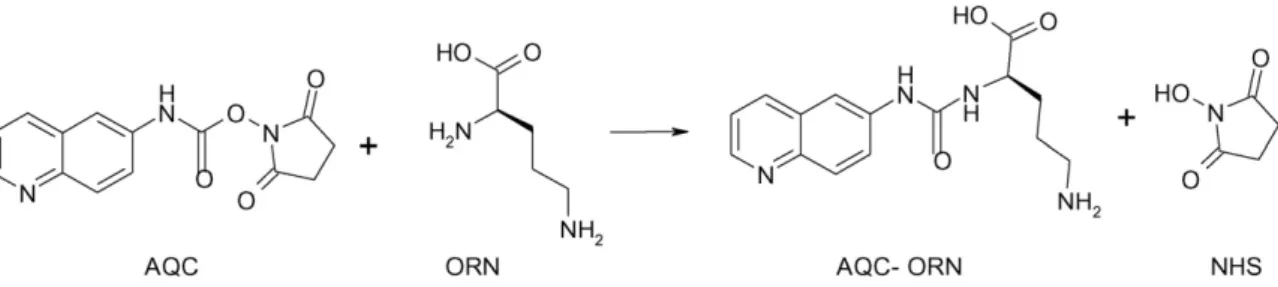
(4) Author's personal copy. 256. A.B. Martı́nez-Girón et al. / J. Chromatogr. B 875 (2008) 254–259. Fig. 1. Derivatization scheme of AQC with Orn showing the chemical structure of the derivatized Orn.. 3. Results and discussion 3.1. Development of an analytical methodology for the enantiomeric separation of Orn in complex mixtures of amino acids by EKC For the separation of Orn enantiomers in complex mixtures of amino acids, a derivatization step with AQC was performed because it is a fast labeling agent producing stable amino acid derivatives. Fig. 1 shows the derivatization scheme of AQC with Orn showing the chemical structure of the derivatized Orn (AQC-Orn). Preliminary experiments were achieved with a group of six amino acids including Orn and other five protein amino acids usually present in fermented foods (Lys, Arg, Glu, Asp, and Gln). First, due to the good enantiomeric separations obtained for some compounds using highly anionic CDs as chiral selectors under acidic conditions [32,33], HS--CD was selected as chiral selector. This CD was employed in an acidic buffer (50 mM phosphate buffer at pH 2.0) and with reverse polarity due to its high electrophoretic mobility towards the anode and the negligible EOF at pH 2.0. Moreover, a temperature of 15 ◦ C was chosen since it is well known that the enantiomeric resolution of chiral compounds can increase when decreasing the working temperature [34]. Under these conditions, a study on the influence of HS--CD concentration on the enantiomeric separation of the six amino acids studied was performed. Table 1 groups the values obtained for the enantiomeric resolution when the CD concentration was varied from 1.0 to 5.0% (m/v). An enhancement of the enantiomeric resolution when increasing the CD concentration was generally observed for all the amino acids studied, except for Glu. A 3.5% (m/v) HS--CD was selected for further experiments since this concentration originated the best enantiomeric resolution for Orn and a slight discrimination for Lys enantiomers. Different additives such as surfactants (SDS or Brij 35) and organic solvents (MeOH, EtOH, 1-PrOH, and 1-ButOH at 5% (v/v)) were tested to separate Lys enantiomers. Only 1-PrOH improved. slightly their separation but the increasing migration times obtained lead us to reject these working conditions. Therefore, the combination of two CDs (the anionic one and one neutral) was investigated. 16 neutral CDs (␣-CD, -CD, ␥-CD, 2-hydroxypropyl-CD, methyl--CD, 2,6-di-O-methyl--CD, heptakis(2,3,6-tri-Omethyl)--CD, acetylated--CD, acetylated-␥-CD, carboxymethyl␣-CD, carboxymethyl--CD, carboxymethyl-␥-CD, carboxyethyl-CD, carboxyethyl-␥-CD, succinyl--CD, succinyl-␥-CD) at a concentration of 0.5% (m/v) were combined with 3.5% (m/v) HS--CD at the working pH. Lys enantiomers were only separated (Rs = 1.0) when using the dual CD system consisting of HS--CD and acetylated-␥-CD. In addition, the enantioresolutions obtained for the other five amino acids were only slightly affected. In order to improve the separation of the amino acids studied (Lys and Glu showed Rs = 1.0) different concentrations of the neutral CD (ranging from 0.5 to 2% (m/v)) in the dual CD system at a 3.5% (m/v) concentration of the anionic CD were tested. Concentrations higher than 2% (m/v) of the neutral CD were not used due to its limited water solubility (0.2 g/ml). The baseline resolution for Lys and Glu enantiomers was achieved when the concentration of acetylated-␥-CD in the BGE was 1.5 or 2.0% (m/v). However, under these conditions, the first-migrating enantiomer of Orn eluted very close to the second enantiomer of Lys. Then, the highest concentration of acetylated-␥-CD% (m/v) was chosen to study the effect of increasing concentrations of the anionic CD under these conditions. Fig. 2 shows that the best separation between Lys enantiomers and the first-migrating enantiomer of Orn was obtained for 5% (m/v) of HS--CD. Moreover, a shorter analysis time and a better separation. Table 1 Enantiomeric resolution (Rs) for the six amino acids Arg, Lys, Orn, Gln, Glu, and Asp, obtained with different concentrations of HS--CD % HS--CD (m/v). Arg Lys Orn Gln Glu Asp. 1. 2.5. 3. 3.5. 5. 3.1 0 2.5 2.9 2.1 0.5. 5.0 0 4.5 3.4 1.8 1.0. 4.6 0 5.0 3.9 1.4 1.2. 5.2 0.6 5.6 4.0 1.4 1.4. 4.1 0 5.4 4.3 0.8 1.5. Experimental conditions: BGE, % (m/v) HS--CD in 50 mM phosphate buffer (pH 2.0); uncoated fused-silica capillary, 48.5 cm (40 cm to the detector window) × 50 m ID; UV detection at 260 nm; applied voltage, −25 kV; temperature, 15 ◦ C; injection by pressure in the cathodic end, 5066.25 Pa for 3 s of sample followed of 5 s of BGE.. Fig. 2. Enantiomeric separation of a mixture of Arg, Orn and Lys using different concentrations of HS--CD with 2% (m/v) acetylated-␥-CD in the separation buffer. Experimental conditions: BGE, CDs in 50 mM phosphate buffer at pH 2.0; uncoated fused-silica, 50 m × 48.5 cm; injection by pressure in the cathodic end, 5066.25 Pa for 3 s of sample (1.25 mM racemic mixture of each amino acid) followed by 5 s of BGE; applied voltage, −25 kV; temperature, 15 ◦ C; detection wavelength, 260 nm..
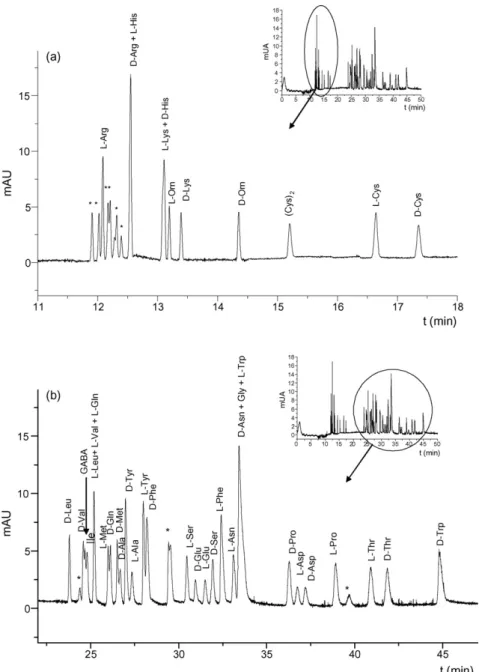
(5) Author's personal copy. A.B. Martı́nez-Girón et al. / J. Chromatogr. B 875 (2008) 254–259. 257. Fig. 3. Separation of a mixture of the 20 protein amino acids, Orn, and GABA (upper corner) divided in two migration zones: (a) first-migrating zone, and (b) second-migrating zone. Experimental conditions: 50 mM phosphate buffer at pH 2.0 containing 5% (m/v) HS--CD and 2% (m/v) acetylated-␥-CD; uncoated fused-silica, 50 m × 72.5 cm; injection by pressure in the cathodic end, 5066.25 Pa for 5 s of sample (0.25 mM racemic mixture of each amino acid) followed by 5 s of BGE; applied voltage, −25 kV; temperature, 15 ◦ C; detection wavelength, 260 nm. (*) Unknown peaks.. of the impurities comigrating with the first-migrating enantiomer of Arg were observed. As a consequence, a BGE composed by 5% (m/v) HS--CD and 2% (m/v) acetylated-␥-CD in 50 mM phosphate buffer (pH 2.0) was chosen for further experiments. The effect of instrumental parameters was also studied. As expected, the use of a longer capillary (total length 72.5 cm) lead to better separations between enantiomers and among amino acids together with a reduction of the BGE current (from 165 to 110 A). With this capillary length, different applied voltages (−15, −20, −25, and −30 kV) were tested observing the best separations at −25 kV. A mixture of 22 amino acids, the 20 protein amino acids (19 chiral + Gly) together with the non-protein amino acids Orn (chiral) and GABA (achiral), was injected under the optimized electrophoretic conditions. Fig. 3 shows the electropherogram corresponding to this complex mixture of amino acids. The identifi-. cation of peaks was carried out by spiking individually the mixture with racemic mixtures of each amino acid. The identification of the amino acid enantiomers was performed by injecting individually each pair of d/l enantiomers at a concentration ratio of 1:3. Fig. 3a shows the first-migrating zone where peaks corresponding to the enantiomers of 5 amino acids (Arg, Lys, Orn, His, and Cys) and one peak corresponding to the Cys dimmer [(Cys)2 ] were identified. Fig. 3b displays the second migration zone where the peaks corresponding to other 16 protein amino acids and GABA were identified. In this case, the enantiomers of 14 protein amino acids were separated since Ile was not enantiomerically separated and Gly is not chiral. Although some co-elutions existed, Fig. 3 shows that the enantiomers of Orn were separated with high resolution without interferences from any other amino acid of the mixture. This fact shows the huge potential of the chiral method. As far as we know, this is the first chiral method by CE enabling the simultaneous sep-.
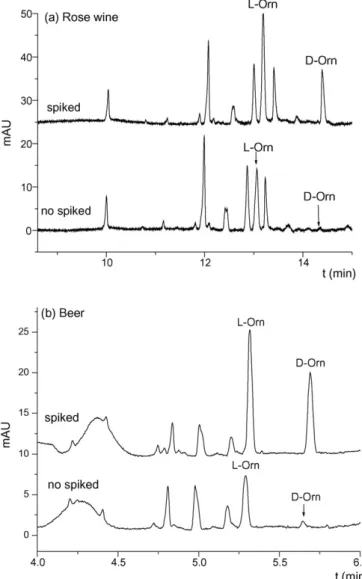
(6) Author's personal copy. 258. A.B. Martı́nez-Girón et al. / J. Chromatogr. B 875 (2008) 254–259. Table 2 Analytical performance of the CE chiral method for Orn enantiomers l-Orn 5.0 × 10. Method repeatability (n = 6)c Ac t. −4. –5.0 × 10 0.993 9.0 × 10⁻⁶ M 3.0 × 10⁻⁵ M. Linear working concentration range Correlation coefficient (r) Limit of detection (LOD)a Limit of quantitation (LOQ)a Precision Instrumental repeatability (n = 5)b Ac t. d-Orn −5. M. 4.2 1.4. 3.4 1.7. 6.8 1.1. 7.2 1.5. Experimental conditions as in Fig. 3. a Values calculated considering a S/N ratio of 3 for the LOD and 10 for the LOQ. b Expressed as R.S.D. (%) for corrected peak areas (Ac) and migration times (t) obtained from 5 consecutive injections of a standard sample 10−4 M in each enantiomer. c Expressed as R.S.D. (%) for corrected peak areas (Ac) and migration times (t) obtained from 2 individual standard samples injected by triplicate in the same day.. aration of most protein amino acids and also in the presence of two non-protein amino acids. However, under the selected conditions, an increase in the migration times of the last peaks in the separation was observed with the time. Different protocols for capillary preconditioning between injections were studied with the uncoated fused-silica capillaries used. A preconditioning with 0.1 M H3 PO4 , water and BGE (2 min each) with an exchange of vials between injections was selected because it enabled to get the best repeatability for migration times of peaks corresponding to two amino acids selected in the first- and second-migrating zone (Orn, R.S.D. < 1.0%, and Thr, R.S.D. < 1.4%, for ten consecutive injections). 3.2. Application of the chiral EKC method to the analysis of fermented foods With the aim of applying the chiral method developed to the enantiomeric determination of Orn in fermented foods, the analytical characteristics of the method were studied. Table 2 shows the linear working range, LOD and LOQ, and precision of the method. LOD and LOQ were 9.0 × 10⁻⁶ and 3 × 10⁻⁵ M, respectively, for both enantiomers. Acceptable values of precision (R.S.D. < 1.7% for migration times and <4.2% for corrected peak areas) were obtained. In addition, the existence of possible matrix interferences was investigated by comparing the calibration slopes obtained by the external standard and the standard addition calibration methods. The results obtained by comparing the two calibration lines (confidence limits of the slopes, P < 0.05) showed that there were not statistically significant differences between the slopes obtained by the two calibration methods for both enantiomers. Then, the external standard calibration method was used to determine Orn enantiomers in fermented foods such as a rose wine, a beer, and vinegar. Orn was not detected in the vinegar sample while l-Orn was determined in the rose wine and l-Orn and d-Orn were determined in the beer sample. l-Orn concentration in the wine sample was 4.2 × 10⁻⁵ M, while concentrations for l-Orn and d-Orn in the beer sample were 1.5 × 10⁻⁴ and 1.4 × 10⁻⁵ M, respectively. Recoveries higher than 80% were obtained. As an example, Fig. 4a shows the electropherogram corresponding to the rose wine analyzed showing that Orn could be determined in an analysis time lower than 15 min with a total capillary length of 72.5 cm. Another advantage of the method was the possibility of shorting even more the analysis time using shorter capillaries depending on the complexity of the sample. Thus, Fig. 4b shows the electropherogram corresponding to the beer sample obtained with a capillary length of 48.5 cm which enabled Orn analysis in less than 6 min.. Fig. 4. Electrophoregrams corresponding to different fermented foods derivatized with AQC (a) a rose wine and (b) a beer. Experimental conditions: (a) uncoated fused-silica, 50 m × 72.5 cm; injection by pressure in the cathodic end, 5066.25 Pa for 20 s of sample followed of 5 s of BGE; non-spiked sample and sample spiked with 2.5 × 10⁻⁵ M racemic Orn; (b) uncoated fused-silica, 50 m × 48.5 cm; injection by pressure in the cathodic end, 5066.25 Pa for 5 s of sample followed of 5 s of BGE; nonspiked sample and sample spiked with 5 × 10⁻⁴ M racemic Orn. Other conditions as in Fig. 3..
(7) Author's personal copy. A.B. Martı́nez-Girón et al. / J. Chromatogr. B 875 (2008) 254–259. 4. Conclusions A new analytical methodology was developed by EKC enabling the simple and fast (<15 min) enantiomeric separation of Orn in complex mixtures of amino acids. AQC derivatives for all the amino acids were obtained prior to their analysis by chiral EKC. The best enantiomeric separations were achieved with a dual CD system composed by 5% (m/v) HS--CD and 2% (m/v) acetylated-␥-CD in 50 mM phosphate buffer (pH 2.0) at −25 kV and 15 ◦ C. 19 chiral amino acids including 18 protein ones and Orn were enantiomerically separated in about 45 min. Orn enantiomers were separated with high resolution (>20) and without interferences from the 20 protein amino acids and the non-protein achiral amino acid GABA showing the huge potential of the method developed for food analysis. The developed method showed enough sensitivity for the detection of Orn enantiomers in samples with complex matrices such as fermented foods. This is the first time that CE was applied to the determination of Orn enantiomers in fermented foods. Orn was determined in a rose wine and a beer but it was not detected in the vinegar sample analyzed. Acknowledgements Authors thank the Ministry of Education of Science (Spain) and the Comunidad Autónoma de Madrid (Spain) for research projects CTQ2006-03849/BQU and S-0505/AGR-0312, respectively. Carmen Garcı́a-Ruiz thanks the Ministry of Science and Technology (Spain) for the Ramón y Cajal program (RYC-2003-001). Ana Belen Martı́nez Girón and Elena Domı́nguez-Vega thank the University of Alcalá for their pre-doctoral grants.. [2] [3] [4] [5] [6] [7] [8] [9] [10] [11] [12] [13] [14] [15] [16] [17] [18] [19] [20] [21] [22] [23]. [24] [25] [26] [27] [28] [29] [30] [31] [32]. References [1] D. Heems, G. Luck, C. Fraudeau, E. Vérette, J. Chromatogr. A 798 (1998) 9.. [33] [34]. 259. H. Wan, L.G. Blomberg, J. Chromatogr. A 875 (2000) 43. C. Simó, C. Barbas, A. Cifuentes, Electrophoresis 24 (2003) 2431. H. Brückner, D. Becker, M. Lüpke, Chirality 5 (1993) 385. T. Erbe, H. Brückner, J. Chromatogr. A 881 (2000) 81. M. Castro-Puyana, A.L. Crego, M.L. Marina, C. Garcı́a-Ruiz, Electrophoresis 28 (2007) 4031. H. Brückner, M. Hausch, Chromatographia 28 (1989) 487. T. Bauza, A. Blaise, F. Daumas, J.C. Cabanis, J. Chromatogr. A 707 (1995) 373. K.R. Kim, J.H. Kim, E.-J. Cheong, C.-M. Jeong, J. Chromatogr. A 722 (1996) 303. G. Nouadje, N. Simeón, F. Dedieu, M. Nertz, Ph. Puig, F. Couderec, J. Chromatogr. A 765 (1997) 337. Q. Dong, W. Jin, J. Shan, Electrophoresis 23 (2002) 559. D. Kutlán, I. Molnár-Perl, J. Chromatogr. A 987 (2003) 311. V. Lozanov, S. Petrov, V. Mitev, J. Chromatogr. A 1025 (2004) 201. B. Suárez-Valles, N. Palacios-Garcı́a, R. Rodrı́guez- Madrera, A. Picinelli-Lobo, J. Agric. Food Chem. 53 (2005) 6408. R. Mayadunne, T.-T. Nguyen, P.J. Marriott, Anal. Bioanal. Chem. 382 (2005) 836. N. Komatsuzaki, J. Shima, S. Kawamoto, H. Momose, T. Kimura, Food Microbiol. 22 (2005) 497. E.M. Snowdon, M.C. Bowyer, P.R. Grbin, P.K. Bowyer, J. Agric. Food Chem. 54 (2006) 6465. S. Mangani, S. Guerrini, L. Granchi, M. Vincenzini, Curr. Microbiol. 51 (2005) 6. Y. Ardö, Biotechnol. Adv. 24 (2006) 238. E. Larqué, M. Sabater-Molina, S. Zamora, Nutrition 23 (2007) 87. J.P. Greenstein, M. Winitz, P. Gullino, S.M. Birn-Baum, M.C. Otey, Arch. Biochem. Biophys. 64 (1956) 342. G.R. McKinney, J. Pharmacol. Exp. Ther. 101 (1951) 345. D.L. Dhalman, M.A. Berge, Possible Mechanisms for Adverse Effects of l-Canavanine on Insects. Natural resistance of plants to pests: roles of allelochemicals, 1986, p. 118. P. Rhodes, C.S. Barr, A.D. Struthers, Eur. J. Clin. Invest. 26 (1996) 325. G. Fuermonte, V. Dolce, L. David, F.M. Santorelli, C. Dionisi-Vici, F. Palmieri, J.E. Walker, J. Biol. Chem. 278 (2003) 32778. H. Brückner, T. Westhauser, Chromatographia 39 (1994) 419. H. Brückner, M. Langer, M. Lüpke, T. Westhauser, H. Godel, J. Chromatogr. A 697 (1995) 229. J. Lee, K.-R. Kim, S. Won, J.-H. Kim, J. Goto, Analyst 126 (2001) 2128. R. Pätzold, H. Brückner, Eur. Food Res. Technol. 223 (2006) 347. M.E. Swartz, J.R. Mazzeo, E.R. Grover, P.R. Brown, Anal. Biochem. 231 (1995) 66. L.J. Jin, I. Rodriguez, S.F.Y. Li, Electrophoresis 20 (1999) 1538. S. La, S. Ahn, J.-H. Kim, J. Goto, O.-K. Choi, K.-R. Kim, Electrophoresis 23 (2002) 4123. P. Zakaria, M. Macka, P.R. Haddad, J. Chromatogr. A 1031 (2004) 179. B. Chankvetadze, J. Chromatogr. A 906 (2001) 309..
(8)
Figure
Documento similar
Parameters of linear regression of turbulent energy fluxes (i.e. the sum of latent and sensible heat flux against available energy).. Scatter diagrams and regression lines
It is generally believed the recitation of the seven or the ten reciters of the first, second and third century of Islam are valid and the Muslims are allowed to adopt either of
In the preparation of this report, the Venice Commission has relied on the comments of its rapporteurs; its recently adopted Report on Respect for Democracy, Human Rights and the Rule
The draft amendments do not operate any more a distinction between different states of emergency; they repeal articles 120, 121and 122 and make it possible for the President to
The stability and fragmentation dynamics of several positively charged molecules in the gas phase have been studied: thymidine, glycine, β-alanine, γ -aminobutyric acid,
In the “big picture” perspective of the recent years that we have described in Brazil, Spain, Portugal and Puerto Rico there are some similarities and important differences,
ovalisporum UAM-MAO The influence of Arg and Gly in CYN production, considering that these amino acids could favor the synthesis of the toxin in two manners: first, by providing
In this Doctoral Dissertation, the impressive analytical power of on-line comprehensive two-dimensional liquid chromatography (LC × LC) for the separation of very complex natural
