Gene expression profiling reveals key genes
and pathways related to the development of
non-alcoholic fatty liver disease
Ruifeng Wang,* Xiaobing Wang,** Liwei Zhuang*
* Gastroenterology and Hepatology Department, the Forth Affiliated Hospital of Harbin Medical University, Harbin, Heilongjiang province, China. ** Gastroenterology and Hepatology Department, the First Affiliated Hospital of Harbin Medical University, Harbin, Heilongjiang province, China.
A B S T R A C T A B S T R A C T A B S T R A C T A B S T R A C T A B S T R A C T
Background. Background.Background. Background.
Background. This study aims to identify key genes and pathways involved in non-alcoholic fatty liver disease (NAFLD). MaterialMaterialMaterialMaterialMaterial and methods.
and methods.and methods. and methods.
and methods. The dataset GSE48452 was downloaded from Gene Expression Omnibus, including 14 control liver samples, 27 healthy obese samples, 14 steatosis samples and 18 nonalcoholic steatohepatitis (NASH) samples. Differentially expressed genes (DEGs) between controls and other samples were screened through LIMMA package. Then pathway enrichment analysis for DEGs was performed by using DAVID, and alterations of enriched pathways were determined. Furthermore, protein-protein interaction (PPI) networks were constructed based on the PPI information from HPRD database, and then, networks were visualized through Cytoscape. Additionally, interactions between microRNAs (miRNAs) and pathways were analyzed via Fisher’s exact test. Results Results Results Results Results... A total of 505, 814 and 783 DEGs were identified for healthy obese, steatosis and NASH samples in comparison with controls, respec-tively. DEGs were enriched in ribosome (RPL36A, RPL14, etc.), ubiquitin mediated proteolysis (UBE2A, UBA7, etc.), focal adhe-sion (PRKCA, EGFR, CDC42, VEGFA, etc.), FcγR-mediated phagocytosis (PRKCA, CDC42, etc.), and so on. The 27 enriched pathways gradually deviated from baseline (namely, controls) along with the changes of obese-steatosis-NASH. In PPI networks, PRKCA interacted with EGFR and CDC42. Besides, hsa-miR-330-3p and hsa-miR-126 modulated focal adhesion through targeting VEGFA and CDC42. Conclusions.Conclusions.Conclusions.Conclusions.Conclusions. The identified DEGs (PRKCA, EGFR, CDC42, VEGFA), disturbed pathways (ribosome, ubi-quitin mediated proteolysis, focal adhesion, FcγR-mediated phagocytosis, etc.) and miRNAs (hsa-miR-330-3p, hsa-miR-126, etc.) might be closely related to NAFLD progression. These results might contribute to understanding NAFLD mechanism, conducting ex-perimental researches, and designing clinical practices.
Key words. Key words.Key words. Key words.
Key words. Non-Alcoholic Steatohepatitis. Differentially expressed genes. Pathway. Network. microRNA.
March-April, Vol. 15 No. 2, 2016: 190-199
INTRODUCTION
Non-alcoholic fatty liver disease (NAFLD) is the most common cause of liver disease worldwide with a
preva-lence of 15-30% in Western populations.1-4 In patients
with NAFLD, nearly one quarter is nonalcoholic
steato-hepatitis (NASH),5 which is defined as the presence of
he-patic steatosis and inflammation with hepatocyte injury
(ballooning) with or without fibrosis.6 Many conditions,
including obesity and location of fat storage, play a role in
the pathogenesis of NAFLD, especially NASH.7
Howev-er, the molecular mechanism underlying NAFLD is still vague.
In the past years, NAFLD-related genes and microR-NAs (miRmicroR-NAs) have been discovered. Previous studies have shown elevated levels of C-reactive protein (CRP), interleukin-6 (IL-6) and vascular endothelial growth
fac-tor (VEGF) in NASH patients compared with controls.8,9
The genetic variant I148M (rs738409) in Patatin-like phospholipase domain-containing 3 (PNPLA3) affects the secretion of hepatic very low density lipoproteins (VLDL) and promotes intracellular lipid accumulation in the liver by reducing the lipidation of VLDL, facilitating
NAFLD development.10 Besides, miRNA-10b has been
proven to regulate steatosis level by targeting peroxisome
proliferator-activated receptors (PPAR)-α expression in
The Official Journal of the Mexican Association of Hepatology, the Latin-American Association for Study of the Liver and
the Canadian Association for the Study of the Liver
Manuscript received: Manuscript received: Manuscript received: Manuscript received:
Manuscript received: December 30, 2014. Manuscript accepted: Manuscript accepted: Manuscript accepted: Manuscript accepted: Manuscript accepted: May 24, 2015.
NAFLD.11 It’s reported that apoptosis-related p53
overex-pression activated miR-34a/SIRT1/p53 pathway in
NAFLD morbid obese patients.12
Along with the development of high-throughput tech-nology, microarray analysis and next-generation sequenc-ing have been widely utilized to identify candidate disease-related genes and pathways. Based on RNA sequencing analysis of Shp(-/-) mice, novel gene signa-tures implicated in NASH have been identified and validated, including tetraspanin 4 (TSPAN4), peptidoglycan recognition protein 2 (PGLYRP2), thrombospondin 1
(THBS1), dual specific phosphatase-4 (DUSP4), etc.13
Through gene expression profiling and gene set
enrich-ment analysis, Yoneda, et al. have found genes involved in
NASH, including 27 up-regulated gene sets and 25
down-regulated gene sets.14 By analyzing gene expression
pro-files in high- and low-risk NAFLD patients, Moylan, et al.
has found a 64-gene profile that can differentiate severe NAFLD from mild NAFLD and an independent 20-gene
subset that correlates with NAFLD severity.15 Through
array-based DNA methylation and mRNA expression profiling analyses of liver samples from healthy obese pa-tients, steatosis papa-tients, NASH papa-tients, and controls,
Ah-rens, et al.16 have discovered NAFLD-specific mRNA
expression and DNA methylation of nine genes coding for
key enzymes in intermediate metabolism (including PC,
ACLY and PLCG1) and insulin/insulin-like signaling
(in-cluding IGF1, IGFBP2 and PRKCE). It’s also found that
NAFLD-associated methylation changes were partially re-versible. However, the pathways changed in NAFLD pro-gression, and the miRNAs that regulate these altered pathways are still unclear.
In this study, the microarray dataset GSE48452
up-load-ed by Ahrens, et al.16 was further analyzed to screen
differ-entially expressed genes (DEGs) between healthy obese samples, steatosis samples, NASH samples, and controls. Then, pathway enrichment analysis was performed for DEGs, and variation of enriched pathways at different sta-tuses was detected. Furthermore, protein-protein
interac-tion (PPI) networks were constructed. Addiinterac-tionally, miR-NAs targeting DEGs enriched in pathways were predict-ed. These results might be conducive to further experimental studies and provide better understanding of the nosogenesis of NAFLD.
MATERIAL AND METHODS
Gene expression data
The gene expression data set GSE48452 was download-ed from Gene Expression Omnibus (GEO, http:// www.ncbi.nlm.nih.gov/geo/), including 14 control liver samples (group C), 27 healthy obese samples (group H), 14 steatosis samples (group S) and 18 NASH samples (group N). It should be noted that only gene expression data were downloaded, and thus the sample size and infor-mation of enrolled individuals are different from the
pre-vious article of Ahrens, et al. In addition, information on
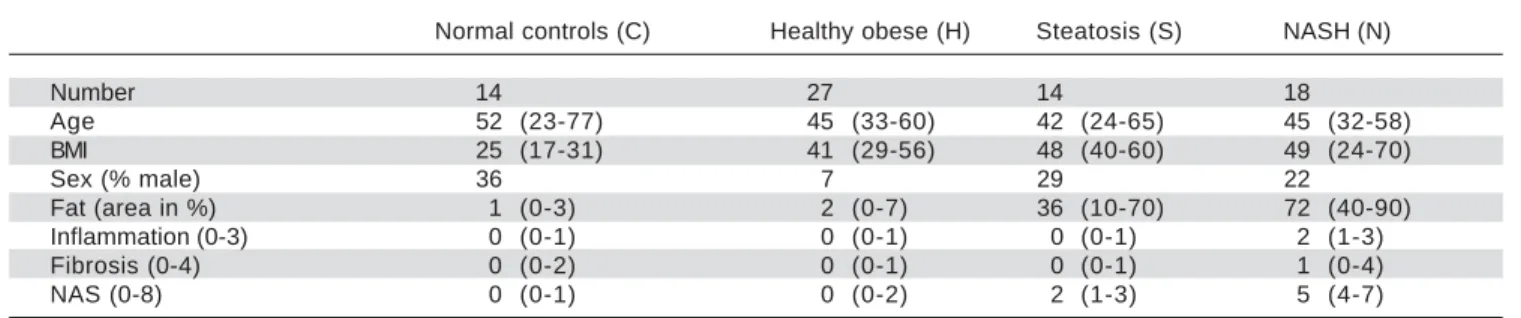
sample number, age, body mass index, sex, fat area, inflam-mation, fibrosis, and non-alcoholic fatty liver disease activ-ity score were collected from GEO (Table 1). Gene expression levels were measured by using [HuGene-1_1-st] Affymetrix Human Gene 1.1 ST Array [transcript (gene) version] (Affymetrix Inc., Santa Clara, California, USA). For the gene expression experiment, all patients provided written and informed consent, and its protocol was approved by the institutional review board (“Ethikkom-mission der Medizinischen Fakultät der Universität Kiel,”
D425/07, A111/99).16
DEGs screening
Linear Models for Microarray Data (LIMMA)
package17 of Bioconductor (available at http://
www.bioconductor.org/packages/release/bioc/html/) was used to identify genes that were differentially expressed
between healthy obese and control samples (H vs. C),
be-tween steatosis and control samples (S vs. C), and between
Table 1. Overview for normal controls, healthy obese samples, steatosis samples, and NASH samples.
Normal controls (C) Healthy obese (H) Steatosis (S) NASH (N)
Number 14 27 14 18
Age 52 (23-77) 45 (33-60) 42 (24-65) 45 (32-58)
BMI 25 (17-31) 41 (29-56) 48 (40-60) 49 (24-70)
Sex (% male) 36 7 29 22
Fat (area in %) 1 (0-3) 2 (0-7) 36 (10-70) 72 (40-90)
Inflammation (0-3) 0 (0-1) 0 (0-1) 0 (0-1) 2 (1-3)
Fibrosis (0-4) 0 (0-2) 0 (0-1) 0 (0-1) 1 (0-4)
NAS (0-8) 0 (0-1) 0 (0-2) 2 (1-3) 5 (4-7)
NASH and control samples (N vs. C). Because the DEGs
with |log2 fold change (FC)| > 1 were rare, |log2 FC| g
0 and p-value < 0.01 were chosen as the cut-off criteria.
Pathway enrichment analysis
Kyoto Encyclopedia of Genes and Genomes (KEGG) pathways enriched by the three sets of DEGs were re-vealed by using the Database for Annotation, Visualization and Integrated Discovery (DAVID, available at http://
david.abcc.ncifcrf.gov/).18 The p-value < 0.1 was set as the
cut-off criterion.
Scoring altered pathways
Three sets of significantly enriched pathways (H vs. C,
S vs. C, and N vs. C) were combined, and a total of N
path-ways were obtained. The deviations of every pathway at status H, status S, and status N from status C were
calcu-lated based on gene expression levels.19 Firstly, DEGs
from the gene pool of a specific pathway were selected out. Secondly, p-value was converted to Z-score (Z) by using inverse cumulative distribution function. Finally, an alteration score of a pathway, namely A (P), was deter-mined for pathway P based on DEG Z-scores and follow-ing algorithm:
Several issues should be taken into account. First, not all DEGs involved in a pathway had significant influence on this pathway. For example, changes of downstream genes might be induced by abnormalities of upstream genes. In other words, changes of upstream genes involved in pathway could have more significant influence on path-ways. Second, number of genes varies in different pathways. Thus, random perturbation treatment was ap-plied to eliminate the influence of pathway size. During calculation, Z-score of DEGs was sorted in descending order. Bigger Z-score meant higher degree of differential expression. Assuming that pathway P contained k DEGs, when t genes (1 < t < k) had maximum average Z-score, these t genes were considered to have the most signifi-cant contribution to the pathway P, and then, A (P) was also calculated. In order to eliminate the influence of
pathway size, normalization of each A (P) to Acorrected(P)
score was accomplished by correcting background dis-tributions based on the mean and standard deviation which were derived from A(P) scores of 10,000 random sets of k genes.
Construction of
protein-protein interaction networks
PPIs were obtained from Human Protein Reference
Database (HPRD, available at http://www.hprd.org/)20 via
Python program.21 If a protein normally expressed in
hu-man interacted with at least three DEGs, this protein would be selected to construct PPI networks together with DEGs. Then, PPI networks were visualized by using
Cytoscape (available at http://cytoscape.org/).22 Moreover,
in order to disclose changes of the networks at different statuses, topological properties of these networks were an-alyzed by using network analysis (a plugin in Cytoscape), such as degree, average shortest path length (ASPL), clus-tering coefficient (CC) and topological coefficient (TC).
Prediction of miRNAs
associated with significant pathways
The common regulatory relationships between miRNAs and DEGs were abstracted from three databases, including
miRecord,23 miRTarBase24 and Tarbase 6.0.25 A total of 5,489
interactions were obtained, containing 482 miRNAs and
2,331 target genes. Then, Fisher’s exact test26 was adopted to
identify pairs of miRNA and pathway with significant rele-vance. Fisher’s exact test examines whether the proportion of target genes (namely, target genes of miRNA) in the gene group is same to the proportion of target genes in the en-tire genome. There are two hypotheses: first, whether the gene belongs to target gene group or not; second, whether the gene belongs to functional gene group (for example, group of pathway genes). Fisher’s score was defined as the probability of at least x genes can be identified in functional gene group in the K target genes.
N represents the number of total genes in the whole genome; M represents the number of genes in a functional genes group; and K represents the number of target genes. Finally, altered pathways at different statuses were identi-fied, as well as the miRNAs regulating the corresponding pathways.
RESULTS
Identification of DEGs
According to the threshold (p-value < 0.01 and |log2
FC| g 0), a total of 505 DEGs (including 205 up-regulated
Zi 1 < t< k
A (P) =max √1t . i =
Σ
1t
Acorrected =A (p) - μk σk
N K
p = 1 – x-1
Σ
i = 0 M
i N - MK - i
Table 2. Pathway enrichment analysis result for the DEGs between healthy obese, steatosis, NASH, and controls.
Group (term) Count p-value DEGs
Obese
hsa00410: beta-alanine metabolism 5 0.001 CNDP1, EHHADH, ALDH2, HIBCH, DPYD hsa00310: lysine degradation 5 0.017 EHHADH, WHSC1L1, ALDH2, ACAT1, BBOX1 hsa05120: epithelial cell signaling in pylori infection 6 0.010 EGFR, CDC42, IL8, ATP6V0D2, ATP6V0B, ATP6V1F hsa00640: propanoate metabolism 4 0.036 EHHADH, ALDH2, HIBCH, ACAT1
hsa05110: Vibrio cholerae infection 5 0.039 PRKCA, ATP6V0D2, ATP6V0B, SEC61G, ATP6V1F hsa05130: pathogenic Escherichia coli infection 5 0.041 PRKCA, CDC42, TUBA8, KRT18, ARPC4
hsa00380: tryptophan metabolism 4 0.063 EHHADH, ALDH2, CAT, ACAT1
hsa04666: FcγR-mediated phagocytosis 6 0.066 PRKCA, DNM3, CDC42, WASF3, ARPC4, CRK hsa05219: Bladder cancer 4 0.071 EGFR, CCND1, IL8, MYC
hsa00280: valine, leucine and isoleucine degradation 4 0.079 EHHADH, ALDH2, HIBCH, ACAT1 hsa00510: N-glycan biosynthesis 4 0.088 MGAT5B, DPM2, DPAGT1, ALG14 hsa04120: ubiquitin mediated proteolysis 7 0.094 UBE2N, CBLC, UBE2I, FBXO4, ITCH,
UBE2L3, UBE2B
Steatosis
hsa03010: ribosome 27 0.001 RPL17, RPL36A, RPL14, RPL15, RPL27A, RPS27L, RPS25, RPS27, RPL30, MRPL13…
hsa04120: ubiquitin mediated proteolysis 14 0.004 UBE2A, UBA7, SKP1, UBE2B, RBX1, UBE2N, CUL2, UBE2D2, CUL7, UBA2…
hsa03050: proteasome 7 0.012 PSMA1, PSMC6, PSMD12, PSMA6, PSMA4, POMP, PSMD6
hsa05211: renal cell carcinoma 8 0.026 CDC42, CUL2, PAK2, VEGFA, RAP1B, TCEB1, CRK, RBX1
hsa04510: focal adhesion 15 0.041 PRKCA, PARVG, EGFR, FLT4, MYL12B, MYL12A, PPP1CB, KDR, CDC42, VEGFA
hsa04115: p53 signaling pathway 7 0.063 CCNB3, ZMAT3, TSC2, MDM2, RRM2B, CCNG1, GADD45A
hsa04144: endocytosis 13 0.083 EGFR, PLD2, RET, TSG101, ADRBK1, KDR, CDC42…
hsa00563: (GPI)-anchor biosynthesis 4 0.084 PIGG, PIGX, PIGW, PIGA
hsa03018: RNA degradation 6 0.088 WDR61, EXOSC4, LSM6, LSM3, CNOT7, LSM1
NASH
hsa03010: ribosome 18 0.001 RPL36A, RPL15, RPS8, RPS7, RPL18A, RPS3A, RPL22, RPL9, FAU, RPS13…
hsa04610: complement and coagulation cascades 11 0.001 C8B, FGG, C9, MASP2, C6, C5, TFPI, SERPINC1, C4BPB, C4BPA…
hsa00140: steroid hormone biosynthesis 7 0.018 AKR1C2, HSD17B2, CYP7A1, SRD5A1, SRD5A2, UGT2A3, AKR1C1
hsa04666: FcγR-mediated phagocytosis 10 0.030 PLCG1, LIMK1, CFL2, PIP5K1C, ARPC5, INPP5D, VAV2, PRKCE, PRKCD, SYK
hsa04930: type II diabetes mellitus 6 0.064 SOCS2, PKLR, IKBKB, PRKCE, INSR, PRKCD hsa04210: apoptosis 5 0.075 GTF2E2, TAF7, GTF2A2, TAF9B, GTF2B hsa05020: prion diseases 5 0.075 NCAM2, C8B, C9, C6, C5
hsa00910: nitrogen metabolism 4 0.087 CTH, CA14, CA12, HAL
hsa03320: PPAR signaling pathway 7 0.097 ME1, LPL, PLIN1, CYP7A1, SCD, FADS2, FABP4
SYP LTBP1 ARPC4 CRIP2 ANKS1B TUBA8 PCDH18 SIAH1 NEBL PFN2 ATN1 WASF3 LRP2 DAB1 ACTB EIF2B2 EWSR1 RASD1 DLG4 NEDD9 GLRX3 ACTR3 MYH1 DNM1 IL8 WASF1 BCAR1 TRPC4 LRP1B PRKCZ NCK1 ACTA1 PLSCR1 GRB2 SNRPC DNMBP PXN PEG10 NCKAP5 DUSP19 ABCC9 MAP3K5 EIF6 KIAA1217 KRT81 UBE2B EEF1G UPF3B KRT15 EIF2AK2 ATXN1 HABP4 MAPK8 PPP2R5A STAT1 BCL2 RNF11 KRT18 RGS4 JAK2 GNB2L1 CALD1 CBL EGFR CASP7 MAP3K4 DGKZ ADRA1A ERC1 CRTC1 CAT RHOXF2 PPP1R9A POLR2A PPP1R15A CDC42 ADRA1D SNTB1 BIK YWHAG SPG20 PRKCA PLAT SHC1 PDGFRB YWHAZ HSPA1AITGB4 PRKCD GNAI1 RGS2 NOS1 GDE1 GNAO1 RGS19 RGS16 PTPN11 ERBB3 ENTPD5 PTPN6 GNAI2 SEMG2 EPS15 CHAC1 ACTG1 STAU1 MYO9A UPF2 EIF4A1 PIK3R1 MLF1 PTK2 CBLC JAK1 FYN MDK -EIF2S1 VAV1 ANXA2 SERPINE1 ITCH LYN UPF1 PLD1 CCT2 SRC LCK PTK2B CRK COPS6 RBM8A PPP2R5E PSMA1 MCM7 ZNF691 FAU PDZK1IP1 PDLIM4 SMC1A MCM6 HAP1 PPP1R15B ALDH2 PPP1CA UNC119 CSTF1 LZTS1 CASP3 TP53 MCM4 CHAF1B H2AFX PCLO NPM1 KPNA2 NR3C1 FOXM1 ATP6V1F BLMH CDK2 ATM RFC1 PCNA EP300 SENP3 TRIB3 GIT1 CHEK2 CKS2 CBX8 TXN KIAA1377 CDK1 GADD45A SMARCA2 RELA BRCA1 NCOR1 TRIP6 CDCA5 IER3 SNTG1 BAIAP2L1 SLC25A3 VDAC1 DMD STAT3 JUN MBP AKT1 MAPK14 ITPR2 SLC2A4 TGFBR1 UBA52 RB1 TMEM132A RAPGEF2 FOS AURKA CHEK1 ARNTL UBE2L3 MYC CTNNB1 UBE2I HSPA5 ESR1 PRKACA RAN CTNNA3 CCND1 SMAD4 THRB POLD4 SERTAD1 LRP6 RAD51AP1 LITAF RAD54L SMAD2 SMAD3 TBL1X ZNF646 DACH1 NCOA1 NCOR2 RAD51 TUBA4A CALM1 SYT1 S1PR1 HSP90AA1 KAT5 TUBA1A KRT8 SUMO4 MAPK1 XRCC6 MAPK3 UBE2N MEP1B UBB PPIA AR HGS LMNA RAF1 FAS CDK4 CREBBP SUMO2 GSK3B
and 300 down-regulated DEGs), 814 DEGs (including 283 up-regulated and 531 down-regulated DEGs), and 783 DEGs (including 392 up-regulated and 391 down-regulat-ed DEGs) were identifidown-regulat-ed between healthy obese and con-trol samples (H vs. C), between steatosis and control
samples (S vs. C), and between NASH and control
sam-ples (N vs. C), respectively.
Pathway enrichment analysis for DEGs
In H vs. C contrast group, DEGs were significantly
en-riched in 6 KEGG pathways, such as FcγR-mediated
phagocytosis (PRKCA,CDC42, etc.), ubiquitin mediated
proteolysis (UBE2N, UBE2B, etc.), and so on. In S vs. C
contrast group, DEGs were markedly enriched in
ribos-ome (RPL36A, RPL14, etc.), ubiquitin mediated
proteoly-sis (UBE2A, UBA7, etc.), focal adhesion (PRKCA, EGFR,
CDC42, VEGFA, etc.), and so on. Meanwhile, in N vs. C contrast group, DEGs were significantly enriched in
ri-bosome (RPL36A, RPL15, etc.), FcγR-mediated
phagocy-tosis (PRKCE, PRKCD, etc.), and so on (Table 2).
Alterations of pathways
After combining the above three sets of pathways en-riched by DEGs, a total of 27 significant pathways were
ob-tained. Taking normal controls as the baseline (Figure 1), alteration score was determined for each pathway. On the
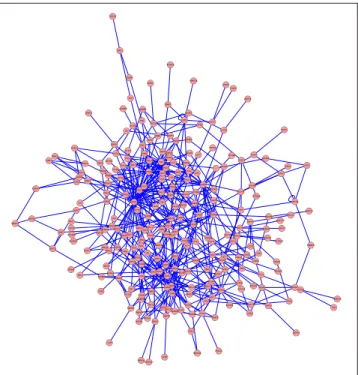
Figure 2. Figure 2.Figure 2. Figure 2.
Figure 2. The protein-protein interaction network for the differentially ex-pressed genes between healthy obese samples and normal controls. Figure 1.
Figure 1. Figure 1. Figure 1.
Figure 1. The line chart displaying the deviation of the 27 pathways at three statuses. Blue line: healthy obese; red line: steatosis; green line: NASH. The 27 biological pathways are in X-axis and alteration score of the pathway is in Y-axis. NASH: nonalcoholic steatohepatitis.
a m o ni cr a c l le c l a n e R Bladder cance r Ribosom e N-glyc an biosy
nthesis
Epithelial cell signaling in
Helicobacter py lori infect
ion Focal adhesio n Ubiquitin mediated proteolysi s beta-alanine metabolis m Vibrio cholerae infectio n Proteasom e Apoptosi s
RNA degradat ion Tryptophan metabolis m Nitrogen metabolis m
Fc gamma R-med
iated phagocytos is
Type II diabetes mellitu s Prion disea ses
p53 signaling pathwa y Endocytosi s Steroid hormone biosynthesi s Valine, leucine
and isoleucine degradatio n Glycosylphosphatidylinositol (GPI)-anchor biosynthesi s Lysine degradatio n Propanoate metabo lism Pathogeni c Escher
ichia coliinfect
ion
Complement and coagulation
NOL4 PDLIM5 RPL18APRKCG ANXA13 PEBP1 EIF3L TAF9B RGS2 E2F3 RB1 KAT5 RPS7 BRCA1SERTAD1 SIRT1 MCM2 EFNA1 KIAA1377 NFKB1 PCLO HAP1 FUNDC2 AR H2AFY WDR74 JUN TBC1D4 BCL3 RPL10 LPL MDM2
HNF4A RELA RNF11
CACHD1 WNK1 ATN1 STXBP1KCNK3 LSM6 VDAC1 ESRRA FOS FLII PIP5K1C SNAP25 IKBKAP ALPL GLIS2 IKBKB FBL
IKBKEGRIA3HSP90AA1 PRKCB ESR1 DFNA5 PVRL1 TBPL1 TBP PVRL2 NFKBIB RPS3A COPS6 GPD1 MAP3K14 NFKB2 FMNL3 TXNDC11 ANKS1B SYT7 EWSR1 GFI1B PICK1 YWHAE PFKL CSTF1 GTF2E2 RPS25 TOMM20 NKRF SPDEF PTPN9 GTF2E1 TAF7 GTF2F2POLR2A TRAM2 APOF HPR RPS26 NDRG1 RPS8 RPS11 HSF1 ATF7IP RPL15 POLR2H FAU GTF2A2 RPS13 APOA1 FASN SLC12A4 TSPAN3 RPL4 LSP1 BMPR2 UBQLN4 PDIA5 APP ROCK1 MSN ANGPTL3 P4HB SPARC ITGA5 ITGAV COL1A2 SPP1 COL3A1 CD93 THBS1 TUBG2 SEMA3F LRG1 COL1A1 ITGB3 FGG LIMK1 DES FN1 MMP9 TFPI MYOC ST6GALNAC2 ANXA5 C4BPAEIF4B ACTG1 MMP14 SHBG CAPN1 IGFBP3 UNC119 PXN CAV1 PTPRCAP VIL1 PAK2 CD74 DOCK9 S100A1 FLNA EPHB2 TIAM1 CFL2 NUMB CASP3 -SMAD3 ALDOA MEP1B CSNK2A2 UBE2I BCL2L1 DPYSL2 CSNK2A1 HLA-DQA1 UBE2B POLA2 CDC42 CD247 S100A4 ITGB1 CD44 THY1 CAMK2G PAK1 IGF1 MMP7 MET CHAT HCK VIM LCK FYN NT5E GRIN2B EFCAB4B GTF2B ARF3 PPIF NSF STX3STX2 STX1A RBCK1 HTT WIPI1 NR0B2 BARD1 ZNF639 LRP2 COX5B PRKAA2 NAV1 ZMIZ1 PTN WWP2 NELL2 PRPF40A AKT1 OPTN RASAL2 TOM1L2 MLLT4 PEX2 MVD CDK4 RPL37A
CDKN2A MAD2L1BP CEBPZ
CDK5RAP2 EP300 ASCC2 CASP8CREBBP HDAC6 MYO5A PLIN1 EIF6 ATF1HDAC1
SP1 RUNX2 GIT1
PRMT1 MYO1E YWHAG TEP1 DYNC1H1 GTF2H1 SDHAF2 CDH1 PFKFB2 TRAF2YWHAQUBE2D2IL1RAP
IRS1 CTNNB1 PTPRM GNA12 NFKBIA C14orf1 SMN1 EPHA3 SMAD2 TLE1 SETDB1 TOR1AIP1 GPR17 UBE2N RASA1 NDFIP2 LBR PCSK5 PYGB LMNB1 MRAS NEDD4 AQP3 GM2A LEF1 DARS SREBF2 NEFL PPP1R9B MAGED2 RPA2 STMN2 PSMC6 CD14 PSMD12 TRAF6 CRK MAPT ADRBK1 RPS6KA1 CD40LG PRKCD SRC STAT3 GADD45A GSK3B CRMP1 EED RTN1 CNOT7 PPP2R1B PPP2R5E PPP1R8 TUBBAPAF1 LRP1 NIN RFC1 LUC7L2 ACLY CDK1 TP53I3 PPP1CA PLD2 SMC1AGOLM1MAPK1
MAPK3 LYN LTBP1 YWHAZ NEBL ACTN1 KCNJ4 OPRD1 GNA13 YWHAB UBB PIK3CA PCNA C1orf103CRADDMCM6
EEF1G EEF1A1 ZNF646 CDK5R1 TP53 DYNLL1 SNAPIN PRKACA PRKCA IFNAR1 TNIK PRKCE GNB2L1 PTPN3MICAL1 SHC1 RAC1 SYK SH3KBP1 INSRITGA6 SH2B3 ROBO1 ABL1 RALGPS1 SYP MYO9B MYO7A KIT DEF6 ZAP70 RHOA GAB1 PTPN11 FABP4 GRB2 TRPV4 KSR1 EGFR IGF1R STAT1 PLCG1 PKN1 CBL PTPRC JAK3CD151 CALM1 TNK2 VAV2 LGALS1 SYN1 ACTA1 INPP5D RBM7 MAP4K1 ARHGAP21 DBNL LCP2 DOK1 NCK1 CD22 ROS1 EPOR SH3BP2 PECAM1 VAV1JAK1 PRKD1SOCS2 CRKL VAV3 CCDC85B BLNK CBLB ITGB2 PTPN6 PTK2B RNF128 PIK3R1 BTK SNCA MAST2 PDPK1 RAF1 ACTB PTK2 PPFIBP1 PRMT5 BLMH UBA2 EIF5 ITGA7 PKLR ECE1 TKT CES1 POLA1 PABPC1 GSPT2 C6 PROS1 PROZ F2 KLK2 LAMA3 P4HA2 PLG CP TRAPPC4 CASK SDC2 SERPINC1 SERPINA3 IGFBP2 RBMS1 C5 CPN1 C3 CFHR4 CFHR5 C8B CFL2 PLCB2 AMPH ACTN1 CABIN1 ACTB NEBL RPL30 ANGPTL3 RYK RPS13 CALM1 PDLIM5 CHRM3 CRKL AP2A2 IFNAR1 PRKCG KDR BAG2 CAV1 PLD2 ITGB3 GNAQ VEGFA LIMK1 CCT2 MAP3K14 IRS1 RLIMAKT1 RPS6 STAT5BSTAT5A TNK2 JAK2 CCT4 EPS15 MUC1 DNM1ITGA5 P2RY2 DEGS1 FLT1 ACTL6A EVL GALNT1 SIGLEC1 EPHB2 XRCC6 SLC25A3 YWHAQ LBR PXN PRMT5 MEP1B CSPG4
HCKYWHAG RHO
RPS6KB1 ZBTB6
PRKACAPAK1 PRKCDRAB5A
PIK3R1AGTR1 LYNPTPN6
PLCG2 FYN GRB10PLCG1
GAB1 LCK HSPA1A VAV1 BCL2 MAPK3MAPK1EGFR
SNRPC MYO9B
EPORFRS2 EWSR1
RPL31 SHC3 PTPN11 SRC RHEB AR GIT1 TSC2 YWHAB NCK1ATF7IP HSP90AA1 HDAC2 CDK2 DAXX SMURF1 BRMS1L TNIK CDK1 C1orf103 CCNG1 BAIAP2L1 KAT2A CHRNA4 AP3S1 ETF1 RPL28 ARAP1 EIF4A3 TUBA8 ALS2CL MYC CRIPAK RAP1B PLIN1 SGOL1 PARP10 TOM1L2NEDD1 RAB18
PPP2R5EPPP2R1A RPL7A RPL7 RPL10A PSMD6 PSMD12 SECISBP2 TRAF6 EIF3L BMPR1B DCUN1D1 ZNF639 BAZ1A RAB11A IRF7 TOM1L1 SMAD9 LZTR1 UBE2N IPO5 IPO7 RPS7 TGFBR1 TNPO1 RPL23A CWF19L1GLUD2 PAIP1 PAN2 PABPC1 PPP6C SPG7
ZNF440 IKBKAP TXNDC9
GTF2A2 HSF1
EXOSC6 C11orf49TAF9 CBX3
MAN2A2KRT15ARHGEF15 KAT5 WEE1 PTK2 NUMB -KRT18 MKNK1 CASP3 NMT2
HIST3H3 PRKCARETGRAP
PRKCE GRM1 PDGFRBKITMAP2K1
ITGB1 UBA7 ACTA1 EDF1
MMP7
ATF2 ADAP1 GRB2
CLEC1B F10 LMO3 COPS7A ZMIZ2 GABPB1 PIN1 SUFU FXR2 MBIP COMMD2 USMG5 UBR7 RBX1 THOC7 TCEB1 MLF1 COPS2 COPS3 FAM193B NEDD8 FBXW8 FBXO5 MLXIPL DCTPP1CUL7 DCTD GPS1 FBXO4 APP RRM2B CUL9 ERH HNRNPC RARG COPS4 NADK UBA2 RXRA EIF5 LNX2 S100A10 ID4 COMMD1IFI27 CRIPT
MXD3 CCNC RPL15 PROS1 TFPI F5 C21orf91 CHCHD3 UBE2B BLMH NINL PSMA7 RBM7 VHL CUL5 MAGEA11 CUL2 CUL1 MED8 COPS8 COPS6 LNX1 SKP1NAE1 CEP76 NIF3L1RNF139 ADRBK1 HTT ZAP70 HGS MBP RPL37A NDFIP2 SUZ12 CCNB3 USP16 EEF1A1 PPP2R1B EP300 SMAD2CREBBP LSM1 EXOSC4 EZH2 LSM5 SMN1 LSM7 RSL24D1 EIF1 RPS25 THUMPD3 NAA38 PPP2CA STAU1 COX5B DNM2 PDE6D ZMIZ1 MTOR PHAX UBB WDR61 CTNNAL1 RAN CNOT7 RPL5
SMAD4 SIN3A YWHAH
TSG101 XPO1 BUB1 IQGAP1 ABL1 PARP1 PTN ARL5B RANBP2 CDC37L1 TRIP13 ZFAND6 COX6C CDKN2A BUB3 EIF3F NEK1 RNF11 LSM6 LSM2 LSM3 UPF2 DARS MYD88 MINPP1 SOCS3 HOMER1 GJA1 GRM5BTK SORBS2 SYN1 RAF1 YWHAZ MAPK8IP3 COPB1 ANXA2 MAPK8 MAPK14 APPBP2
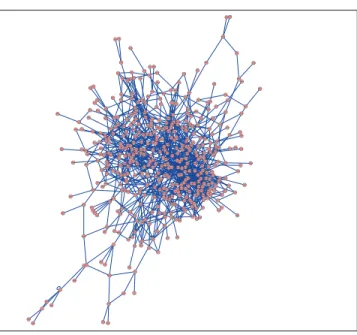
PSMC6PPP1CBMYOD1 TP53 MAP3K4 ATM BRCA1 VIM GADD45A CSNK2A2 RB1 UNC119 CHD3 ATXN1 SMAD3 CCND1 NFKBIA EIF4G1 SUPV3L1 LYPLA1 COPS5 UBQLN4 SOCS1 CIT GFAP S100A1 DLG4 DLGAP2 RPL9 PLG DNTTIP2 SKP2 NUDT21 TAF9BBTRC GSTO1 SAP18CKS1BEEF1GPLK1 TXN CEP57 API5 FGF2 PSMA3 RBBP8 COIL CCDC85B UBE2I BFSP1 HMGA1 CSNK2A1SETDB1 PCNA PSMA1 ZNF646 CXCL13 PSMA6 PSMA4 ZNF426 POLM PSMA2 C7orf64 KRTAP4-12 MDFI PSMB5 POMP TAF4 MRPL42 TRPC4AP TRAF2 TBP SPG21 HDAC1 SUB1 RPS3A KIAA1377 MAD2L1BP UBE2A PLSCR4 TAF1 NR3C1 PJA1 MDM2 ATF1PLSCR1NPM1 ESR1 SGSM2 CEBPB UBE2D2 RELA STAT3 AIMP1 TUBB CDC42 CBL ARF1 PLD1 SHC1 SHC2 GNB2L1 FLT4 PAK2 CRK FAS SOS1OPRD1 KSR1 PRKCB Figure 3. Figure 3. Figure 3. Figure 3.
Figure 3. The protein-protein interaction network for the differentially ex-pressed genes between steatosis samples and normal controls.
whole, all of the 27 pathways were gradually deviated from the baseline along with the change of normal-obesity-stea-tosis-NASH. Some pathways showed significant deviation from the baseline and obvious changes along with the change of normal-obesity-steatosis-NASH, such as ribos-ome, ubiquitin mediated proteolysis, focal adhesion and
Fc�R-mediated phagocytosis.
PPI networks analysis
The PPI network for DEGs in H vs. C contrast group
consisted of 254 genes and 551 interactions (Figure 2), and
Figure 4. Figure 4. Figure 4.
Figure 4. Figure 4. The protein-protein interaction network for the differentially ex-pressed genes between NASH samples and normal controls. NASH: nonal-coholic steatohepatitis.
some genes had high degrees, such as EGFR (degree = 49)
and PRKCA (degree = 40) (Table 3). Besides, in the
net-work for DEGs in S vs. C contrast group, there were 464
genes and 1,059 interactions (Figure 3), and some genes
had high degrees, such as EGFR (degree = 62), PRKCA
(degree = 47) (Table 3). Meanwhile, in these two
net-works, PRKCA interacted with numerous genes, such as
EGFR and CDC42. Furthermore, the network for DEGs
in N vs. C contrast group contained 471 genes and 995
interactions (Figure 4), and some genes had higher
de-grees, such as PRKCD (degree = 51) and PLCG1 (degree =
48) (Table 3). Additionally, along with the change of
obesi-Table 3. The top 10 genes in the PPI networks of obese, steatosis, and NASH.
Group Gene Degree Gene Degree
Obese EGFR 49 CDC42 22
PRKCA 40 KRT18 19
PTK2B 29 EIF2AK2 18
CRK 26 MYC 18
UBE2I 24 ATXN1 17
Steatosis EGFR 62 PTK2B 29
PRKCA 47 KDR 27
CRK 36 CDC42 26
MDM2 31 PPP2CA 23
HDAC1 30 PAK2 23
NASH PRKCD 51 HDAC1 23
PLCG1 48 PPP2CA 23
SYK 41 MET 20
INSR 34 KRT18 20
KDR 27 INPP5D 20
Table 5. The top 10 miRNA-target-pathway with the highest significant relevance.
miRNA KEGG pathway p-value DEGs
hsa-miR-7 hsa04144: endocytosis 0.001555 EGFR
hsa-miR-34c-5p hsa05219: bladder cancer 0.001578 MYC hsa-miR-106b hsa04120: ubiquitin mediated proteolysis 0.001630 ITCH
hsa-miR-29b hsa05211: renal cell carcinoma 0.001702 CDC42, VEGFA
hsa-miR-7 hsa05219: bladder cancer 0.001719 EGFR
hsa-miR-126 hsa04510: focal adhesion 0.001878 VEGFA, CRK hsa-miR-330-3p hsa04510: focal adhesion 0.001941 VEGFA, CDC42 hsa-miR-15a hsa05219: bladder cancer 0.002370 CCND1 hsa-miR-29a hsa04144: endocytosis 0.002834 CDC42, RET hsa-miR-34a hsa05219: bladder cancer 0.003064 CCND1
miRNA: microRNA. KEGG: Kyoto Encyclopedia of Genes and Genomes. DEGs: differentially expressed genes. The genes enriched in pathways were regula-ted by the corresponding miRNAs.
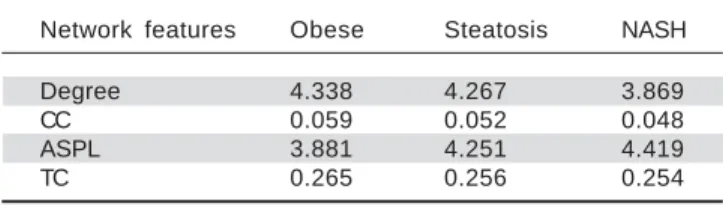
ty-steatosis-NASH, the average degrees of PPI network decreased, ASPLs of PPI network increased, CCs and TCs of PPI network exhibited small declines (Table 4).
miRNAs related to significant pathways
Some miRNAs were identified to regulate DEGs en-riched in a set of significant pathways. For instance, hsa-miR-126 and hsa-miR-330-3p regulated focal adhesion via
targeting VEGFA and CDC42 (Table 5).
DISCUSSION
In the present study, gene expression profiles of healthy obese, steatosis and NASH samples were compared to healthy controls, and a total of 505, 814 and 784 DEGs were identified, respectively. According to the pathway deviation analysis, obvious changes of pathways enriched by DEGs along with the change of normal-obesity-steatosis-NASH
were observed, such as ribosome (RPL36A, RPL14, etc.),
ubiquitin mediated proteolysis (UBE2A, UBE2B, etc.),
fo-cal adhesion (PRKCA, EGFR, CDC42, VEGFA, etc.), and
FcγR-mediated phagocytosis (PRKCA, CDC42, etc.).
Re-portedly, obesity is a risk factors of NAFLD,7 and NASH is
always developed from steatosis. Therefore, it’s supposed that obesity develops into steatosis, steatosis develops into
NASH, and these developments are associated with the de-viation of the 27 pathways.
Among these pathways, ubiquitin mediated proteolysis and ribosome were both associated with protein metabo-lism. In the liver with non-alcoholic steatosis or steato-hepatitis, inactivation of the ubiquitin-proteasome
pathway mediates cell death caused by oxidative stress.27
In this study, UBE2A (ubiquitin-conjugating enzyme E2A)
and UBA7 (ubiquitin-like modifier activating enzyme 7) were demonstrated to take part in ubiquitin mediated
pro-teolysis. Thus, UBE2A and UBA7 might be involved in
NAFLD through ubiquitin mediated proteolysis.
There is no relevant evidence showing ribosome is as-sociated with NASH or NAFLD, while ribosome is
closely related to apoptosis,28 which is a pathological
fea-ture of NAFLD and promote the development from
sim-ple steatosis to NASH.29 In the present study, RPL36A
(ribosomal protein L36α) and RPL14 (ribosomal protein
L14) were found to participate in ribosome pathway. In
addition, the expression levels of RPL36A were
signifi-cantly down-regulated in healthy obese samples (log2 FC
= -0.186), steatosis samples (log2 FC = -0.421), and
NASH samples (log2 FC = -0.340), in comparison with
normal controls; the expression levels of RPL14 were
sig-nificantly down-regulated in healthy obese samples (log2
FC = -0.104), steatosis samples (log2 FC = -0.221), and
NASH samples (log2 FC = -0.187), in comparison with
normal controls. The down-regulation of RPL36A and
RPL14 might further promote cell death. Therefore, these genes might play a role in NAFLD through ribosome pathway.
Focal adhesion is crucial in liver disease, because the stage of simple steatosis progressing over steatohepatitis to fibrosing steatohepatitis is characterised by adhesion of
leucocytes to the sinusoidal endothelium.30 In this study,
PRKCA (protein kinase C α), EGFR (epidermal growth
factor receptor), CDC42 (cell division cycle 42) and VEGFA
Table 4. Topological properties of the 3 networks.
Network features Obese Steatosis NASH
Degree 4.338 4.267 3.869
CC 0.059 0.052 0.048
ASPL 3.881 4.251 4.419
TC 0.265 0.256 0.254
(vascular endothelial growth factor A) were significantly enriched in focal adhesion. The expression levels of
PRKCA were significantly up-regulated in healthy obese
samples (log2 FC = 0.210), steatosis samples (log2 FC =
0.253), and NASH samples (log2 FC = 0.063), in
compari-son with normal controls. In the PPI networks for DEGs
of H vs. C contrast group and S vs. C contrast group,
PRK-CA had high degrees and interacted with EGFR and
CDC42. The study of Yang, et al. has shown that EGFs can
stimulate proliferation of hepatic stellate cells,31 which is
the primary effector cell, orchestrating the deposition of
extracellular matrix (ECM) in fibrotic liver.32 In this
study, the expression levels of EGFR were significantly
up-regulated in healthy obese samples (log2 FC = 0.224),
steatosis samples (log2 FC = 0.243), and NASH samples
(log2 FC = 0.059), in comparison with normal controls.
Besides, CDC42 participates in the activation of saturated fatty acid-induced c-Jun N-terminal kinase (JNK) in
hepatocytes,33 which is evident in NASH patients.34,35
In addition, VEGFs play an important role in the develop-ment of liver fibrosis and hepatocarcinogenesis in NASH,
coordinating with leptin-mediated neovascularization.36
In this study, the expression levels of VEGFA were
sig-nificantly up-regulated in healthy obese, steatosis, and NASH samples, in comparison with normal controls. This result was consistent with the study (at serum level)
of Coulon, et al.37 Hence, PRKCA, EGFR, CDC42, and
VEGFA might participate in the development of NAFLD through focal adhesion.
In the progression of NAFLD, phagocytic dysfunction
is aggravated.38 In this study, DEGs PRKCA, CDC42,
PRKCE and PRKCD were enriched in FcγR-mediated
phagocytosis. It should be noted that PRKCA, PRKCE
(protein kinase C ε), and PRKCD (protein kinase C δ)
be-long to the same protein family, and thus share similar
bio-functions in liver.39 As discussed above, PRKCA,CDC42,
PRKCE, and PRKCD might participate in the development
of NAFLD through FcγR-mediated phagocytosis.
In our study, it’s also discovered that CDC42 and
VEG-FA were regulated by hsa-miR-330-3p, and VEGFA was
regulated by hsa-miR-126, in the pathway of focal adhe-sion. Reportedly, the expression of hsa-miR-330-3p is
al-tered in NAFLD,40 and miR-126 is down-regulated in
type 2 diabetes,41 which is commonly associated with
NASH.42 Also, miR-126 can target insulin receptor
sub-strate-1 (IRS-1),43 which is correlated with the severity of
liver damage in patients with NAFLD.44 Thereby,
hsa-miR-330-3p and hsa-miR-126 might play pivotal roles in the development of NAFLD via regulating focal adhesion
through VEGFA or CDC42.
In summary, a number of DEGs (including PRKCA,
EGFR, CDC42, VEGFA, etc.), disturbed pathways
(in-cluding ribosome, ubiquitin mediated proteolysis, Fcγ
R-mediated phagocytosis, focal adhesion, etc.) and several miRNAs (including hsa-miR-330-3p, hsa-miR-126, etc.) were revealed in the development of NAFLD. The results of this study might be conducive to the further under-standing of NAFLD mechanism, and provide a theoretical basis for further experimental researches and clinical prac-tices. For example, the key genes and miRNAs identified in this study might serve as therapeutic targets for the treatment of NAFLD after generating pre-clinical evi-dences.
DISCLOSURES OF CONFLICT OF INTEREST
The authors declare that they have no conflict of inter-ests.
AUTHORS’ CONTRIBUTIONS
RFW proposed the study. RFW and XW performed re-search and wrote the first draft. SR collected and analyzed the data. All authors contributed to the design and inter-pretation of the study and to further drafts. LWZ is the guarantor.
ACKNOWLEDGEMENTS
This work was financially supported by the Natural Science Foundation of Heilongjiang Province of China (No. D201139).
REFERENCES
1. Bedogni G, Miglioli L, Masutti F, Tiribelli C, Marchesini G, Bel-lentani S. Prevalence of and risk factors for nonalcoholic fat-ty liver disease: the Dionysos nutrition and liver study. Hepatology 2005; 42: 44-52.
2. Browning JD, Szczepaniak LS, Dobbins R, Nuremberg P, Horton JD, Cohen JC, Grundy SM, et al. Prevalence of he-patic steatosis in an urban population in the United States: impact of ethnicity. Hepatology 2004; 40: 1387-95.
3. Clark JM, Diehl AM. Hepatic steatosis and type 2 diabetes mellitus. Curr Diab Rep 2002; 2: 210-5.
4. Vernon G, Baranova A, Younossi ZM. Systematic review: the epidemiology and natural history of non-alcoholic fatty liver disease and non-alcoholic steatohepatitis in adults. Ali-ment Pharmacol Ther 2011; 34: 274-85.
5. Adams LA LK. Non-alcoholic fatty liver disease. Ann Epide-miol 2007; 17: 6.
6. Chalasani N, Younossi Z, Lavine JE, Diehl AM, Brunt EM, Cusi K, Charlton M, et al. The diagnosis and management of non-alcoholic fatty liver disease: practice Guideline by the American Association for the Study of Liver Diseases, American College of Gastroenterology, and the American Gastroenterological Association. Hepatology 2012; 55: 2005-23.
8. Yoneda M, Mawatari H, Fujita K, Iida H, Yonemitsu K, Kato S, Takahashi H, et al. High-sensitivity C-reactive protein is an independent clinical feature of nonalcoholic steatohepatitis (NASH) and also of the severity of fibrosis in NASH. J Gas-troenterol 2007; 42: 573-82.
9. Tarantino G, Conca P, Pasanisi F, Ariello M, Mastrolia M, Are-na A, Tarantino M, et al. Could inflammatory markers help di-agnose nonalcoholic steatohepatitis? Eur J Gastroenterol Hepatol 2009; 21: 504-11.
10. Pirazzi C, Adiels M, Burza MA, Mancina RM, Levin M, Stahl-man M, Taskinen MR, et al. Patatin-like phospholipase do-main-containing 3 (PNPLA3) I148M (rs738409) affects hepatic VLDL secretion in humans and in vitro. J Hepatol 2012; 57: 1276-82.
11. Zheng L, Lv Gc, Sheng J, Yang Yd. Effect of miRNA-10b in regulating cellular steatosis level by targeting PPARα expres-sion, a novel mechanism for the pathogenesis of NAFLD. J Gastroenterol Hepatol 2010; 25: 156-63.
12. Castro RE, Ferreira D, Afonso MB, Borralho PM, Machado MV, Cortez-Pinto H, Rodrigues CM. miR-34a/SIRT1/p53 is suppressed by ursodeoxycholic acid in the rat liver and acti-vated by disease severity in human non-alcoholic fatty liver disease. J Hepatol 2013; 58: 119-25.
13. Smalling RL, Delker DA, Zhang Y, Nieto N, McGuiness MS, Liu S, Friedman SL, et al. Genome-wide transcriptome analy-sis identifies novel gene signatures implicated in human chronic liver disease. Am J Physiol Gastrointest Liver Phys-iol 2013 ;305: G364-G374.
14. Yoneda M, Endo H, Mawatari H, Nozaki Y, Fujita K, Akiyama T, Higurashi T, et al. Gene expression profiling of non-alco-holic steatohepatitis using gene set enrichment analysis. Hepatol Res 2008; 38: 1204-12.
15. Moylan CA, Pang H, Dellinger A, Suzuki A, Garrett ME, Guy CD, Murphy SK, et al. Hepatic gene expression profiles dif-ferentiate presymptomatic patients with mild versus severe nonalcoholic fatty liver disease. Hepatology 2014; 59: 471-82.
16. Ahrens M, Ammerpohl O, von Schonfels W, Kolarova J, Bens S, Itzel T, Teufel A, et al. DNA methylation analysis in nonalcoholic fatty liver disease suggests distinct disease-specific and remodeling signatures after bariatric surgery. Cell Metab 2013; 18: 296-302.
17. Smyth GK. Linear models and empirical bayes methods for assessing differential expression in microarray experi-ments. Stat Appl Genet Mol Biol 2004; 3.
18. Jiao X, Sherman BT, Huang da W, Stephens R, Baseler MW, Lane HC, Lempicki RA. DAVID-WS: a stateful web service to facilitate gene/protein list analysis. Bioinformatics 2012; 28: 1805-6.
19. Nam H, Lee J, Lee D. Computational identification of altered metabolism using gene expression and metabolic pathways. Biotechnol Bioeng 2009; 103: 835-43.
20. Goel R, Muthusamy B, Pandey A, Prasad TS. Human protein reference database and human proteinpedia as discovery resources for molecular biotechnology. Mol Biotechnol 2011; 48: 87-95.
21. Sanner MF. Python: a programming language for software integration and development. J Mol Graph Model 1999; 17: 57-61.
22. Shannon P, Markiel A, Ozier O, Baliga NS, Wang JT, Ramage D, Amin N, et al. Cytoscape: a software environment for integrated models of biomolecular interaction networks. Genome Res 2003; 13: 2498-504.
23. Xiao F, Zuo Z, Cai G, Kang S, Gao X, Li T. miRecords: an in-tegrated resource for microRNA-target interactions. Nucleic Acids Res 2009; 37: D105-10.
24. Hsu SD, Lin FM, Wu WY, Liang C, Huang WC, Chan WL, Tsai WT, et al. miRTarBase: a database curates experimentally validated microRNA-target interactions. Nucleic Acids Res 2011; 39: D163-9.
25. Vergoulis T, Vlachos IS, Alexiou P, Georgakilas G, Marag-kakis M, Reczko M, Gerangelos S, et al. TarBase 6.0: captur-ing the exponential growth of miRNA targets with experimental support. Nucleic Acids Res 2012; 40: D222-9. 26. Bishara AJ, Hittner JB. Testing the significance of a
correla-tion with non-normal data: comparison of Pearson, Spear-man, transformation, and resampling approaches. Psychol Methods 2012; 17: 399-417.
27. Joshi-Barve S, Barve SS, Butt W, Klein J, McClain CJ. Inhibition of proteasome function leads to NF-kB-independent IL-8 ex-pression in human hepatocytes. Hepatology 2003; 38: 1178-87. 28. Naora H. Involvement of ribosomal proteins in regulating cell growth and apoptosis: translational modulation or recruit-ment for extraribosomal activity? Immunol Cell Biol 1999; 77: 197-205.
29. Feldstein AE, Canbay A, Angulo P, Taniai M, Burgart LJ, Lin-dor KD, Gores GJ. Hepatocyte apoptosis and fas expression are prominent features of human nonalcoholic steatohepati-tis. Gastroenterology 2003; 125: 437-43.
30. McCuskey RS, Ito Y, Robertson GR, McCuskey MK, Perry M, Farrell GC. Hepatic microvascular dysfunction during evolu-tion of dietary steatohepatitis in mice. Hepatology 2004; 40: 386-93.
31. Yang C, Zeisberg M, Mosterman B, Sudhakar A, Yerramalla U, Holthaus K, Xu L, et al. Liver fibrosis: insights into migra-tion of hepatic stellate cells in response to extracellular ma-trix and growth factors. Gastroenterology 2003; 124: 147-59.
32. Lee UE, Friedman SL. Mechanisms of hepatic fibrogenesis. Best Pract Res Clin Gastroenterol 2011; 25: 195-206. 33. Sharma M, Urano F, Jaeschke A. Cdc42 and Rac1 are major
contributors to the saturated fatty acid-stimulated JNK path-way in hepatocytes. J Hepatol 2012; 56: 192-8.
34. Czaja MJ. JNK regulation of hepatic manifestations of the metabolic syndrome. Trends Endocrinol Metab 2010; 21: 707-13.
35. Ferreira D, Castro R, Machado M, Evangelista T, Silvestre A, Costa A, Coutinho J, et al. Apoptosis and insulin resistance in liver and peripheral tissues of morbidly obese patients is associated with different stages of non-alcoholic fatty liver disease. Diabetologia 2011; 54: 1788-98.
36. Kitade M, Yoshiji H, Kojima H, Ikenaka Y, Noguchi R, Kaji K, Yoshii J, et al. Leptin-mediated neovascularization is a pre-requisite for progression of nonalcoholic steatohepatitis in rats. Hepatology 2006; 44: 983-91.
37. Coulon S, Francque S, Colle I, Verrijken A, Blomme B, Hein-dryckx F, De Munter S, et al. Evaluation of inflammatory and angiogenic factors in patients with non-alcoholic fatty liver disease. Cytokine 2012; 59: 442-9.
38. Cheong H, Lee SS, Lee JS, Kim J, Kim SW, Lee WJ. Phago-cytic function of Kupffer cells in mouse nonalcoholic fatty liv-er disease models: Evaluation with supliv-erparamagnetic iron oxide. J Magn Reson Imaging 2014.
39. Bezy O, Tran TT, Pihlajamaki J, Suzuki R, Emanuelli B, Win-nay J, Mori MA, et al. PKCdelta regulates hepatic insulin sen-sitivity and hepatosteatosis in mice and humans. J Clin Invest 2011; 121: 2504-17.
41. Zampetaki A, Kiechl S, Drozdov I, Willeit P, Mayr U, Prokopi M, Mayr A, et al. Plasma microRNA profiling reveals loss of endothelial miR-126 and other microRNAs in type 2 diabetes. Circ Res 2010; 107: 810-7.
42. Gupte P, Amarapurkar D, Agal S, Baijal R, Kulshrestha P, Pramanik S, Patel N, et al. Non-alcoholic steatohepatitis in type 2 diabetes mellitus. J Gastroenterol Hepatol 2004; 19: 854-8.
43. Zhang J, Du YY, Lin YF, Chen YT, Yang L, Wang HJ, Ma D. The cell growth suppressor, mir-126, targets IRS-1. Bio-chem Biophys Res Commun 2008; 377: 136-40.
44. Dongiovanni P, Valenti L, Rametta R, Daly A, Nobili V, Mozzi E, Leathart J, et al. Genetic variants regulating insulin
recep-tor signalling are associated with the severity of liver dam-age in patients with non-alcoholic fatty liver disease. Gut 2010; 59: 267-73.
Correspondence and reprint request: Liwei Zhuang, M.D.
Gastroenterology and Hepatology Department, the Forth Affiliated Hospital of Harbin Medical University, Harbin,
Heilongjiang province, China, 150001. Tel.: +86-0451-82576955. Fax: +86-0451-82576955