1
A support vector machine as an estimator of
mountain papaya ripeness using resonant
frequency or frequency centroid
P.B. Bro1, C. Rosenberger2, H. Laurent2, C. Gaete-Eastman3, M. Fern´andez1, and M.A. Moya-Le´on3
1
Department of Engineering Science Universidad de Talca
Curic´o, Chile
pbro@utalca.cl
2
Laboratoire de Vision et Robotique - UPRES EA 2078 ENSI de Bourges - Universit´e d’Orl´eans
10 Boulevard Lahitolle, 18020 Bourges cedex, France
christophe.rosenberger@ensi-bourges.fr
3
Institute of Plant Biology and Biotechnology Universidad de Talca
Talca, Chile
Summary. Mountain papaya fruits (Vasconcella pubescens) were tested for
firm-ness with a nondestructive acoustic method for 14 days after harvest. The response of each fruit was analyzed with the Fourier transform to obtain a firmness index (FI) based on the second resonant frequency and with the Short Time Fourier Transform (STFT) to obtain a spectrogram frequency centroid (FC) index. The indexes were processed with a support vector machine (SVM) learning procedure in which days since harvest was taken as the basic truth of ripeness which the measured indexes attempt to estimate. The analysis of the results demonstrate that different group-ings of the days into classes to be estimated give widely varying recognition rates and that the best rates are obtained when the classes are delimited using prior knowledge.
1.1 Introduction
the future evolution of the fruit from the knowledge of an easily measured, non-destructive quality parameter.
The firmness measurement methods used in this research are based on acoustic measurements of vibrational response of the fruit to impulsive me-chanical excitation. This is quite similar to the fine art of testing watermelons by thwacking them with the palm of the hand, or evaluating the quality of a used car by kicking the tires. Despite almost three decades of academic research and development, the determination of the firmness index through acoustic testing has not been widely accepted in industry. Many factors must contribute to this lag; one may be that the acoustic test is overly sensitive to variations in fruit form. One purpose of the overall research of which this report forms a part, is to investigate methods of reducing the variability of the estimation procedure using machine learning.
1.1.1 Fruit firmness
The current industry standard method for measuring the firmness of fruit is a pressure tester based on work by Magness and Taylor [12] originally developed for apples. The basic procedure is to push a cylindrical probe (typically 11mm diameter) into the pared flesh of fruit (to typical depth of 7.9mm). Tests have shown average firmness values obtained with different brands of tests that are statistically significantly different from each other, and show significant dependence of the pressure on the operator [11]. Despite its variability, the pressure test is still the technique of choice for industrial operators.
As an alternative procedure to replace the pressure test, a firmness index has been developed ([8, 1, 5]). The firmness index method is based on exciting vibration in the fruit and determining its resonant frequencies. The firmness index is defined as:
F I = (fn=2)2m(2/3) (1.1)
where
m−mass
fn=2−second resonant f requency
Cooke and Rand [6] suggest that the first resonant frequency corresponds to a spheroid mode and that the second resonant frequency corresponds to a torsional mode and developed equation (1.1) based on torsional spherical models. Terasaki et al. [16] observed the vibration modes of apples using speckle pattern interferometry and concluded that the second resonant fre-quency mode in fact of an oblate-prolate mode of spherical vibration. This result invalidates the theoretical foundation for equation (1.1) however the authors conclude that the firmness index is of practical value as stated and does not merit alteration.
assume that the standard FT is not fundamentally appropriate for analyzing the acoustic response of fruit to impulsive excitation. The short time Fourier transform (STFT) can be used [13] to determine the time varying properties of a signal. With the STFT the data is screened by a sliding window such that only a short duration of the signal is transformed before moving the window to the next portion of the signal. More formally, the FT of each portion of the signal is convolved with the FT of the window. As a result a spectrogram is obtained, a set of spectra as a function of time, also equivalent to the magnitude of the STFT.
As background to this current report, [2] analyzed mountain papaya with the acoustic method and found that the centroid of a portion of the time-frequency spectrogram gives a more robust index of fruit ripeness than does the second resonant frequency. A hypothesis of this research is that the time-frequency analysis shows the response of the fruit in a fashion which is more productive than the static resonant analysis.
1.1.2 Machine learning
The framework for machine learning in the current context is to start with a set of pairs of parameters describing fruit ripeness: {xi, yi}i=1,·ℓ where xi
describes the fruit ripeness andyi is a quality index of the fruit In our case
yi is the number days since harvest, the basic truth which is known, and xi
is the resonant or centroid frequency, which is measured. Our objective is to learn, on the basis of a training set {xi, yi}, a functionf that will be able to
estimate accurately the index quality on the basis of the measured parameter. The procedure is to divide a data set of parameter pairs into a learning set and a validation set. One would assume that if the learning set approaches 100% of the total data base, then the validation will also be relatively high.
We use a supervised learning framework to define the estimation func-tional. This is a multi-class learning problem in which the number of classes depends on the cardinality of index quality. For instance, the fruit firmness can be discretized on a period of 10 days yielding thus into a 10-class prob-lem in a ddimension space. The multi-class problem is addressed through a polychotomy based on aone-against-oneapproach [9]. In the present case, the classes into which the fruit are to be classified are groups of days since harvest. Note that during the first few days after harvest, the change in frequencies is significant, but after about a week, the fruit is already quite mature, and the frequencies do not change thereafter. Therefore, the class grouping might not necessarily be uniformly distributed across the days.
Our machine learning algorithm for each binary problem is a 2-norm sup-port vector machine (SVM) [7], which has already demonstrated its efficiency in other applications [10, 3, 14, 17].
f(x) =
ℓ
X
i=1
α⋆iyiK(xi, x) +b (1.2)
that maximizes the separation, or margin, between the hyperplane and the data points xi projected onto H. Here α⋆i are the solutions to the following
optimization problem:
½ maxαi
P
iαi−12Pi,jαiαjyiyj(K(xi, xj) +C1δi,j)
withP
iαiyi = 0 0≤αi (1.3)
whereK is the kernel associated withH,δi,j is the Kronecker delta function
andC is a trade-off parameter between the margin width and the number of training examples located outside the margin.
1.2 Materials and methods
1.2.1 Plant Material
Mature mountain papaya (Vasconcellea pubescens) fruits were collected dur-ing summer season of 2004 from commercial orchards located at Lipimavida (34◦51’S; 72◦08’W; 5 m ASL), on the coastal area of VII Region, Chile. Fruits
that were below 5% of yellow color and free from any injuries were harvested using a random sampling method. Then fruits were randomly separated in two groups: one group was treated with 1-MCP (0.3 µl.l−1) during 16 hours
at 20◦C in the same day of harvest (1-MCP group), while the other group
was left untreated (control group). The fruit was allowed to ripen in a room at 20◦C. In this paper we deal only with the control group, not the 1-MCP
treated fruit.
Four fruits were randomly chosen from each group, and pressure (destruc-tive method) and ethylene production were followed during ripening at 20◦C
every two days (February 2004 set). The experiment was repeated on March 2004, in which pressure was followed on each fruit in a daily base by using the non-destructive acoustic method. In order to obtain a more complete data set, the results of both trials were combined by normalizing the measurement date to be number of days since harvest.
1.2.2 Pressure and firmness measurements
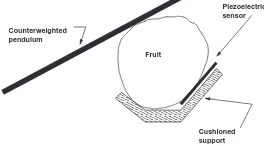
diameter wooden dowel, 300mm long, was given a 50g lead counter weight and balanced so as to rebound after contacting the fruit and not return to touch the fruit a second time. The experimental setup is illustrated in Figure 1.1.
Counterweighted pendulum
✁✁✁✁✁✁✁✁✁✁✁ ✁✁✁✁✁✁✁✁✁✁✁ ✁✁✁✁✁✁✁✁✁✁✁ ✁✁✁✁✁✁✁✁✁✁✁ ✁✁✁✁✁✁✁✁✁✁✁ ✁✁✁✁✁✁✁✁✁✁✁ ✁✁✁✁✁✁✁✁✁✁✁ ✁✁✁✁✁✁✁✁✁✁✁ ✁✁✁✁✁✁✁✁✁✁✁ ✁✁✁✁✁✁✁✁✁✁✁ ✁✁✁✁✁✁✁✁✁✁✁ ✁✁✁✁✁✁✁✁✁✁✁
✂✁✂✁✂✁✂✁✂✁✂✁✂✁✂✁✂✁✂✁✂✁✂ ✂✁✂✁✂✁✂✁✂✁✂✁✂✁✂✁✂✁✂✁✂✁✂ ✂✁✂✁✂✁✂✁✂✁✂✁✂✁✂✁✂✁✂✁✂✁✂ ✂✁✂✁✂✁✂✁✂✁✂✁✂✁✂✁✂✁✂✁✂✁✂ ✂✁✂✁✂✁✂✁✂✁✂✁✂✁✂✁✂✁✂✁✂✁✂ ✂✁✂✁✂✁✂✁✂✁✂✁✂✁✂✁✂✁✂✁✂✁✂ ✂✁✂✁✂✁✂✁✂✁✂✁✂✁✂✁✂✁✂✁✂✁✂ ✂✁✂✁✂✁✂✁✂✁✂✁✂✁✂✁✂✁✂✁✂✁✂ ✂✁✂✁✂✁✂✁✂✁✂✁✂✁✂✁✂✁✂✁✂✁✂ ✂✁✂✁✂✁✂✁✂✁✂✁✂✁✂✁✂✁✂✁✂✁✂ ✂✁✂✁✂✁✂✁✂✁✂✁✂✁✂✁✂✁✂✁✂✁✂ ✂✁✂✁✂✁✂✁✂✁✂✁✂✁✂✁✂✁✂✁✂✁✂
Piezoelectric sensor
Fruit
[image:5.595.236.368.165.238.2]Cushioned support
Fig. 1.1.Experimental equipment for firmness measurement.
The signal was captured to a PC running Fedora Linux, through the audio card (Creative Sound Blaster, Audigy Plus) at a 44100Hz sampling rate for 4096 samples. The signal capture software was written in C language using the Open Sound System (http://www.opensound.com) application program interface. The signal was captured to a file for off-line analysis, programmed using Octave (http://www.octave.org), an open source language and library
of routines for numerical analysis and MatLab°r.
First the FT was taken of each signal to determine the second resonant peak. A search procedure was programmed to pick out the frequency of the highest peak after 100Hz. This threshold was chosen so as to skip the first resonant peak which in many cases is of higher amplitude than the second resonance. The second analysis of the response signal was to perform the STFT. Since the highest frequencies were less than 2KHz, the signal was decimated by a factor of 8. A Hamming window of 71 sample width was used to obtain the spectrograms.
The SVM was applied using the libSVM library published by [4] and
avail-able on-line. The initial steps were to process the data using MatLab°r to
1.3 Results
The results of the initial tests are represented by the graph in Figure 1.2. The daily spectra obtained from one fruit (Control fruit 1, February tests) are plotted with the value of the ordinate offset to distinguish between each day. The first day is at the top of the graph and later days follow sequentially below. A first resonance at about 40Hz is common for all the days, and higher resonances between 150 and 350Hz change their position and form with the day. Note that the resonance at about 150Hz can be regarded as increasing in importance relative to the resonance which begins at 300Hz and ends near 250Hz.
02/23 02/21 02/18 02/16 02/14 02/12 02/10
100 200 300 400 500 600 700 800 900
Day of testing
Spectral amplitude
[image:6.595.206.402.249.387.2]Frequency Daily evolution of spectrum
Fig. 1.2.Evolution of spectrum, fruit 1.
The FI described in the previous section is based on the second resonant frequency. In Figure 1.2 the daily evolution of the this frequency is illustrated for one fruit. In order to calculate the FI, one must decide which resonant peak is to be taken as the second resonance. We have used an automated procedure which simply takes the highest peak above 100Hz as the second resonance. With this value one can visualize the daily evolution of the second resonance of the various fruit being tested.
The results of the time-frequency analysis are illustrated in Figure 1.3 where spectrograms are given for the same fruit as illustrated in Figure 1.4. The centroid used in this paper refers to the average frequency of a small por-tion of the spectrogram at the initial part of the signal. Figure 1.4 illustrates the evolution over time of the resonant and centroid frequencies, the two basic measurements which this paper seeks to compare.
The recognition rate for the SVM is illustrated in Figure 1.5, which in-cludes rates for both centroid frequency and resonant frequency as the inde-pendant parameter, xi, from which the quality index, yi is estimated. The
Fig. 1.3.Spectrograms control fruit 01, February data.
2 4 6 8 10 12 14 16 18
Day
2 4 6 8 10 12 14 16 18
Day
(a)
(b)
Fig. 1.4.Resonant (a) and centroid (b) frequencies, control fruit.
the recognition rate; the results presented here are for 17 sets of 5 elements each.
Several groupings for days since harvest are used:
1. Each individual day forms one class
2. Each day up to day 6 form individual classes and all days thereafter form an additional class
3. Each day up to day 6 form individual classes and all days thereafter are discarded
4. Days are grouped 1+2, 3+4, 5+6,>6
[image:7.595.220.414.316.440.2]0 20 40 60 80 100
20 30 40 50 60 70 80
Recognition rate
Proportion of data base for learning Recognition rate, resonant
G1 G2 G3 G4 G5
0 20 40 60 80 100
20 30 40 50 60 70 80
Recognition rate
Proportion of data base for learning Recognition rate, centroids
[image:8.595.138.454.73.204.2]G1 G2 G3 G4 G5
Fig. 1.5. Recognition rate for resonant (a) and centroid (b) frequencies, control
fruit .
These groupings were chosen from inspection of the curves relating cen-troid frequency or resonant frequency to day after harvest. In both cases, after about 6 days, the frequencies no longer vary with day. This is because the fruits have reached a state of ripeness where they no longer become softer with each passing day. In fact the fruits begin to mold and the outer peel be-gins to form a new slightly stiffer material where the fungal growth contributes to the structural stability of the fruit.
In the concluding section of this paper we analyze the evolution of the recognition rate of the two indexes. These results are somewhat surprising and lead to careful thinking about the use of the SVM and the value of the firmness indexes.
1.4 Discussion and conclusions
The original objective of this research was to compare the FI with the FC methods of ripeness estimation, using the SVM to obtain a quantitative mea-sure of the accurate of each meamea-surement method. The hypothesis was that the centroid method would give a more robust and dependable prediction than the resonance method, due to the clearer functional dependance of centroid frequency on day, with respect to the dependance of resonant frequency on day, as per the conclusion reported by [2] and reflected in Figure 1.4.
This quantitative measure has been achieved in the results of this research, as the recognition rate obtained by the SVM, however it is most decidely not the expected result, but higher for the resonant than for the centroid fre-quency. This was not expected since the dependance of centroid frequency on day after harvest is clearer than for the resonant frequency. However the mature fruit resonance peaks are more centralized than are the centroid fre-quencies of these same fruit.
An initial conclusion to be drawn from the results is that the grouping of
in a much lower recognition rate than by more general groupings. Using the knowledge that the fruit after day 6 is overripe and grouping all this fruit into one class, or by directly discarding these parameter pairs, results in signifi-cantly higher recognition rates.
A second result that was unexpected is that the recognition does not in-crease notably as the size of the learning data base inin-creases. In particular for the centroid based recognition, the groupings of all the days greater than 6 into one class (G2 and G4) drop rather sadly when 80% of the data base is used for learning and only 20% is used for validation. This can be termed counterintuitive, since one would expecta priori that use of a higher percent-age of the data base for learning would ensure a high validation rate. The resonance estimations are not significantly affected by the size of the learning data base, not improving much, but at least not getting worse. We do not have a convincing explanation for this result.
The resonant frequencies of the overripe fruit also show less variability than the centroids of the same fruit at that stage. This homogeneity may be an artifact of the technique for calculating the resonant frequency, and indeed may be the reason that the SVM predicts the day after harvest more successfully with resonant frequency than with the centroid frequency.
This research is part of an overall effort to assist the fruit processing in-dustry produce uniform, high quality food. Future directions must include extensive, large scale testing to determine if one or another of these non-destructive indexes is most suited for classifying fruit into commercially rele-vant categories. One such activity will be to test a large number of fruit, as opposed to the very limited sample used in this research. As was mentioned in the materials and methods section, the initial data set in each of the trial runs consists of only four fruits, due to the equipment available for capturing ethylene gas. This represents a clear limitation of the present study; future research will concentrate on the physical, acoustic tests, and so a larger test sample may be used.
References
1. J.A. Abbott, N.F. Childers, G.S. Bachman, J.V. Fitzgerald, and F.J. Matusk. Acoustic vibration for detecting textural quality of apples.Am. Soc. for Hortic. Sci., 93:725–737, 1968.
2. P.B. Bro, C. Rosenberger, H. Laurent, C. Gaete-Eastman, M.A. Moya-Le´on, and M. Fern´andez. Application of a support vector machine to spectrograms for determinatino of papaya ripeness. InProc. Workshop on Artificial Intelli-gence, Valdivia, Chile, November 2005. Sociedad Chilena de las Ciencias de la Computaci´on.
3. Doina Caragea, Dianne Cook, and Vasant Honavar. Towards simple, easy-to-understand, yet accurate classifiers. IEEE Conf. on Data Mining, page 497, 2003.
4. Chih-Chung Chang and Chih-Jen Lin. LIBSVM: a library for support vector machines, 2001. Software available athttp://www.csie.ntu.edu.tw/~cjlin/
libsvm.
5. J.R. Cooke. An interpretation of the resonant behavior of intact fruit and vegetables. Transactions ASAE, 15(6):1075–1080, 1972.
6. J.R. Cooke and R.H. Rand. A mathematical study of resonance in intact fruits and vegetables using a three media elastic sphere model. J. of Agric. Eng. Research, 18:141–157, 1973.
7. Cristianini and J. Shawe-Taylor.Introduction to Support Vector Machines. Cam-bridge University Press, 2000.
8. E.E. Finney. Dynamic elastic properties of some fruits during growth and de-velopment. J. of Agric. Eng. Research, 12(4):249–256, 1967.
9. C.-W. Hsu and C.-J. Lin. A comparison of methods for multi-class support vector machines. IEEE Transactions on Neural Networks, 13:415–425, 2002.
10. Anil K. Jain, Robert P.W. Duin, and Jianchang Mao. Statistical pattern recog-nition: A review. IEEE Transactions on Pattern Analysis and Machine Intelli-gence, 22(1), January 2000.
11. Eugene Kupferman and Nairanjana Dasgupta. Comparison of pome fruit firm-ness testing instruments. Postharvest Information Network, 2001.
12. J.R. Magness and G.R. Taylor. An improved type of pressure tester for the determination of fruit maturity. USDA Circular, 350, 1925.
13. Alan V. Oppenheim and Ronald W. Schafer. Discrete-time signal processing. Prentice-Hall, 2 edition, 1998.
14. C. Rosenberger, A. Rakotomamonjy, and B. Emile. Generic target recognition. InEUROSIP Journal on Applied Signal Processing, pages 1613–1616, 2004.
15. I. Shmulevich, N. Galili, and D. Rosenfeld. Detection of fruit firmness by fre-quency analysis. Transactions ASAE, 39(3):1047–1055, 1996.
16. S. Terasaki, N. Sakurai, N. Wada, T. Yamamishi, R. Yamamoto, and Nevins D.J. Analysis of the vibration mode of apple tissue using electronic speckle pattern interferometry. Transactions ASAE, 44(6):1697–1705, 2001.