QUCO2: Development of a tool for measuring the quality
of Web applications
Nicolás Tortosa1, Noelia Pinto1, César Acuña1, Liliana Cuenca Pletsch1, Marcelo Estayno2
1
Software Quality Research Group, (GICS). Department of Information Systems Engineering. Resistencia Regional Faculty. National Technological University.
2
Department of Informatics. Faculty of Engineering. Lomas de Zamora National University.
Abstract. In recent years, various methods to automate the quality control in software products have been developed. Nevertheless, there are few applications orientated web application assessment. Thus, this article describes the main features of a tool designed to assess quality evaluation of web software, called QUCO2, and implemented based on research work that was performed for the development a framework of web quality assessment.
Keywords: Quality, Web Quality Assessment, Quality Model.
1
Introduction
Quality assessment in products or services of any kind has been an everyday and increasingly important thing, since it became a differentiating factor when you choose to acquire a service or a good. The concept of quality has different definitions, but the widely accepted one is established by ISO 9000 [1], a norm which defines quality as “the degree in which a set of inherent characteristics fulfills requirements”.
Software, as a product, should also be part of a quality assessment process, and thus, to determine the degree of satisfaction to the requirements and needs of the user. Web applications are a special type of software. They have characteristics that differentiate them from traditional systems such as: the size and complexity of the applications, the multidisciplinary nature of the development team, the hasty rate of the project delivery, among others. The above mentioned features bring with them the concept that the existing processes, models and metrics to evaluate the quality have to be adapted to consider the changes imposed by new technologies [2].
This paper presents the technical characteristics of a technological tool, QUCO2, in which the implementation aim is to automate the quality assessment of web applications from the point of view of the user. Its development is part of interinstitutional research project, “Models and Metrics for the Evaluation of Software Quality”, that teacher researchers from the Faculties of UTN Regional Resistencia and Exact and Natural Sciences, and Surveying from UNNE carry it forward under the guidance of a researcher at the National University of Lomas de Zamora .
also comprises a quality model particularly oriented to web applications. Section 3 describes the technical design of the project, i.e., QUCO2 tool architecture and the functions they perform. Section 4 shows some of the results obtained with QUCO2 and a comparison of this with other existing tool. This comparison is summarized in a comparative table showing the differences between them and the advantages and disadvantages of each.
Finally, the last Section includes conclusions and future works that could be done to extend the functionality of the tool in development.
2 WQF: Framework for Quality Assessment in Web Applications
As it is mentioned in the previous section, QUCO2 is one component of WQF, a framework that allows us to evaluate the quality from the point of view of the product, particularly oriented towards web applications.
The framework is the result of research work of various models of quality, standards and norms such as ISO 14598 and ISO 9126. At the moment, these models are part of ISO 25000 standard that defines the way you should assess the quality of software products and the quality model to be followed [3][4][5][6][7]. Aspects to be evaluated from the quality software are grouped in Features, which in turn are shaped by metrics that are methods and scales for measurements and also, they are the result of mathematical relationships between parameters and specific attributes of the measurements. Thus, and as a result of research work, it has been developed a model of quality oriented to web applications [8]. However, as it is necessary to integrate the quality model and the results of the evaluation, it has also been designed a framework for this purpose.
This framework is called WQF, which to manage quality elements, includes a quality model (WQM) and a software tool (QUCO2), and it is developed based on this model.
2.1WQM: Quality Model for Web Software
In the first instance, and according to the scope of this research, the proposed quality model is made taking into account the following metrics [9]:
• Metric 1 - Usability: It is regarded as the degree of effectiveness, efficiency and satisfaction by which specified users can achieve specific objectives, in contexts of specific usage to use a product. The criteria to be evaluated are:
a) Learning Facility: refers to the need to minimize the time required with respect to the learning curve Software.
b) Consistency: a system is consistent if all the mechanisms remain the same circuit regardless of time.
d) Retention time: measures the ease, from the point of view of the user, to remember the operation of the system even though considerable time has elapsed since the last time it was used.
e) Flexibility: assesses the potential for Exchange of information between the user and the system.
• Metric 2: Reliability: This metric is related to the ability of software to maintain its level of performance under stated conditions for a period of time. The criteria to be evaluate are:
a) Frequency and severity of failures: it measures how often failures occur in the system, if it occurs, and the ability of software to maintain the specified level of performance.
b) Accuracy of the outputs: measure that indicates the approximation of the output obtained from the output achieved by the software. c) Failover capability: This measure includes processes required to
detect and recover from abnormal situations. It should provide a minimum expiration time, after which you must apply new response. d) Reliability: measures the occurrence of unauthorized access to private
information.
• Metric 3 - Functionality: This metric allows us to check the relationship between the functions of applications, the expected results and the real results. The quality criteria to be evaluated are:
a) Adequacy: attributes that determine whether the set of functions are appropriate for the specified tasks.
b) Safety: attributes that measure the ability to prevent unauthorized access, whether accidental or deliberate, both programs as data. c) Compliance: attributes that make software adheres to standards
related to the application, and conventions or legal regulations. d) Reliability: No enabling of unauthorized access to private
information.
Each metric proposed associates a weight with each feature (e.g. No Apply, Apply, Apply Heavily), evaluated on a scale of measurement (e.g. Wrong, Regular, Good, Very Good). The derived of the general formula to calculate the overall quality level we get the Framework is:
NO = ∑ (VC. PC) / ∑ (PC) (1)
where NO is level obtained, VC is the calculated value for the metric i and PC is the weight of the i feature. Summations are perfomed based on all the components selected for the evaluations. Basically it is an average between the values obtained for each component influenced by the weight of that component in the overall study [9].
3
QUCO2: Description and Technical Features
In order to manage the elements of the quality model and analyze the results of the evaluations, it is necessary an application development that permits the automation of these tasks. So, we worked on getting QUCO2, an application that enables to do web software evaluations, by different users, and offers information about the resulting quality value.
This section briefly describes each of the components used in the development of the application, providing a detailed look at the features in which each of them play in the execution of the application.
3.1
Application Design
QUCO2 development was posed as a web plugin, to facilitate the use of tool to the user, because it fits any browser and navigating different sites without interruptions in the execution of the application. Hence the user may, simultaneously, to review comprehensively the Web application to assess and record the required information. Thus, QUCO2 appears as a small container for small reusable components that enables to evaluate a particular feature. For each possible evaluated feature, it is defined a scale associated therewith, with the possibility of defining in turn a relative weight according to the project. Having the characteristics defined, scale and relative weight, one component is created to record and collect data for quality analysis. This means that you will get generic information and consolidated on product quality evaluation. After the evaluation process, the tool will provide the user with a quality level value obtained for the product in question.
In addition, the software will supply different user roles: Developers, who are responsible for the registration of information relating to the development process and the design of self-assessment to monitor the evolution of product quality; Quality Assessors, who have the responsibility to verify that the information recorded by the developers is correct and the quality assessments from their perspective, and Customers, who will display the information generated by the system and make decisions based on it.
Fig. 1. Three-tiers architecture.
Applications developed under the three-tier architecture can be divided into the following levels:
1. Presentation Level: it is in charge of generating the user interface depending on
the actions carried out by itself.
2. Business Level: it contains all the logic modeling business processes and is
where all the processing necessary is done, to meet user requests.
3. Data Management Level: it is charged to make persistent all the information,
supplies and stores information for the level of business. The following is a presentation on how integrated and implemented are these layers in the front-end and back-end QUCO2,
3.2
Front-End
In client-server applications, the client is the process that allows the user to formulate the requirements and pass them to the server. It is also known by the name of front-end.
In the case of QUCO2, particularly, the functions performed in the front-end are: • Manage the User Interface: necessary adjustments are made to the
interface application, the components are redesigned and the functionality is modified as new requirements arise.
• Interact with the user: that is, the communication process of the Evaluator with QUCO2.
• Process the application logic and making local validations: Each time a user enters the system, your profile will be check to enable the functions which are applied.
• Generate requirements to the database: Both when the user log as when issuing the request to save the assessment, requirements will be generated to the database
• Receive and display results from the server: the screen will show the user a variety of information of relevance, for example the quality level obtained as a final result.
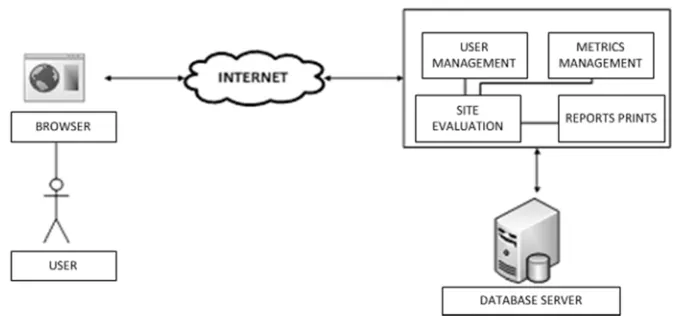
The design, in graphical form, the front-end of QUCO2, it is shown in Figure
[image:5.595.162.427.149.236.2]Fig. 2. Design Diagram of front-end..
To implement all required functions, before starting the development process, integral modules were designed where the functional elements of the applications will be distributed:
• User Management: It allow us to record information from different users that will interact with the software. Not only store data access account, but also the user profile according to the roles described in the previous section.
• Metrics Management: From here you create components using Quality Model. In this case WQM involves creating metrics and their relation with features that will have associated a relative weight. Then, this information is used to calculate the level of quality obtained in the evaluation of a product. • Reports Issuance: This component is still in development, and allows the
production of various statistical reports to expand knowledge about the current use of the tool. This functionality will be the most important for the Customers; then based on generated reports, decisions may be taken according to the observed results.
• Web Quality Assessment: From here, Assessors will may record the test they take, from their perspectives, from any web product. Also it will allow you to get the quality level obtained as a final result of the evaluation process.
The first two modules will only be accessed by the Developers, who are responsible for configuring the application for later use.
[image:6.595.144.481.144.307.2]most web browsers. Also since version 2.0, it supports sensitive designs, i.e., that the graphical interface of the resulting product is dynamically adjusted, taking into account the characteristics of the device used for the execution (PC, tablets, smart phones, etc.) Finally, the main reason for the choice of Twitter Bootstrap had to do with CSS enhancements offered by a number of utilities javascript that facilitate user interaction. This technology need to use, in turn, the project Less [12] which allows a continuous cycle of development and improvement of CSS using advanced features. As an extension of CSS, LESS includes variables, mixes reusable code snippets, simple mathematical operations, nesting and even color functions. The combination of Bootstrap and Less user interface provides a pleasing and supplies a "responsive web design" that allows you its use on devices with limited display characteristics (e.g. smartphones) without redesigning the interface.
Each time the user performs an evaluation of a particular website using the plugin, and generates action to save the results of the transaction, the request is received by the Web server, and the information generated is stored by the user on Server database, recording the quality final value obtained..
3.2
Back-End
The functions performed in the back-end or server process, is basically provided in the implementation of business logic and storage of required information.
To develop the back-end system, which is plotted in Figure 3, we used the Symfony web framework [13], based on PHP, using as Propel project mapper [14]. This combination lets the deployment of changes of the system, in a very quickly and efficiently way, supporting schema modifications of the database, and the implementation of new business rules or even complete redesigns interface in a very transparent way, i.e., without affecting the interaction with the user.
Fig. 3. Overall Design Diagram of the Back-End
[image:7.595.174.426.488.611.2]• MySql is Open Source software, licensed under the GPL.
• The technology provides speed and security for operations, it is essential in database applications on the web.
• Easy installation and configuration of the database on the web server. To create the configuration of the different options for each metric, the system uses the interchange format JSON data [15], which has much support across platforms and it is easy to understand and learning in case of need for new metrics.
In turn the whole project is published on a Github repository, enabling up projects using the version control system Git, under the MIT license [16] which enables sharing with the development community under the form Open Source.
4
Results Obtained. Comparison with other tools.
Currently a variety of tools aimed at evaluating the usability of software products. However, as a result of this investigation, it was verified that none of the technologies aimed at the evaluation of web applications are defined according to criteria of any existing quality model, nor returned to the user a final result of the quality level obtained. Among all the existing tools in the market, we have chosen two of them for comparison with QUCO2. The first is Alexa [17], which returns information about the visits to a domain, while the position calculated by global positioning ranking and regional level taking into account the popularity and visitor traffic. The other tool is developed by Silktide, called Nibbler [18], which has the distinction of providing disaggregated score in "accessibility", "technology", "user experience" and "marketing" of the web, and indicates how to improve in every aspect.
To evaluate the partial results obtained from the use of QUCO2, and to compare with those generated with the other two tools, we have defined a context of use, taking into account the commercial field and state. So, three general interest websites are chosen for each environment: a) an e-commerce site, b) an University portal, and c) an Governmental site, being one of the most widely used government sites among Argentines. The evaluation team was formed with 40 people. Regularly, all of them expressed assiduity in the use of the mentioned websites and the knowledge regarding the same, in terms of functionality, interface, etc.
By analyzing the results in the case of the presented study, it was demonstrated the correct operation of the tool in the evaluation process. The use of the plugin did not present difficulties in their learning curve, according with the feedback obtained from the participants.
a) In the case of www.mercadolibre.com site, using information from QUCO2, there was a quality average value obtained that was 20. It is also evaluated as an excellent quality site according to the quality model described in section 2 Using Nibbler, the obtained value was 5.1, and Alexa positions is in globally ranked number of 2257.
b) For www.anses.gob.ar site, QUCO2 yields an average value of 17, then valuing quality as a very good site. Using Nibbler, the value obtained is 8.4, and Alexa position is globally in the post 13794.
c) In the case of the UTN portal, www.utn.edu.ar, the tool obtains an average value of quality 14, i.e. a regular quality site. Nibbler gets a value 3.6 and Alexa position is globally in the post 33198.
5
Conclusions and Future Works
As a result of partial validation and considering the comparison of the evaluation results obtained using QUCO2, and against the values obtained using the other two tools already available on the market, there is similarity in the levels of quality for websites of the case studied. However, unlike other applications, it was found that AUCO2 represents an interrogative tool that gets its final evaluation value considering a set of metrics defined in the model WQM of WQF, and not focusing on quality aspects or isolated quality criteria. It also stresses that being an open-source implementation facilitates their implementation and use in any environment.
As future works, it is intended to continue the development of the framework, including first, the missing metrics (Maintainability, Safety, Availability and Scalability) of the quality model and to the software tool, according to the needs presented by web applications. QUCO2 also aims to bring all kinds of software, according to defined quality in different models.
6
References
1. ISO. “Systems of Quality Management – Concepts and Vocabulary”. Internacional Norm ISO 9000,2000.
2. Abrahao, Silvia; Pastor, Oscar; Olsina, Luis; Fons, Joans. “A method for measuring the functional size and assess the quality of websites”. Group I+D in Software Engineering (GIDIS).Faculty of Engineering, UNLPalm. La Pampa, Argentina. 3. ISO, “ISO/IEC 14598 – Software Product Evaluation” (2001)
4. ISO, “ISO/IEC 9126-1 – Software engineering–Product quality – Part 1: Quality Model” (2001)
5. ISO, “ISO/IEC 9126-2 – Software engineering– Product quality – Part 2: External Metrics” (2003)
6. ISO, “ISO/IEC 9126-3 – Software engineering– Product quality – Part 3: Internal Metrics” (2003)
8. Martínez, Nelson Enrique León; Chacon Pinto, Nelson. “Computational tool for evaluation of software product quality framed in research”. Pereira Technological University.
9. Pinto, Noelia; Tortosa, Nicolás; Acuña, César; Cuenca Pletsch, Lilian; Estayno, Marcelo. “Evaluation of Web Application Quality assisted by technological tools”. WICC 2013. ISBN 978-987-28179-6-1
10. Hernández, Edgar; Martínez, Luis. “Client / Server”.Technological Innovation Club. San José, Costa Rica.
11. Proyecto Twitter Bootstrap V2, http://twitter.github.com/bootstrap
12. Proyecto Less, http://lesscss.org
13. Symfony, Framework de Desarrollo Web, http://www.symfony-project.org/ 14. Proyecto Propel, http://www.propelorm.org