MODELING AUDITORY DISTANCE PERCEPTION IN ROOMS
PACS: 43.66Qp.
Bronkhorst, Adelbert W. TNO Human Factors POB 23, 3769 ZG Soesterberg The Netherlands Tel: +31 346 356234 Fax: +31 346 353977
E-mail: [email protected]
ABSTRACT
Although the direct-to-reverberant energy ratio is an important cue for distance perception in rooms, it is not known how it is determined by the auditory system. One clue is provided by certain systematic errors made by listeners, which can be modelled by calculating the direct energy from the impulse response using a fixed time window (thus including some early reflections). This model cannot explain, however, why distance perception depends on the presence of lateral reflections. Better results can be obtained with another model, which supposes that the (incomplete) separation of direct and reverberant energy is performed by the binaural system.
INTRODUCTION
It is well known that our ability to perceive distances of sound sources depends on several different cues. These cues are in some way weighted and combined by the auditory system [1]. Cues that have been studied are sound intensity [1-4], the direct-to-reverberant energy ratio (D/R ratio) [1,5-9], and interaural differences [10]. Not all cues are equally effective in all circumstances. Interaural differences, for example, only show a clear dependence on distance when the source is not further away than about 1 m. The D/R ratio is, evidently, only relevant when the environment contains reflecting surfaces. Intensity has the drawback that it is a relative cue: it can only be interpreted correctly when the listener has priori knowledge of the source intensity. In addition, the intensity cue is less useful in the indirect field of a sound source that is placed in a reverberant environment – it is then determined by the (virtually constant) level of the reflections, and not by the (distant-dependent) level of the direct sound.
The D/R ratio is a particularly interesting cue because it is, in principle, absolute (i.e., independent of source intensity) and able to code a wide range of distances in many different enclosed or semi-enclosed environments. The cue is also of interest because it has apparent limitations. It has been shown repeatedly that the perceived distance of a sound source in a room is compressed: it increases virtually linearly with source distance at short range, but converges to a certain limit when the source distance is increased further [6-9]. This limit acts as a sort of “auditory horizon”, which is, however, not constant but depends on the acoustic environment. Another intriguing finding about the D/R ratio is that direct measurement of its just noticeable difference yield values in the order of 6 dB, which translate to unexpectedly large differences in distance [11]. This result seems to suggest that the D/R ratio cue provides distance coding that is coarser than the resolution found in distance perception experiments. However, it is not clear which other cues could have been used instead, particularly in experiments designed to eliminate or minimise cues based on intensity and interaural differences.
reverberant sound. They model this effect by assuming that the energy of the direct sound is determined by integrating the sound energy within a fixed time window with a duration of 6 ms; all energy that arrives later is integrated and taken as estimate of the energy of the reverberant sound. Bronkhorst and Houtgast [9] found that this “modified” D/R ratio could accurately predict perceived distances of virtual sound sources, created with reflections that varied in number and/or level. They also showed that they could apply their model to previously published data obtained in real acoustic environments.
The time window of 6 ms, used in the model, is long enough to include some early reflections from nearby surfaces. This provides an explanation for the compression of perceived distance because the energy of the early reflections falling within the window decreases less as a function of source distance than the energy of the direct sound. Thus, the contribution of these reflections to the estimated energy of the direct sound increases with distance until they are dominant. The “auditory horizon” occurs at that point because, as a result of these reflections, the estimated direct energy will hardly change when the distance is increased further. The model can also explain the relatively large jnd of the D/R ratio that was observed by Zahorik [11]. Because the estimated energy of the direct sound is partly due to reflections, a given change of the D/R ratio corresponds to a smaller change of the “modified” D/R ratio and to a smaller change in perceived distance, than expected. This was found by Bronkhorst and Houtgast [9] in conditions where they varied the level of the reflections: a 3-dB level increase did not result in an increase of the perceived distance by a factor 1.4, as would be predicted by the actual D/R ratio, but in a smaller increase, by a factor of about 1.1 (see the data for 27 reflections in Fig 2 of [9]).
However, subsequent research [12] has shown that there are two important problems associated with the model of Bronkhorst and Houtgast [9]. First, it is not clear how the auditory system is able to extract the modified D/R ratio from the perceived sound. The hypothesis that this information is derived from sharp on- and offsets is refuted by evidence that distance perception is unaffected by the shape of the envelope of the sound. Second, it appears that (artificial) reduction of the interaural crosscorrelation (of headphone sounds, simulating virtual sources at various distances) results in a strong decrease of the perceived distance. This suggests that distance perception relies on binaural information rather than on the (single-channel) time-domain representation of the sound. In the present study, further evidence is presented supporting the idea that distance perception is based on binaural information. In addition, a new – binaural – model is presented that can accurately predict both the present data and the original data collected by Bronkhorst and Houtgast [9].
METHOD
Distance ratings were obtained from six normal-hearing subjects, for virtual sources located in front, at distances of 1, 2, or 3 m. Stimuli were noise bursts with a duration of 600 ms and with on- and offset durations of 10 ms. They had an average level of approximately 65 dBA and were presented with a quasi-random rove of –4, 0 or +4 dB. The rove was introduced in order to minimise the effect of absolute level on the distance judgements. Ratings were given by pressing one of eight buttons, corresponding to distances increasing from 0 – 3.5 m in steps of 0.5 m. During the experiment, subjects were seated in a rectangular room with a volume of 37 m3 and a reverberation time of 0.1 s; they were facing a (silent) loudspeaker (a JBL Micro loudspeaker), placed at a distance of 3 m. The line between the subject’s head and the loudspeaker was parallel to the major axis of the room, about 0.3 m to the left of this axis. Two poles were placed between the subject and the loudspeaker, at distances of 1 and 2 m. The loudspeaker and poles acted as anchor points for the distance judgements.
absorption of the walls, floor and ceiling of the experimental room. Using microphones in blocked ears [13], the HRIRs had been measured individually for each subject at a constant source distance of 1.1 m and with an angular resolution of about 5.5º. They had a duration of 3.4 ms (128 taps at 37.5 kHz). In order to create a reflection, the HRIR for the (approximately) correct direction was selected and subsequently filtered in 1/3-octaves according to the calculated frequency spectrum. Finally, based on the reflection’s pathlength, the HRIR was attenuated and a delay was added.
Condition nr.
Completely absorbing walls
Nr. of reflecting walls
Nr of lateral reflecting walls
1 l, r, b, c 2 0
2 r,b,f,c 2 1
3 l,r,c 3 0
4 r,b,cl 3 1
5 b,c 4 2
6 l,r 4 0
7 c 5 2
8 r 5 1
9 -- 6 2
Table I – Listing of the 9 experimental conditions, indicating which walls were made absorbent, and how many reflecting (lateral) walls remained. The letters in the second column correspond to the following surfaces: ceiling (c); left (l), right (r), front (f) and back (b) walls.
[image:3.596.128.441.162.298.2]The experiment was designed to determine how distance perception varies when specific reflections (in particular lateral reflections) are removed from the binaural impulse response. Reflections were removed by making certain surfaces completely absorbent (their absorption coefficients were set equal to 1). As indicated in Table I, there were 9 conditions in which different combinations of surfaces were made absorbent. In each condition, 2 stimuli were presented at each of the 3 levels and from each of the 3 distances. This resulted in 18 stimuli, which were played in random order. The 9 conditions were presented together with 3 other conditions, not discussed in this paper. The order of these 12 conditions was balanced over subjects using two identical 6x6 Latin squares, which were presented in an order that was reversed after each subject. Before the experiment started, the quality of the simulation was tested by presenting subjects with sounds emanating from a virtual source that coincided with the real source. All subjects indicated that the sound seemed to originate from the real (silent) source.
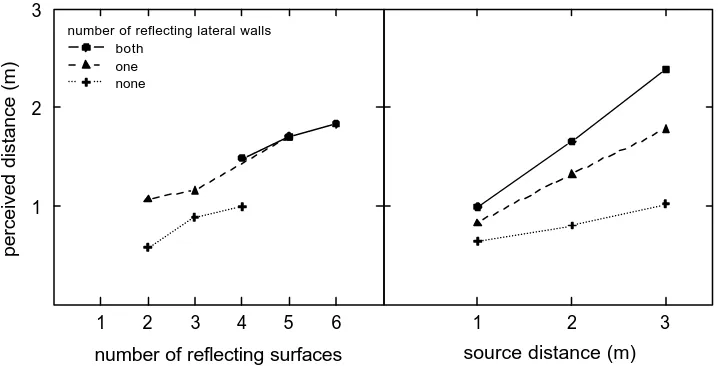
Fig. 1.- Results of the listening experiment. Perceived distance is plotted as a function of the number of reflecting surfaces (left-hand panel) and as a function of source distance (right-hand panel). Data points connected by lines represent conditions with the same number of reflecting lateral walls.
1 2 3 4 5 6
number of reflecting surfaces
1 2 3
perceived distance (m)
both one none
number of reflecting lateral walls
1 2 3
[image:3.596.102.461.520.703.2]RESULTS
A within-subjects ANOVA, applied to the results, revealed that the effects of condition and distance, as well as their interaction, were all highly significant (p<0.0001). The effects of roving was also significant (p=0.02) but it was relatively weak: the maximum level change of 8 dB resulted in an average shift in perceived distance of only 0.12 m. This indicates that the rove had been successful in minimising the influence of absolute level. The main effect of condition is illustrated in the left-hand panel of Fig. 1, which shows the perceived distance as a function of the number of reflecting surfaces included in the mirror-images calculation. The lines connecting data points represent conditions where the number of reflecting lateral walls was either 0, 1, or 2. The figure illustrates that perceived distance increases as a function of the total number of reflecting surfaces, and depends, in particular, on the number of reflecting lateral walls. The smallest perceived distances are obtained for conditions where both lateral walls were absorbent. In the right-hand panel of Fig. 1, the effect of source distance is shown separately for the conditions with different numbers of reflecting lateral walls. It appears that perceived distance increases hardly as a function of source distance when both lateral walls are absorbent. In contrast, the dependence on source distance is much more pronounced when these walls are reflecting (although distances above 1 m are still underestimated).
MODEL PREDICTIONS
According to the model presented by Bronkhorst and Houtgast [9], the perceived distance ds can be calculated using
d
s= Ar
h(Ê
r/Ê
d)
½,
[image:4.596.116.475.502.684.2]where A is a constant, rh is the reverberation radius of the room [14], and Êr and Êd are the modified energies of the reverberant and direct sound, respectively. As explained in the Introduction, the modified direct energy is obtained by adding the energy of early reflections arriving within the first 6 ms to the energy of the direct sound (the model uses a window with a sine-shaped cutoff for this purpose); the modified reverberant energy is simply the total energy of the remaining reflections. In applying the model, the (relative) energies of the direct sound and the reflections are determined using delta functions instead of the individualised HRIRs. This means that the model uses the (single-channel) room impulse response and not the (two-channel) binaural impulse response as input.
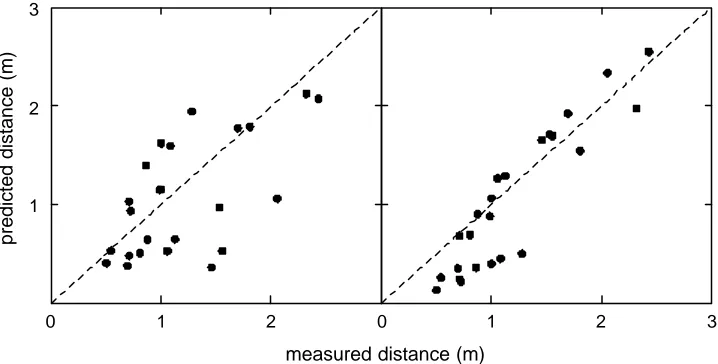
Fig. 2.- Plot showing predicted distance as a function of perceived distance for the data of the present experiment. Predictions were calculated using the original model of Bronkhorst and Houtgast [9] (left-hand panel) and a modified model, described in this paper (right-hand panel).
It is expected that the model is not able to predict effects caused by a reduction of the number of lateral reflections, because Êr and Êd depend only on the arrival times of the (early)
0 1 2
1 2 3
0 1 2 3
measured distance (m)
reflections and not on their angles of incidence. In order to test this, the model was applied to the results of the first 8 conditions of the present experiment. Data were averaged across subjects and presentation levels; this resulted in a total of 24 data points. The parameters of the model were taken equal to those reported in [9] with the exception of the parameter A, which was fitted to the data. As illustrated in the left-hand panel of Fig. 2, there is, indeed, a relatively low correlation (ñ = 0.62) between perceived and predicted distances.
In order to obtain better predictions, a simple but fundamental change was made to the method for calculating Êr and Êd. Instead of using the arrival time of reflections as basis for determining whether their energy should be added to that of the direct sound, the interaural time delay (ITD) was used. Thus, Êd was taken equal to the total energy of incoming sounds with ITDs that differ less than Ä from that of the direct sound, irrespective of their time of arrival. Because all sounds were presented from the front (ITD = 0 ìs), an ITD window was used that ranges from –Ä to +Ä ìs and that has sine-shaped cutoffs. As estimate of Êr, the total energy of all remaining reflections was taken. The ITD for each reflection was calculated using the following, approximate, equation [15]:
ITD = {arcsin(cosÖsinè)+cosÖsinè}a/c,
where è and Ö are the azimut and elevation, respectively, of the reflection, a is the radius of the head (a value of 8.2 cm was used) and c the speed of sound. The value of Ä was determined by applying the new model to the original data used in the Bronkhorst and Houtgast study [9]. This data set comprises results for a total of 21 conditions, in which three different levels of the reflections were used, and the number of reflections was varied between 1 and 800. The number of virtual source distances was either 5 (in 9 conditions) or 3 (in the remaining 12 conditions). This resulted in a total of 162 data points. Fitting the model yielded an optimal value of 36 ìs for Ä, and a correlation coefficient of 0.95 between measured and predicted data. The correlation coefficient is, surprisingly, somewhat higher than the value obtained when using the original model. Subsequent application of the model to the present data, using the same value of Ä, but taking the best-fitting value of A, resulted in predictions that were significantly better (ñ = 0.91) than those obtained with the original model. These results are shown in the right-hand panel of Fig. 2.
CONCLUSIONS
In the present paper, evidence is presented that auditory distance perception in rooms depends on the number of reflecting surfaces in the room and, in particular, on the number of reflecting lateral walls. When the two lateral walls are made completely absorbent, the perceived distance of sound sources is close to the head and virtually independent of source distance. This strongly suggests that the distance cue used by the auditory system in these conditions depends largely on the presence of lateral reflections, coming from these walls.
Given that distance cues based on absolute level have been minimised in this experiment (by roving the level) and cues related to interaural differences have been removed (by using HRIRs measured at a constant distance), it can be assumed that subjects used the D/R ratio as predominant distance cue. Bronkhorst and Houtgast [9] used the same approach in their experiments and were able to formulate a simple model, based on a modified D/R ratio derived from the room impulse response, that could predict perceived distances for a wide range of conditions. The model assumes that the auditory system makes an inaccurate estimate of the direct energy because the reflections arriving within the first 6 ms are added to the direct sound. However, the model provides poor predictions of the current results, because it does not take the angle of incidence of the reflections into account.
data of Bronkhorst and Houtgast [9]. Interestingly, this fit was at least as good as that obtained with the original model. However, the new model performed significantly better than the original one when it was applied to the results of the current experiment.
The current findings provide support for the hypothesis that the D/R ratio cue is, actually, a binaural cue, and that it is based on ITD differences between incoming sounds. It is, however, clear that this hypothesis is still based on a limited body of data and that further validation is required.
BIBLIOGRAPHICAL REFERENCES
[1] P. Zahorik: Assessing auditory distance perception using virtual acoustics. J. Acoust. Soc. Am. 111 (2002) 1832-1846.
[2] M.B. Gardner: Distance estimation of 0º or apparent 0º-oriented speech signals in anechoic space. J. Acoust. Soc. Am. 45 (1969) 47-53.
[3] P.D. Coleman: Failure to localize the source distance of an unfamiliar sound. J. Acoust. Soc. Am. 34 (1962) 345-346.
[4] P.D. Coleman: An analysis of cues to auditory distance perception in free space. Psych. Bull. 60 (1963) 302-315.
[5] G. v. Békésy: Über die Entstehung der Entfernungsempfindung beim Hören. Akustische Zeitschrift 3 (1938) 21-31.
[6] R. Wettschureck, G. Plenge, F. Lehringer: Entfernungswahrnehmung beim natürlichen Hören sowie bei kopfbezogenen Stereofonie. Acustica 29 (1973) 260-272.
[7] D.H. Mershon, L.E. King: Intensity and reverberation as factors in the auditory perception of egocentric distance. Percept. & Psychophys. 18 (1975) 409-415.
[8] S.H. Nielsen: Auditory distance perception in different rooms. J. Audio Eng. Soc. 41 (1993) 755-770.
[9] A.W. Bronkhorst, T.Houtgast: Auditory distance perception in rooms, Nature 397 (1999) 517-520.
[10] D.S. Brungart, , N.I. Durlach, W.M. Rabinowitz: Auditory localization of nearby sources. II. Localization of a broadband source, J. Acoust. Soc. Am. 106 (1999) 1956-1968.
[11] P. Zahorik: Direct-to-reverberant energy ratio sensitivity. Submitted to J. Acoust. Soc. Am. (2002).
[12] A.W. Bronkhorst: Effect of stimulus properties on auditory distance perception in rooms. – In: Physiological and Psychological Bases of Auditory Function. D.J. Breebaart, A.J.M. Houtsma, A. Kohlrausch, V.F. Prijs, R. Schoonhoven (eds.). Shaker, Maastricht, The Netherlands, 2001, 184-191.
[13] H. Møller, M.F. Sørensen, D. Hammershøi, C.B. Jensen: Head-related transfer functions of human subjects. J. Audio Eng. Soc. 43 (1995) 300-321.
[14] H. Kuttruff: Room acoustics. Applied science publishers, Essex, United Kingdom, 1973. [15] P. Minnaar: Simulating an acoustical environment with binaural technology. PhD Thesis, Aalborg University, Denmark, 2001.