Neural Network based Fault Diagnosis Procedure for the Detector System
of CFDF
M.I. Khalil
Reactor Physics Department, Nuclear Research Center, Atomic Energy Authority, Egypt.
Magdi_nrc@hotmail.com
ABSTRACT
This paper outlines and deals with the problem of fault detection, isolation and identification of the four-elements detector system attached to the Cairo Fourier diffractometer facility (CFDF) used for neutron time-of-flight (TOF) spectrum measurements. A feed forward neural network and error back propagation training algorithm are employed to diagnose four commonly occurring faults of the detector system: preamplifier, amplifier, discriminator and the high voltage. The diagnostic system processes the acquired data to determine whether the detector system state is normal or not. The experimental results showed that the trained network has the capability to detect and identify various faults which can make one of the detector units to be out of order.
Keywords: Fault Detection / Neutron Time-of-Flight / Neural Networks.
1.
INTRODUCTION
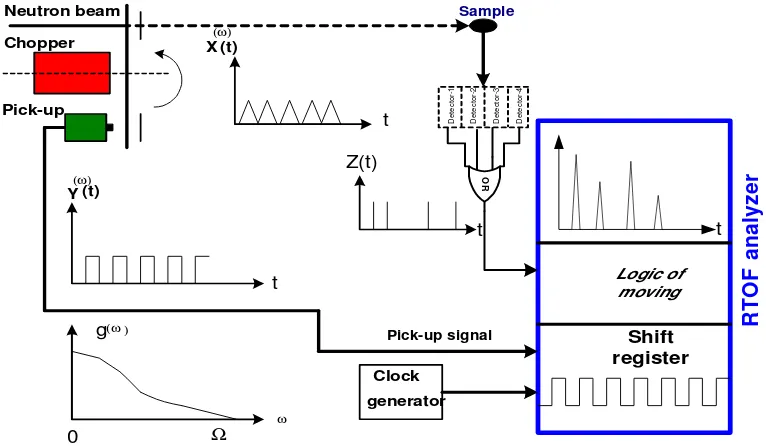
The neutron time-of-flight (TOF) method has been used successfully for studying the properties of condensed matter, as it allows to study the sample under exceptional conditions e.g. at high pressure or temperature [1-4]. The Fourier (TOF) approach, has been developed [5], as it offers a duty factor up to 50% while the Fermi chopper systems make use of only ~ 0.1 – 0.5% of the available neutrons [6]. The Fourier method has been improved by the reverse time-of-flight (RTOF) concept which is based on the triggering of the (TOF) analyzer by the detected neutrons instead of the rotor’s position [7]. The Cairo Fourier Diffractometer Facility (CFDF) is installed in front of one of the ET-RR-1 reactor horizontal channels [8,9]. It is based on the reverse time-of-flight concept [3] where the detector system consists of several independent units. The layout of the RTOF diffractometer is schematically
neutron beam is modulated by the chopper
according to some function x(t), whose values are always in the range 0 x(t) 1. This function is a periodic function the frequency of which is varied in an appropriate manner during the experiment and is independent of neutron velocity. The transmitted neutrons are scattered by the sample into the detector, the detector signals are used to start the multi-channel analyzer. The multi-channel analyzer performs the cross-correlation functions between the pick-up signal coming out from the chopper and the neutron y signal coming out from the detector yielding the diffraction pattern of the measured sample. The electronic devices attached to each detector unit (preamplifier-amplifier-discriminator) are great sources of faults and abnormal situations. Consequently, the maintenance and diagnosis of the CFDF failures is a quite a task. The accurate diagnosis is mandatory, as it should lead to high system reliability and can save maintenance costs. The analog rate meter attached to the CFDF displays the average neutron count per second for the detector system as all. Consequently, the current organization and equipments of the CFDF have not the ability to determine the faulty device. Accordingly there is a need to design and implement a diagnosis system to help locating the faulty device. Therefore the present work suggests and simulates ANN(artificial neural network)-based identification system for CFDF’s detector system. 1.1 The CFDF Detector System
coming out from the preamplifier is connected to an amplifier. In order to count the pulses properly by a digital counter, the shaped linear pulses must be converted into digital ones. Consequently, the main amplifier is followed by a discriminator in order to generate a logic pulse output if the pulse amplitude exceeds a predetermined discrimination level. The electronic arrangement as attached to every detector unit is shown in Fig.2-c. The output signals from the four elements of the CFDF detector system are logically summed, giving rise to one output signal. A new data acquisition system has been developed to replace the Finish made RTOF analyzer [9,10]. The new system performs the cross-correlation function separately between the pick-up signal and
the signal coming out from each detector element.
2.
DETECTOR SYSTEM FAULTS
IDENTIFICATION SYSTEM
The main possible faults should be defined precisely and can be summarized, for each detector unit, as:
- The preamplifier failure leads to very low neutron count. (4 faults).
- The high-voltage failure causes blocking of the detector elements and consequently leads to very low neutron count. This failure can affect the four photomultipliers of the detector system as they are fed from the same high-voltage source. (1 fault).
Shift register Logic of
moving
t
Clock generator Neutron beam
Pick-up signal R
T
O
F
a
n
a
ly
z
e
r
Sample
X (t)
t
(ω) )
Z(t)
Y (t)
(ω)
t
Chopper
Pick-up
g(ω )
ω
Ω
0
D
e
te
c
to
r-1
D
e
te
c
to
r-2
D
e
te
c
to
r-3
D
e
te
c
to
r-4
O
R
[image:2.595.85.468.80.303.2]t
Figure 1: Schematic of the RTOF diffractometer operation principle
[image:2.595.100.512.536.718.2]Data
Acquisition
System
PC Computer
USB
cable
ET-RR-1 reactor
Curved
neutron guide neutron guideStraight
Fourier chopper
Detector system
Det-2 Det-1
Det-3
Det-4 Neutrons
beam
P A D
P A D
P A D
P A D
- Low-gain or high-gain adjustment of the amplifierleads to false neutron count below or above the normal counting rate. (4 faults). The amplifier failure leads to low or high neutron count as well. - The developed data acquisition system performs
the cross-correlation function separately for each
[image:3.595.94.511.213.343.2]detector element and accordingly each amplifier is followed by a separated discriminator. The discriminator’s failure leads to low or high neutron count. (4 faults).
Figure 3: The systematic diagram of the data acquisition system attached to the CFDF In summary, all of these faults have a negative
effect on the detector performance and consequently the CFDF measuring time. The transfer functions of the electronic units of the detector system are nonlinear and this makes the
diagnosis process very complicated. It is noticeable, from the previous failures list, that different reasons can cause the same fault. The low neutron count, for example, can be caused by the high-voltage, preamplifier, amplifier or
Detector-1
Detector-2
Detector-4 Detector-3
preamplifier-1
preamplifier-3
preamplifier-4 preamplifier-2
No-Error
high-voltage
Amplifier-1
Amplifier-2
Amplifier-3
Amplifier-4
Discriminator-1
Discriminator-2
Discriminator-3
Discriminator-4
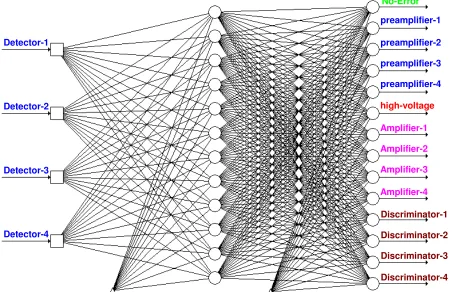
[image:3.595.74.527.459.751.2]discriminator failures. There are reasons that affect single detector where others affect the four detector units. The proposed ANN identification algorithm is based on measuring the frequency of the digital signal output from each discriminator which represents the neutron count rate (neutrons/s) recorded by the corresponding detector. In order to use ANN for identifying detector fault and no-fault conditions, it is necessary to select proper inputs and outputs of the network, structure of the network, and train it with appropriate data. In the present work, inputs are selected as digital signals coming out from the detector units where each digital pulse represents detecting of one neutron. Therefore, there are 4 inputs representing the neurons counts. There are 14 outputs corresponding to 13 faults listed before and a no-fault condition. The output goes to 1 if that particular condition exits, otherwise it is zero. Therefore, there are 14 output neurons. To accomplish this objective, a hardware system is designed and built to acquire four-detector signals from CFDF (Fig.3) [10]. It is depicted a general model of ANN in Fig.(4). Thus, it was used 3-layer feed-forward ANN algorithm. The following relation accomplishes the computation of the neural network’s outputs Ok for
any given input pattern zp :
, = ,
where fok and fyj are respectively the activation
function for output unit ok and hidden unit yj; wkjis
the weight between output unit okand hidden unit yj
; zI,p is the value of input unit ziof input pattern zp;
the (I+1)th input unit and the (J+1)th hidden unit are bias units representing the threshold values of neurons in the next layer. It was taken the monotonous increasing sigmoid function in the algorithm in the previous equation classically:
= +
2.1 Neural Network Training
The artificial neural network is trained so that application of a set of input produces the desired set of outputs. Training is accomplished by sequentially applying input vectors, while adjusting network weights according to pre-determined procedures. During the training process, the network weights gradually converge to values such that each input vector produces the desired output vector [11]. Training algorithms are categorized as
supervised and unsupervised. Supervised training requires the pairing of each input vector with a target vector representing the desired output. The input vector is applied, the output of the network is computed and compared with the corresponding target vector, and the difference is fed back through the network and the weights are changed according to an algorithm that tends to minimize the error. Unsupervised learning is an important concept in neural networks that led to the development of various configurations of learning phenomena. The training set consists solely of input vectors. The training algorithm modifies network weights to produce output vectors that are consistent. The training process extracts the statistical properties of the training set and groups similar vectors into classes. Learning typically occurs by example through training, where the training algorithm iteratively adjusts the connection weights (synapses). Backpropagation (BP) is one of the most famous training algorithms for multilayer perceptrons. BP is a gradient descent technique to minimize the error E for a particular training pattern. For adjusting the weight (wij) from the Ith
input unit to the jth output, in the batched mode variant the descent is based on the gradient !
"#)
for the total training set :
∆!"# % = −' ∗)!)
"#+ * ∗ ∆!"# % −
The gradient gives the direction of error E. The parameters and are the learning rate and momentum respectively [13].
In this paper, the Sigmoidal function is used to describe the nonlinearity (logistic function) associated with each neuron. The ANN structure shown in Fig.(4) is trained with a data sets obtained from the actual faults created on the detector system electronics. This study uses the neutron counts coming out from the four detector units as inputs to ANN. A total of 2100 input patterns corresponding to different faults, as described in Table (1), are used.
Table (1): Number of Training Patterns per Fault.
Condition Number of patterns
No fault 300
Low neutron count for Det1, Det2, Det3 and Det4
200
Low neutron count for Det1. 200
Low neutron count for Det2. 200
Low neutron count for Det3. 200
Low neutron count for Det4. 200
High neutron count for Det1. 200
High neutron count for Det2. 200
High neutron count for Det3. 200
[image:4.595.318.521.605.763.2]Table (2): Samples of input/output patterns.
These fault patterns represent various possible combinations for each fault. The no fault 300 patterns represent neutron counts coming out from the detector system during the experimental measurements carried out using different samples. Table (2) contains bit samples of these combinations.
Once the ANN structure is constructed, the training process involves choosing parameters for (momentum coefficient) and (learning coefficient) by trial and error, when using back-propagation with momentum algorithm. This study tried number 0.1 to 0.9 in increments of 0.1 for the momentum and learning coefficients and had the best results with 0.7 for and 0.68 for . Selecting the number (N) of nodes in the hidden layer is under intensive study without conclusive answers. The learning performance of the current ANN has been extensively tested under the effect of different numbers of nodes in the hidden layer to attain a mean square error= 0.0035. This learning performance has been tested for different values of k coefficient in the sigmoid function. Some of these results are outlined in Table (3). Based on this study, the number of 12 nodes in the hidden layer yields good training results. Therefore the ANN size is 4:12:14. After 753 training iterations for ANN structure, the Sum of Squared Error (SSE) reduced to 0.0035.
The fault diagnosis system determines which detector unit has faulty electronic device/devices but does not specify the faulty device itself (preamplifier/amplifier or discriminator). In most cases each of the three components is candidate to be faulty one. To determine exactly the out of order device, the following fault isolation procedure should be performed: Run the ANN diagnosis to determine the faulty detector.
- Swap each electronic element of the faulty detector with the corresponding one in one of the faultless detectors under conditions that one device only can be moved to the healthy detector. - Run the ANN diagnosis once again.
- Simple analysis of the recorded results leads to the faulty element.
Table (3): Effect of hidden layer node number (N) on the learning.
N Epochs No. for training convergence(k=1)
Epochs No. for training convergence(k=2) 5
6 7 8 9 10 11 12 13 14
Not converged Not converged Not converged
6790 3994 2495 1970 2570 2238 2001
[image:5.595.74.524.92.406.2] [image:5.595.315.530.622.750.2]The first run yields that the third detector is faulty (preamplifier-3, amplifier-3 or discriminator-3). These components (preamplifier-3, amplifier-3 or discriminator-3) of this detector are swapped with the corresponding ones in the other detectors as following:
After running the ANN diagnosis for the second time, we will get a new faulty detector. Assuming that the run indicated that the second detector (Detector-2) is the faulty one, accordingly the strange element (Amplifier-3) is the faulty one in the system. If there is more than one faulty element in the detector unit, we will get more than faulty detector in the second run and the faulty element (strange element in the row) can be determined.
3.
CONCLUSIONS
A diagnostic system based on ANNs was introduced. The diagnostic system, having acquired the diagnosis knowledge, can represent complex relationships between symptoms and fault types that are difficult to model with traditional physical methods. Artificial neural networks have nonlinear structure and this is an effective feature that it approaches to the results of learning phase. Then, it gives results in test phase in short time. In this paper, feedforward network and error backpropagation training algorithm is used to perform fault detection for the main detector units of the Cairo Fourier Diffractometer Facility. This diagnostic system processes the acquired data to determine whether the detector system state is normal or not. Moreover, the faulty electronic element (preamplifier, amplifier or discriminator)
can be identified and isolated. This is an important feature since it helps the operator to make the correct decision leading to high system reliability and can save maintenance costs.
4.
REFERENCES
[1] H. Poyry, P. Hiismiki and A. Virjo, Nucl. Instr. [2] ! " # # $% & ' (
(1978).
[3] P. Hiismaki, J. Junttila and A. Piirto, Nucl.
' ( )
[4] J. Schroder, V.A. Kudryashev, J.M. Keuter, H.G. Priesmeyer, J. Larsen, and A. Tiitta, J.
$ % * (
[5] V.L. Aksenov, A.M. Balagurov, G.D. Bokuchava, V.G. Simkin, V.A. Trounov , P. Hiismaki + $ % * ( ,
[6] F. Gompf, IAEA Symp. Neutron Inelastic Scattering, Copenhagen, SH- - .
(1968).
[7] J.F. Colwell, P.M. Miller, W.L. Whittemore, IAEA Symp. Neutron Inelastic Scattering,
Copenhagen, SM- - . ,
[8] R.M.A. Maayouf, IAEA-SR-198/15, International. Seminar on Enhancement of Research Reactor Utilization, Atomic Research Center, Bombay, India, 11-15 March (1996). [9] R.M.A. Maayouf and M.I. Khalil; Nucl. Instr.
,
--[10] ' / & & ( 0 1 & -6 (2005).
[11] Liu, Jinhui and Gu, Fangyu; Nuclear 1 & # - --
[12] D. Liu and Z. Lu; IEEE Transactions on Neural
$ 2( , ,
[13] A. Abraham, "Artificial Neural Networks, Handbook for Measurement Systems Design, Sydenham and Richard Thorn" (Eds.), John Wiley and Sons Ltd., London, ISBN 0-470-02143-8, 901 (2005).