Impact of the laser phase noise on chirped pulse phase sensitive OTDR
5
0
0
Texto completo
(2) Impact of the laser phase noise on chirped-pulse phase-sensitive OTDR Juan Pastor-Graells*a, Maria R. Femandex-Ruiza, Hugo F. lvlartinsb, Andres Garcia-Ruixa, Sonia Martin-Lopez“ and Miguel Gonzalez-Herraeza aDepartamento de Electronica, Universidad de Alcala, Escuela Politécnica Superior, 28805 Madrid,. Spain; brocus s. L., cr Orellana, 1, 1“ Ixqda, zsooa Madrid, Spain ABSTRACT. In this work, the impact of the laser phase noise on chirped-pulse phase-sensitive OTDR signals is theoretically and experimentally analyzed. In particular, it is shown that the noise in the readings of strainftemperattlre changes along the fiber scales directly with the frequency noise power spectral density of the laser. The effect of the pulse chirp on the signal to noise ratio is also investigated. Three lasers with different linewidths [5 MHZ, St} kHz and 25 kHz), i.e., with different phase noise, were used for the experimental study, confirming the validity of the theoretical model.. Keywords: Fiber optics sensors, optical time domain reflectometry, linear chirp, distributed acoustic sensor. 1. INTRODUCTION AND OPERATION PRINCIPLE Distributed Acoustic Sensing (DAS} technology is especially well suited for continuous monitoring of mechanical variations {e.g., vibration, displacements) over long distances or intrusions over large perimeters. In particular, phasesensitive optical time-domain reflectometry UIIOTDR} is an interesting solution that is gaining considerable attention in recent years [l], mostly within the framework of distributed vibration detection [2]. Recent progress in IIJOTDR has extended its applications to temperature or strain measurements using linearly chirped pulses [3]. Chirped-pulse IIJOTDR allows for the linear and single-shot strain measurements along several tens of. kilometers in the l<I—L=: fiequency range with ne resolutions, thereby enabling acoustic sensing [3]. In this technique, as in traditional IIJOTDR, a highly coherent optical probe pulse is injected into a single mode fiber and the backscattered signal is analyzed in the temporal domain. Thus, when no perturbation is applied onto the fiber, the detected trace remains constant over the time. In the traditional case (non-chirped probe optical pulse}, when a refractive index change. Arr [i.e., temperature or strain change) occurs in a fiber section, the corresponding section of the power trace varies nonlinearly with the undergone change. In contrast, when a linearly chirped pulse is launched into the fiber, a refractive index change translates into a proportional temporal shift in the corresponding section of the power trace [3,4]. The. relationship between An suffered by a fiber section and the temporal shift [3] is. a M:[1]{ VP] at, rr. v,,. er,. (1). where w, is the central frequency of the probe pulse, r,,. the temporal length, Av? the chirp spectral content and Ar the measured temporal shift, obtained by means of temporal correlations. Finally, An is related with the temperature change AT or strain As with the expression An.-"11 = - 6.92 - 1[}"5 -AT= - [ITS - As {rt being the effective fiber refractive index), as given by Koyamada in [5].. 2. IPPIPACT OF THE LASER PHASE NOISE ON THE MEASUREMENT UNCERTAINTY To realize a theoretical analysis of the impact of the laser phase noise in the sensor, we first introduce a general expression for the employed optical pulse. The complex envelope of the pulse P{r,.r}, with rectangular intensity profile of. amplitude EU, temporal length r,, and instantaneous angular frequency profile v(r) = v.3. + [A1-;,.=’2 — Av, - [n‘r,,]), is [3]: *Contact author: [email protected]; phone +34 91 SS5 6914.
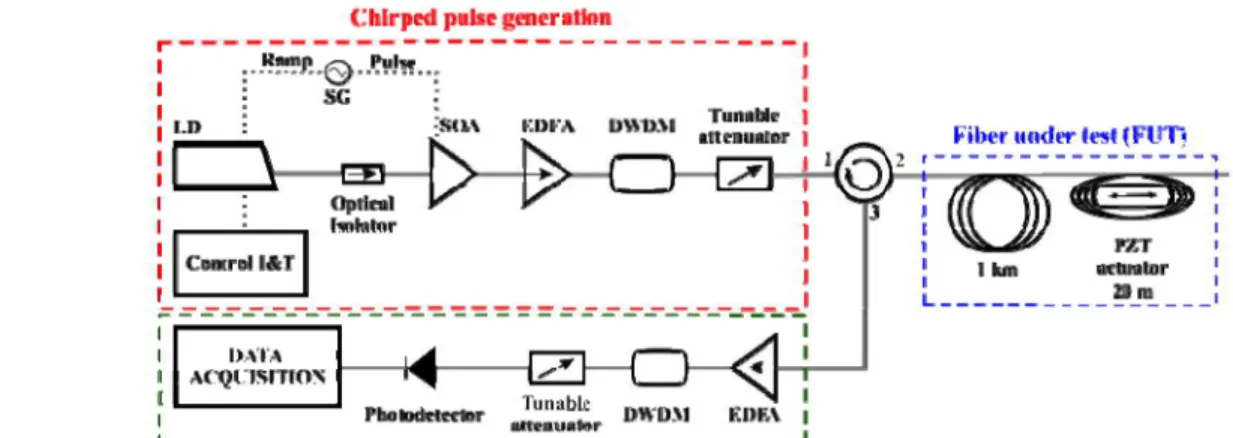
(3) tit. PU‘, z) = Ea -recr. '-. yr-11'. -.-_'. '. ". l ef 2 “H-I I--]e"’f'{'”.. (2). is where I, is considered the time taken by the pulse to reach the position z in the fiber and -p,.(r] is the random phase noise. induced by the laser. The random instantaneous frequency due to §:e{r) is defined as l cf .. "*“l=n%U)*. 6}. Following a similar derivation as in [3], it can be easily demonstrated that v,{r) induces a local temporal shift in the trace. ar(r) = [. J - v, (r) .. (4). Using Eq. 1, it is possible to relate a temporal shift in the trace with a variation in the refiactive index. Thereby, the induced error in the strain measurements is related with v,{r) as. S. SEZA.. 1,3. 3. (0.78-v,,)2 SC f. 5. where S, and S,_.,. are the strain and the random instantaneous frequency noise power spectral densities [PSD], respectively. This expression gives us a clear idea about the relationship between the laser linewidth and the strain. uncertainty of the sensor.. Since S,, is proportional to the laser linewidth [6], it can be concluded that S, is also. proportional to Af Hence, choosing a laser with low phase noise will be essential to realize low uncertainty. measurements. In addition, Eq. (4) indicates that, when the iaser phase noise is the limiting factor (as in our setup) the higher the probe. pulse chiip, the lower the uncertainty in the determination of the delay. On the other hand, the nominal delay induced by the refractive index variation to be measured is also inversely proportional to the pulse chirp (Eq. 1). Eventually, this analysis allows us to conclude that the chosen pulse chirp will have basically no effect on the accurate determination of. the measurand in chirped-pulse GJOTDR schemes {i.e. both signal amplitude and laser phase noise effects scale inversely with the chirp}. However, considering that for a linear relationship between delay and refiactive index variation, the delay must be sufficiently short {within 2-3% of the probe pulse width, see [3]), a higher vibration amplitude between. two consecutive traces will be measurable for higher pulse chirp {see Eq. l). As such, the most convenient choice appears to be that the selected chirp value is as high as the system detection bandwidth can accommodate.. 3. EXPERIIIIENTAL SETUP The experimental setup used in this work (Fig. l} is composed by a traditional IIJOTDR scheme, as the one developed in. [2], but introducing a linear chirp in the pulse acting on the current control of the laser. Iihlrped prise generation II I. II I I I I I I I I I I I I I I. ,.s:[email protected]!a..,. fitn. I. . -.,. . . I-.lIl-A. D‘H'D.\I. Tunlli mu" Q.. Fiber no-tier lest i_FLlT'5. .P > "'. 1~. uutrnl Ill‘. tn». ‘In!. httlntor. _——'jHId“h. rttflrlk-I. I.'l-HA. I|—|l- vti. APQI I‘iI".l‘llI'l"'i. I =. :~t. -: I3- III H I. I|':I|. I-.,...-"-. i‘ Pinball-tethr. Thnabh lnuunhr. . IIfl\~II.\I. 4. I. E115!. :. I E I|. Figure l. Experimental setup used. the experiment. Acronyms are explained in the text.. ___,:.
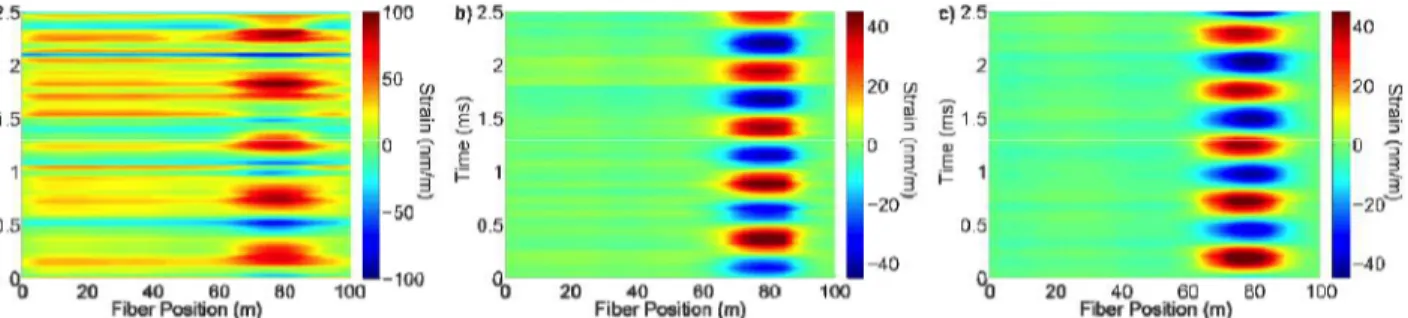
(4) The setip is divided in three main blocks. In the chirped pulse generation block, a Laser Diode (L-D) working in continuous emission is driven by a current and temperature controller to select the central wavelength. A secondary. current control applies a repetitive electric ramp signal in the laser driver in order to apply a linear chirp in the outputted laser light. Three lasers with different linewidth (5 MHz, 50 kHz and 25 kHz) were employed to study the relationship between the measurement uncertainties and the laser phase noise. A Semiconductor Optical Amplifier (SOA) gated the. chirped signal creating square optical pulses of ltltl ns width with three different chirp spectral contents of 350 MHz, 589 MHz and S59 MHz. The secondary current slope, used to create the linear chirp, had to be adapted for each laser in order to obtain the same chirp spectral content. An Erbium-Doped Fiber Amplifier (EDFA) is used to boost the power of the optical pulses before injecting them into the fiber. In order to minimize the effect of the Amplified Spontaneous. Emission (ASE) added by the EDFA, we insert a Dense Wavelength Division Multiplexer (DRTJDM) filter after the EDFA. The bandwidth of this DWDM is 0.8 nm. Once the linearly chirped pulse has been generated, it is injected into the Fiber Under Test (FUT). It consists of l km fiber roll, of which the last 20 m are coiled around a Piezoelectric Transducer (PET) in order to apply controlled vibrations on the fiber. In the intensity detection block, the backscattered signal is amplified and filtered as in the first block. Finally, the signal is detected using a p-i-n photo-detector with a bandwidth of l GHz and a high-speed digitizer with 4t] GSps sampling rate.. 4. EXPERIMENTAL RESULTS We carried out an experiment to demonstrate the extent to which the phase noise of the laser employed for the measurements affects the measurement uncertainty. For this task, 2 kHz vibrations were applied on the last 2[l m of the FUT. Then, these vibrations were detected by the chirped-pulse phase-sensitive OTDR using three lasers with different linewidths: 5 MHz, St] kHz and 25 kHz and a chirp spectral content of S59 lyIHz. The pulses were injected into the fiber with a repetition rate of 4t] kHz. Due to the Nyquist theorem, this system is able to detect vibrations up to 20 kHz. The amplitude of the 2 kHz vibration was set to 4U ne and was subsequently measured with l ne resolution. The three strain measurements are presented in Fig. 2 where the noise level difference between measurements is clearly noticeable. Figure 2a shows the measurement realized using the laser with the highest linewidth, 5 MHz. The region affected by the vibration, between TU m and 90 m in the figure (note that only the last lfltl m of the FUT are shown), can be discemed. but it is slightly diffuse due to the high level of noise covering the measurement. in contrast, the lasers with lower linewidths (lower phase noise) present better results, as observed in Fig. 2b-c. Here, the region affected by the vibration is clearly defined in the color map (red and blue) and the non-affected region is almost totally fiat (green). As it was. expected, the laser with lowest linewidth (25 kHz) presents the best results. 3} 2.5. k. 2. II. 2.-.-V}. i. —?. lfil]. h}2.5. I to. cl. as. 4t]. tt. 2. 4-_—=. It-J l"HJ. as. in. :=. =I'. _‘l\.. in I‘-J. —.. As. I-a_J. ems. T'rr1. 1. I I. Mm. _I|-. Ln. u_e.15. '\—"'. n—\. ems. --_. T'm. UJLUIJU. 6.1. |. u_ri.u. F’‘II. F‘tn. ems. _E|. an. -to] so. Fiber Position [mi. an. [mo “HG. no. J}-. T‘m. I.LIft.ULtu_ei15. -20“ [15. —4t}. Eb. -C3. in. i —zo"'". u_r. U1 Cl. -"1"!. _L 1-I.-r. so _-fit]. an. Fiber Position {ml. U5t1:». 1eo. —-ID. no. 2n. -to. en. FLIJEI Poeilicn {mi. so. we. Figure 2. Strain measurements in the last 1U-3' m of the FUT (during 2.5 ms) employing three lasers with different linewidths. (a) Af=5 lvffh (b) Af= 5U kHz (c) A.f= 25 M. In order to quantify the signal-to-noise ratio (SNR) increase using lasers with low phase noise, the PSD of the recorded vibrations is analyzed. Fig. 3a shows the vibration PSD (around 2 kHz) at TS m (within the last ltltl m of the FUT, point with maximum amplitude) of the data plotted in Fig. 2. The three measurements present the 2 kHz peak with the same amplitude (-T2 dB) but different background noise. The laser with 5 MHz linewidth (black) presents a SNR of 34.4 dB.. In contrast, the one with 50 kHz (red) and 25 kHz (green) present Sl"-lRs of 54.’? dB and 56.)? dB, respectively. Thus, an SNR increase of 2t].3 dB (laser with linewidth of St} kHz) and 22.3 dB (laser with linewidth of 25 kHz) is obtained as compared with the 5 MHz-linewidth laser. These results show a good agreement with the theoretical model: considering. Eq. 4, the SNR increase between the 5 MHz-linewidth laser and the 5'1] kl-Lz and St} kHz-linewidth lasers should be of 20 dB and 23 dB, respectively..
(5) Finally, we experimentally prove that the chosen pulse chirp has no effect on the SNR of the measured vibrations. For this purpose, the error in the delay determination of the strain variation is calculated for three different chirp values,. corresponding to pulse chirp spectral contents of 350 MHz, 589 MHz and 859 MHz, respectively, using the laser with lower phase noise. The results presented in Fig. 3b demonstrate that the amplitude and noise levels are independent on the employed chirp. However, as it was explained before, a higher pulse chirp allows to measure higher vibration. amplitudes. Therefore, it is reconunended to choose the highest possible chirp value in this sensor approach, ultimately limited by the available detection bandwidth of the sensor power trace. 3}. -EU-|i|||—||l—l||l—|||—l||—|. -F0. -T0. —nf = 5 MHz. -80. —n~.- = 350 MHz. iiif = 510 kHz. -90. —n=.- = 51351 MHZ. —nf = 25 kHz. in = B59 MHZ. 100. 5.-roe E-110 U, 12o. E5. 11o 3 120 B. r. '. 130 140. ll. I. 1,0. IAI. I. IAI. 1,5. I. IAI. I. IAI. I. 2,0 2,5 Frequency {kHz}. -I.. 160. IAI. 3,0. 1,?. 1,5. I. I. In. 1,9 2,0 2,1 Frequency |[trHz]|. I. 2,2. 3. 2,3. Figure 3. Spectra of 2 kHz vibration at T8 m (within the last 100 m of the FUT) (ya) from measurements presented in Fig. 2 along 0.4 s (recorded time) with different lasers (5 MHz, 50 kHz and 25 kHz linewidth}; (b) from measurements with 25. kl—Iz linewidth laser and different chirp spectral contents (350 lvlllz, 589 MHz and 859 MHz).. 5. CONCLUSIONS In this work, the negative effects of the laser phase noise on chirped-pulse phase-sensitive OTDR measurements are demonstrated theoretically and experimentally. The use of lasers with a narrow linewidth (low phase noise) allows a significant increase in the SNR of the vibration recording, improving thus the sensor performance. This noise analysis is experimentally carried out via the measurement of vibrations using different linewidth lasers (5 MHz, 50 kHz and 25 kHz) and comparing the resulting SNR. An SNR enhancement of ~22 dB was obtained when decreasing the laser linewidth from 5 MHz to 25 kHz, in good agreement with the expected theoretical improvement. Additionally, the effect of the used pulse chirp on the SNR of the recovered acoustic signal is also evaluated, concluding that the latter is. independent of the chirp. As such, the use of a chirp value adapted to the available detection bandwidth is recommended.. 6. ACI{NO‘WLEDGl\*IE-NTS This work was supported in part by: the European Research Council through project U FINE (Grant 302441); the EC Horizon 2020 program; the FIl*~lESSE- project MSCA-ITN-ETN-222509; the DOMINO Water JPI project, under the Water‘Works2014 cofounded call by EC Horizon 2020 and Spanish MINE-CO; the Spanish MINE-CO through projects TE-C2013-45265-R and TE,C20l5-T112?-C2-2-R; and the regional program SINFOTON-CM: S20l3r‘MIT-2290. The. work of HFM was supported by EU funding through the FP? ITN IC-ONE program, gr. #608099. The work of JPG and SML was supported by the Spanish MINECO through FPI and “Ramdn y Cajal” contracts, respectively.. REFERENCES. [11 [3] [3]. Tejedor, J., et al., "Towards Prevention of Pipeline Integrity Threats using a Smart Fiber Optic Surveillance System," J. Lightw. Technol. (2016), in press. Martins, H. F., et al., "Coherent Noise Reduction in High Visibility Phase-Sensitive Optical Time Domain. Reflectometer for Distributed Sensing of Ultrasonic Waves," J. Lightw. Technol. 31, 3631-363’? (2013). Pastor-Graells, J ., et al., "Single-shot distributed temperature and strain tracking using dnect detection phasesensitive OTDR with chirped pulses," Opt. Express 24(12), 13121-13133 (2016).. [4] Pastor-Graells, J., et al., "Truly linear and dynamic distributed strain sensor using intensity-only measurements," Proc. of OSA Technical Digest (online) (Optical Society of America, 2016), SeM3D.5 (2016). [5] Koyamada, Y., et al., "Fiber-Optic Distributed Strain and Temperature Sensing With Very High Measurand Resolution Over Long Range Using Coherent OTDR," J. Lightw. Technol. 22(9), 1142-1146 (2009). l'-5] Camatel.. S. and Ferrero.. M,. "l"~larrow Linewidth CW Laser Phase Noise Characterization Methods for Coherent Transmission System Applications," J. Lightw. Teclmol. 26(1i'_), 3048-3055 (2008)..
(6)
Figure

Documento similar
That the line profiles of neutral atoms and ions during the outburst phase are different, with the neutral atoms being more sensitive to the velocity variations in the accretion
Indeed, the Brillouin gain spectrum is measured in the electrical domain with central frequency of 351 kHz and a natural width of 4.163 kHz, representing in the optical domain
Three sample treatment methods, based on QuEChERS, solid-phase extraction (SPE) and solid-phase microextraction (SPME), were compared and evaluated in order to obtain the
Both the shapes of the nuclear wave packets at each PES and the relative phase between them, determined by the interaction with the ultrashort pulse during the first CI passage,
AKI depends on the duration and severity of the insult [9]. When acute renal damage occurs, there is a first phase of tubular death, followed by a phase of cell regeneration
In order to extract dynamical information about the excited wave packet associated to the 2pσ u state, we will study the energy-differential ionization probabilities for
Thus, the global evolution of the voltage dip is correctly identified by using the proposed method, while the and absolute minimum method classifies it only as a phase-to-phase
This new experiment consists in changing the second term of equation (6.1), the chirp, for other kinds of functions, so the phase of the pulse will be dif- ferent. Therefore the
