Recursive Total Least Squares Method for Ultrasonic Doppler Frequency
Estimation
PACS REFERENCE: 43.60.Bf
Kim, Yoon Chung; Lim, jun-seok; Song, Jun-il; Sung,Koeng-Mo Seoul National University
132-302, Inst. of New Media & Comm. Seoul National Univ. Shillim-dong, Kwanak-gu, Seoul
South Korea Tel: +82-2-880-8427 Fax: +82-2-886-0791
E-mail: [email protected]
ABSTRACT Detecting blood flow in vessels is one of the most widely mentioned applications of ultrasonic technique in medical diagnostics. The velocity of blood flow is usually obtained by frequency shift of the received signal that experiences Doppler effect. The classical techniques, such as parametric spectral estimation, commonly have been employed and have shown good results when the process is stationary. In practice, however, the received echo signal becomes nonstationary because the streaming blood corpuscles have non-uniform velocities and the performance of the conventional methods is severely degraded.
0. INTRODUCTION
Measurement of blood velocity has been in great interest among biomedical engineers. It is used in many medical devices since the velocity of blood is one of the important factors in diagnosis of the human body. Since the arterial blood flow undergoes pulsation, the clinical signal shows Doppler effect and the Doppler frequency varies with time. Several methods estimating such a Doppler signal have been presented but the more the signal shows nonstationarity, the worse performance of the those estimators becomes.
To improve the performances in such nonstationary environment, we propose a new recursive total least square regressive AR algorithm with variable forgetting factor (VFF-RTLS-AR). This method can estimate the frequency more accurately by Recursive TLS (RTLS) and update the forgetting factor at each time step according to the signal nonstationarity. Therefore, this algorithm can adaptively cope with the nonstationarityand provide more accurate estimation results.
1. ALGORITHM
To derive the RTLS algorithm we first let the equation of the Total Least Square(TLS) be represented by
r
b
x
E
A
+
)
=
+
(
.In this equation, E denotes for M*N data error matrix and r indicates observation error vector whose size is M*1. Then we set a goal of the algorithm to get the value of x which minimizes the total error given by [1].
F
r]T | D[E minimize
r E,
(1)
subject to the constraint
b
+
r
Î
Range(A+E). Here, F× denotes the Frobenius norm. Then this problem can be represented as
T T
W
WW
WRW
min
. (2)W is the solution vector of the total least square method and R is the autocorrelation function which is nonnegative definite. W and R can be shown as, W [1|xT]
=
[
]
å
= ú -û ù ê ëé-= m
i
T i i i
i b a
a b R
1
| .
[ ]
[
]
[ ]
úûù êë é úû ù êë é -ú û ù ê ë é-= + -å
å
= = x x x a b a b x x x b x a T T i i m i i i T x m i T i T i x 1 | 1 1 | | 1 min 1 min 1 2. (3)
W must be the eigenvector which corresponds to the minimum eigenvalue of R to satisfy equation (2). To simplify the problem, we introduce parameter P which denotes for the inverse matrix of autocorrelation function, R. Then the minimum eigenvector of
R becomes the maximum eigenvector of P. Thus, if e(n)=R -1e(n-1)=Pe(n-1), then
n n ) 0 ( ) ( )
(k P e
e = k
) 0 ( ) (VS-1VT ke
=
[
]
(0 ))1 1 1 1 1 e V V V V T T m k m m ú ú ú û ù ê ê ê ë é ú ú ú ú ú û ù ê ê ê ê ê ë é
= L O M
l
l 1 m mT( 1 1 2 2 m m)
k m V C V C V C V
V + + +
÷÷ø ö ççè æ » L l (4) m k m m V C ÷÷ø ö ççè æ = l 1 where m l l l 1 , , 1 , 1 2 1
K denotes for the eigenvalues of P. From the procedure shown above,
we can obtain the maximun eigenvector of P.
According to Matrix Inversion Lemma and introducing this variable forgetting factor idea, the autocorrelation matrix, R can be shown as
[
]
Tn n n n T i i n i i i i
n
b
a
R
u
u
a
b
R
ú
-
=
+
û
ù
ê
ë
é-=
- -=å
1 11
|
l
l
where
u
n=
[
-
b
i|
a
Ti]
T.For simpler calculation, we use, Pn instead of Rn and introduce another parameter Kn:
T n n n n T n n n u P u u P K 1 1 1 -+ = l (5)
Then Pn can be given as
1 -1
1 -1
-=
n n n nn
P
K
u
P
P
l
-l
- . (6)The general method of estimating the particular frequency when the parameters of the AR model known is to use the power spectral density of the data signal [2]. For the frequency estimation of the Doppler signal, we used second-order AR model to evaluate the spectral shift [2]. Especially the frequency whose energy is maximum, is used when we use Doppler effect. It can be obtained by differentiating the power spectral density function with respect to frequency and setting it to zero. The acquired frequency value is given by
÷÷ø ö ççè æ ÷÷ø ö ççè æ + -= -) ( ˆ 1 1 4 ) ( ˆ cos 2 ) ( ˆ 2 1 1 max n x n x f n f s p
. (7)
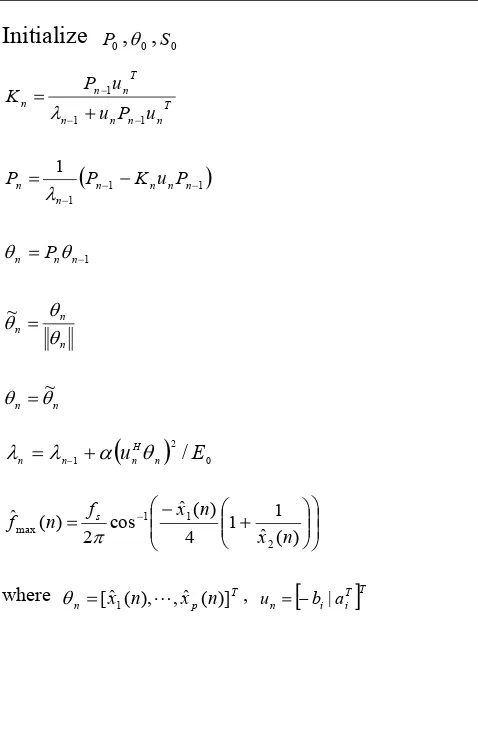
[image:4.595.174.413.359.724.2]For the variable forgetting factor, we apply the frequently cited method in [3]. The overall process of getting this frequency from AR model with VFF RTLS algorithm is summarized in table 1.
Table 1. Summery of the VFF-RTLS algorithm
Initialize
P0,
q0,
S0T n n n n n n n u P u u P K 1 1 1 -+ = l T
(
1 1)
1 1
-= n n n n
n
n P K u P
P l
1
-= n n
n Pq
q n n n q q q~ =
n
n q
q =~
(
)
02 1 u n /E
H n n
n l a q l = - +
÷÷ø ö ççè æ ÷÷ø ö ççè æ + -= -) ( ˆ 1 1 4 ) ( ˆ cos 2 ) ( ˆ 2 1 1 max n x n x f n f s p
where T,
p n =[xˆ1(n),L,xˆ (n)]
q
[
T]
Ti i n b a
2. EXPERIMENTS and RESULTS
In this experiment, we used computer simulation method. The original signal was modeled starting from 200Hz to 3500Hz and decreasing to 500Hz during the time period of 0.8 second. We used sampling frequency of 20kHz, and initial center frequency of 1kHz. Simulation result from the VFF RTLS algorithm proposed in this paper is compared with those from fixed forgetting RTLS and RLS. For RTLS and RLS, two different forgetting factors were applied as 0.98 and 0.9.
In the experiments, we use normalized bias and normalized standard deviation as the performance measure. The normalized bias and the normalized standard deviation are defined as follows.
.
(8)estimation
of
mean
the
is
,
bias
normalized
estim trueestim true
f
f
f
f
-=
(
)
2 2
deviation
standard
normalized
true estim true
f
f
f
-=
(9)The results are summarized in Table 2 and Table 3.
Table 2. Normalized Bais (%)
SNR RLS 0.90 RLS 0.98 VFF-RTLS
30 dB 3.43 2.76 1.59
20 dB 24.69 24.18 4.14
Table 3. Normalized Standard Deviation (%)
SNR RLS 0.90 RLS 0.98 VFF-RTLS
30 dB 2.29 0.57 0.44
20 dB 12.39 5.08 5.09
3. CONCLUSION
In this paper, we proposed a new algorithm for ultrasonic doppler frequency estimation. In computer simulation, the proposed algorithm estimated the frequency more accurately than the fixed forgetting factored RLS algorithm. Moreover this algorithm also has ability to adapt the forgetting factor blindly.
Reference
[1] G.H.Golub and C.F.Van Loan., "An analysis of the total least squares problem", SIAM Journal of Numerical Analysis, pp.883-893, 1980, 17.
[2] Charles W. Therrien, Discrete random signals and statistical signal processing, 1992, Prentice Hall.