Predisposition, insult/infection, response, and organ dysfunction:
A new model for staging severe sepsis
Francesca Rubulotta, MD; John C. Marshall, MD; Graham Ramsay, MD; David Nelson, MS; Mitchell Levy, MD;
Mark Williams, MD, FCCM
S
evere sepsis remains acom-mon and deadly condition de-spite recent advances in aware-ness and treatment. Recently, Martin et al (1, 2) demonstrated that the number of deaths from severe sepsis is
increasing, in part due to the aging of the population. The heterogeneity of patients with sepsis makes risk stratification diffi-cult, both for bedside prognostication and clinical trials. In 1991, a consensus panel of the American College of Chest Physicians and the Society of Critical Care Medicine developed operational def-initions for sepsis to facilitate standard-ized enrolment into clinical trials (3). In addition, numerous tools are available to assess prognosis in critically ill patients (Acute Physiology and Chronic Health Evaluation关APACHE兴II and III, Sequen-tial Organ Failure Assessment, multiple organ dysfunction score, Simplified Acute Physiology Score 关SAPS兴 II, etc); yet, these scoring systems have limita-tions in that they primarily focus only on the physiologic abnormalities (4 – 8). In 2001, a diverse group of sepsis experts at the International Sepsis Definitions Con-ference modified the definition of sepsis and severe sepsis (9). Members of this consensus conference expressed the need for a new, more sophisticated model for
staging the severity of sepsis and the ac-ronym PIRO was introduced: P, predispo-sition; I, insult/infection; R, response; and O, organ dysfunction. Theoretically, similar to the TNM system for oncology, the PIRO staging system for sepsis might be used in the following manner: to as-sess risk and predict outcome in septic patients, to assist with enrolment of pa-tients into clinical studies, and to assess the likely patient response to specific therapeutic interventions. This proposed staging system is unique in that it con-siders multiple different known indepen-dent predictors of outcome. The authors of this proposed staging system cautioned that the PIRO concept was preliminary, intended to be hypothesis generating, and required extensive testing and refine-ment. In this article, for the first time, the PIRO model is developed from a large, controlled clinical trial and then tested in a large severe sepsis registry database. We used the placebo patients from the PROtein C Worldwide Evalua-tion in Severe Sepsis (PROWESS) clinical From the Policlinico University Hospital Catania
(FR), Italy; Saint Michaels Hospital (JCM), Toronto, Canada; West Hertforshire NHS Trust (GR), London, United Kingdom; Eli Lilly and Company (DN, MW), Indianapolis, IN; Brown University/Rhode Island Hospi-tal (ML), Providence, RI.
Supported by Eli Lilly and Company.
Mr. Nelson and Dr. Williams have been employed with Eli Lilly. Dr. Williams holds stock ownership and options in Eli Lilly. Dr. Marshall has received honoraria from Eli Lilly, Eisai Inc, Leo-Pharma, Artisan Therapeu-tics, and Spectral Diagnostics. Dr. Levy has received honoraria from Eli Lilly and Edwards Life Sciences. Dr. Levy has received grant support from Eli Lilly, Philips Medical Systems, Novartis, and Biosite, Inc. The re-maining authors have not disclosed any potential con-flicts of interest.
For information regarding this article, E-mail: [email protected]
Copyright © 2009 by the Society of Critical Care Medicine and Lippincott Williams & Wilkins
DOI: 10.1097/CCM.0b013e31819d5db1
Objective: To generate and validate an initial version of the predisposition, insult/infection, response, and organ dysfunction (PIRO) staging model for risk stratification in severe sepsis. The goal was to create distinct levels of mortality risk within each of the four categories (P, I, R, and O), and that these risk levels would be meaningful in terms of prediction independent of the other categories.
Design:Retrospective analysis using a statistical model utiliz-ing two large, global databases of patients with severe sepsis.
Setting and Patients: Database #1: Placebo-treated patients from a phase III clinical trial of patients with severe sepsis (PROtein C Worldwide Evaluation in Severe Sepsis [PROWESS], 840 patients). Database #2: Global severe sepsis registry per-formed in 276 intensive care units in 37 countries (PROmoting Global Research Excellence in Severe Sepsis [PROGRESS], 10,610 patients).
Interventions:None.
Methods: Classification and regression trees were used to classify patients and derive a scoring system from the PROWESS and PROGRESS databases with internal validation. Regression
tree parameters included Chi-square tests and a minimum of five patients per node. The risk levels were done in a stepwise manner, adjusting for the previous categories. Initially, the pre-disposition scoring was developed, and subsequently, the infec-tion scoring was then developed after adjusting for the predispo-sition levels, and so on. Logistic regression analyses, odds ratios, and area under the receiver operator characteristic curve were used to evaluate the scoring systems.
Measurements and Main Results:Each of the four PIRO com-ponents had similar odds ratios in multivariable logistic regres-sions. In PROWESS, the correlation of the PIRO total score and in-hospital mortality rates was 0.974 (p < 0.0001), and in PROGRESS, the correlation of the PIRO total score and hospital mortality rates was 0.998 (p<0.0001).
Conclusions: PIRO can develop into an effective model for staging severe sepsis, seems to be predictive of mortality, and may be useful in future sepsis research. (Crit Care Med 2009; 37: 1329 –1335)
database and the PROmoting Global Re-search Excellence in Severe Sepsis (PROGRESS) database, a large global reg-istry for sepsis, to create a system to cat-egorize patients according to the PIRO concept (10, 11).
METHODS
We analyzed variables available from the placebo-treated patients from the PROWESS (see Table 1) database to develop a classifica-tion system from PIRO (10). PROWESS was chosen to develop the model because it is a controlled clinical trial with a relatively ho-mogeneous population. Study sites obtained Institutional Review Board approval and writ-ten, informed consent from all patients or their legal representatives. This database in-cludes a total of 1690 patients; however, only 840 patients who received placebo were in-cluded in this analysis. We used the large database from a global registry of sepsis, PROGRESS (11), to further test the classifica-tion system. Entry into PROGRESS was strictly anonymous, and patients were tracked using a study-specific identifier code. Patients were required to have a diagnosis of severe sepsis, defined as evidence of infection with at least one sepsis-induced organ dysfunction. For consistency with the PROWESS placebo database, patients younger than 18 years and those treated with Drotrecogin alfa (activated) were excluded from these analyses. We used classification and regression tree methodology
and logistic regression per standard method-ology (12). Classification trees were designed to extract patient subgroups that were homo-geneous with respect to both outcome and predictor variables. This was accomplished by “recursively” partitioning the data such that at each stage the variable (and its associated cut-point) that best subdivided the data (in terms of optimizing homogeneity) was determined. Cross validation, or an independent test sam-ple within the database, was then used to as-sess how many such divisions to adopt. Re-gression tree parameters included a Chi-square test ⬍0.05 and a minimum of five patients per node. We derived variables asso-ciated with “P” by first scanning patients from PROWESS. Subsequently, we incorporated the results from each previous factor; so, all the PIRO variables were functionally independent. This approach started with a logistic regres-sion in which “P” was used to predict survival, and then the “residuals” (the remaining vari-ation not explained by “P”) were used rather than survival status alone. This approach was designed to create trees independent of “P.” Likewise, the tree for “R” was based on resid-uals from a logistic model based on P and I, and the tree for “O” was based on residuals from a logistic model based on P, I, and R. Logistic regression and their resulting odds ratios and area under the receiver operating curve, and Hosmer-Lemeshow goodness of fit tests were used to evaluate the components of the models. A final composite score was cre-ated, and this score’s correlation to mortality rates was assessed with Pearson product-moment correlation coefficients. All computa-tions were performed using SAS/STAT and SAS/Enterprise Miner software (SAS Institute Inc., Cary, NC).
Definitions. We defined chronic liver dis-ease (CLD) as follows: clinical manifestations of esophageal varices, chronic jaundice, cir-rhosis, or chronic ascites. We defined conges-tive cardiomyopathy (CC), New York Heart Association class IV, as patients with cardiac disease resulting in the inability to carry out physical activity without discomfort.
RESULTS
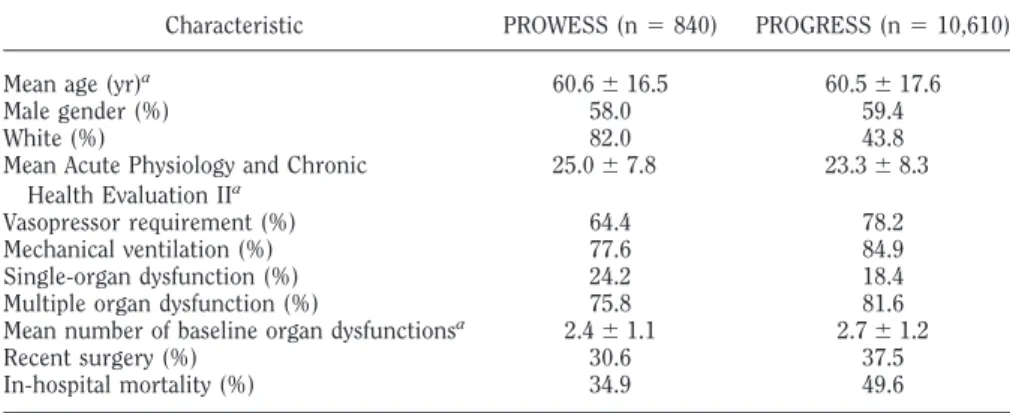
Baseline characteristics for PROWESS and PROGRESS are described in Table 2. The mean age and percentage of males en-rolled in the studies were similar. There were significantly fewer White enrolled in PROGRESS given the very diverse geo-graphic nature of this global sepsis registry. With respect to baseline disease severity, the mean APACHE II score at baseline was similar between the two groups but the patients enrolled in PROGRESS had greater baseline vasopressor and mechanical venti-lation requirements. The PROGRESS pop-ulation also had a higher mean number of organ dysfunctions compared with the PROWESS group. The patients in PROGRESS had higher observed mortality compared with those in PROWESS.
Predisposition. The classification and regression tree for the P component of PIRO incorporated age, CLD, and CC, and resulted in the following classification, from least to greatest risk of mortality: P0, patients younger than 46 years; P1, patients aged from 46 to 64 years, with no CLD; P2, patients aged from 64 to 85 years, with no CLD and no CC; P3, pa-tients aged from 46 to 64 years, with CLD, or patients aged from 64 to 85 years, with CC; and P4, patients aged from 64 to 85 years, with CLD, or patients older than 85 years. Increasing thresh-olds of “P” (P0, P1, P2, etc.) were associ-ated with an increase in the odds of mor-tality (see Table 3). The P score defined in this study guarantees similar intervals in the increase of the mortality rate from P0 to P4. Using P alone, the area under the curve to predict the in-hospital mortality rate was 65.1% for the PROWESS placebo patients and 58.7% to predict hospital mortality for the PROGRESS registry.
Insult/Infection. For both PROWESS and PROGRESS, if a specific aspect (e.g.,
Table 1. Variables considered for inclusion in the predisposition, insult/infection, response, and or-gan dysfunction model based on information available in PROWESS
Age Gender Ethnicity Tachycardia Tachypnea
Leukocytosis of leukopenia Thermodysregulation
No. of systemic inflammatory response syndrome criteria
Proven infection Source of infection Primary site of infection Infection type
Mean Acute Physiology and Chronic Health Evaluation II
Mean number of baseline organ dysfunctions Vasopressor requirement
Congestive heart failure Chronic renal insufficiency Chronic liver disease Diabetes
Mechanical ventilation Chronic lung disease Altered consciousness Active cancer Recent surgery
Table 2. Baseline characteristics for PROWESS and PROGRESS
Characteristic PROWESS (n⫽840) PROGRESS (n⫽10,610)
Mean age (yr)a
60.6⫾16.5 60.5⫾17.6
Male gender (%) 58.0 59.4
White (%) 82.0 43.8
Mean Acute Physiology and Chronic Health Evaluation IIa
25.0⫾7.8 23.3⫾8.3
Vasopressor requirement (%) 64.4 78.2
Mechanical ventilation (%) 77.6 84.9
Single-organ dysfunction (%) 24.2 18.4
Multiple organ dysfunction (%) 75.8 81.6
Mean number of baseline organ dysfunctionsa
2.4⫾1.1 2.7⫾1.2
Recent surgery (%) 30.6 37.5
In-hospital mortality (%) 34.9 49.6
lung) of infection information was un-known or missing, they were classified as “No.” We used a logistic regression in which “P” was used to predict survival, and then the “residuals” (the remaining variation not explained by “P”) were used rather than survival status alone. This
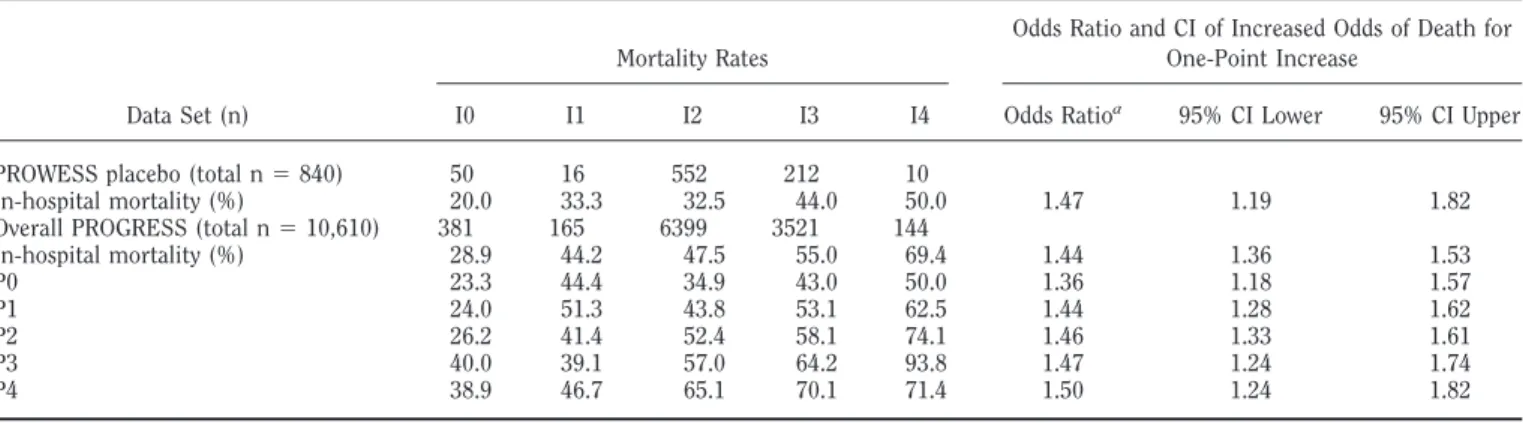
approach was designed to create trees in-dependent of “P.” The infection score based on an “I” adjusted for “P” resulted in the following classification: I0, com-munity-acquired urinary tract infections, Gram-negative stain negative; I1, com-munity-acquired urinary tract infections,
not Gram-negative stain negative; I2, community-acquired (except all urinary tract) or nosocomial Gram-negative stain positive; I3, nosocomial acquired (except Gram-negative stain positive) or nosoco-mial fungal nonabdominal infections; and I4, nosocomial abdominal fungal in-fections. Table 4 demonstrates mortality rates by I staging in both PROWESS and PROGRESS. Given the very large popula-tion in PROGRESS, we were able to re-port mortality rates in groups according to both P and I stage, for example, P2, I3. Inclusion of I increased the area under the curve from 65.1% for P alone to 67.1% in the PROWESS trial population and from 58.7% for P alone to 61.1% in the PROGRESS registry population.
This infection score is based on exist-ing databases. If the proposed score has to be used at the bedside, one would have to include “suspected site of infection.”
Response.The systemic inflammatory response syndrome criteria were not highly significant risk factors compared with other variables in the PROWESS da-tabase, and no regression tree was gener-ated. Based on the larger PROGRESS da-tabase, two levels of “R” were generated: R0, either no tachycardia or no pnea; R1, both tachycardia and
tachy-Table 3. Mortality in PROWESS and PROGRESS per P “predisposition” classification
Data Set (n)
Mortality Rates
Odds Ratio and CI of Increased Odds of Death for One-Point Increase
P0 P1 P2 P3 P4 Odds Ratio 95% CI Lower 95% CI Upper
PROWESS placebo (total n⫽840) 171 249 333 53 34
In-hospital mortality (%) 15.4 29.5 44.0 48.1 61.8 1.76 1.51 2.05 Overall PROGRESS (total n⫽10,610) 2293 2688 3709 1245 675
In-hospital mortality (%) 37.6 46.7 53.3 59.0 64.2 1.32 1.28 1.37
CI, confidence interval.
Table 4. Mortality for I “insult/infection” with stratification within levels of P within the PROGRESS registry
Data Set (n)
Mortality Rates
Odds Ratio and CI of Increased Odds of Death for One-Point Increase
I0 I1 I2 I3 I4 Odds Ratioa 95% CI Lower 95% CI Upper
PROWESS placebo (total n⫽840) 50 16 552 212 10
In-hospital mortality (%) 20.0 33.3 32.5 44.0 50.0 1.47 1.19 1.82
Overall PROGRESS (total n⫽10,610) 381 165 6399 3521 144
In-hospital mortality (%) 28.9 44.2 47.5 55.0 69.4 1.44 1.36 1.53
P0 23.3 44.4 34.9 43.0 50.0 1.36 1.18 1.57
P1 24.0 51.3 43.8 53.1 62.5 1.44 1.28 1.62
P2 26.2 41.4 52.4 58.1 74.1 1.46 1.33 1.61
P3 40.0 39.1 57.0 64.2 93.8 1.47 1.24 1.74
P4 38.9 46.7 65.1 70.1 71.4 1.50 1.24 1.82
CI, confidence interval.
aOdds ratio based on logistic regression for an increase of one I level after adjusting for P.
Table 5. Mortality for R “response” with stratification within levels of P and I within the PROGRESS registry
Data Set (n)
Mortality Rates
Odds Ratio and CI of Increased Odds of Death for One-Point
Increase
R0 R1
Odds Ratioa
95% CI Lower
95% CI Upper
PROWESS placebo (total n⫽840) 31 809
In-hospital mortality (%) 35.5 34.8 1.02 0.47 2.25 Overall PROGRESS (total n⫽10,610) 2169 8441
In-hospital mortality (%) 41.1 51.8 1.60 1.45 1.76
P0 26.7 39.8 1.82 1.42 2.32
P1 37.3 48.9 1.61 1.32 1.96
P2 44.8 55.8 1.56 1.34 1.82
P3 50.2 61.4 1.58 1.20 2.07
P4 54.1 66.9 1.72 1.18 2.49
I0 22.6 31.2 1.56 0.92 2.64
I1 37.5 46.4 1.44 0.70 3.00
I2 39.9 49.5 1.47 1.30 1.67
I3 45.3 57.4 1.63 1.38 1.92
I4 73.7 68.8 0.79 0.27 2.34
CI, confidence interval.
pnea, as demonstrated in Table 7. R0 was a combination of two levels of the regres-sion tree because analyses indicated that nontachypnea patients did not differ sig-nificantly from tachypnea patients with-out tachycardia (p⫽0.20 after adjusting for P and I). Only patients with both tachypnea and tachycardia were at in-creased risk of death. Table 5 demon-strates the mortality rate by various P and I stages with R1 vs. R2. Although the PROWESS sample did not have signifi-cance associated with an increased risk of
death based on R1 vs. RO, the observation that the odds ratio was 1.42 (95% CI: 0.60 –3.37) was consistent with the larger PROGRESS database. The odds ratio and the width of the confidence interval indi-cate that PROWESS may not have suffi-cient sample size to assess R, but given the numerical consistency with PROGRESS and the validation within PROGRESS of the finding, the two R levels add value. Inclusion of R yielded an AUC of 67.1% in the PROWESS trial population (no change from P and I alone), whereas, the
PROGRESS registry population increased from 61.1% for P and I alone to 62.2% with the inclusion of R.
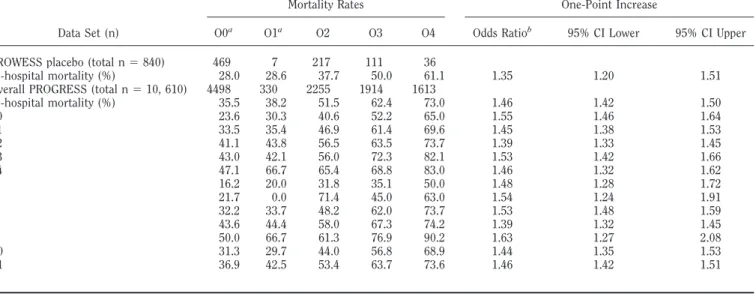
Organ Dysfunction.We formulated an “O” based on using number of organ ures (0 – 6) and each individual organ fail-ure (hepatic, cardiovascular, respiratory, hematologic, renal, and metabolic acido-sis). The classification was based on the residual tree from PROGRESS using the residuals from a logistic regression using “P,” “I,” and “R.” The organ failure score based on an “O” adjusted for “P,” “I,” and
Table 6. Mortality for O “organ dysfunction” with stratification within levels of P, I, and R within the PROGRESS registry
Data Set (n)
Mortality Rates
Odds Ratio and CI of Increased Odds of Death for One-Point Increase
O0a O1a
O2 O3 O4 Odds Ratiob
95% CI Lower 95% CI Upper
PROWESS placebo (total n⫽840) 469 7 217 111 36
In-hospital mortality (%) 28.0 28.6 37.7 50.0 61.1 1.35 1.20 1.51 Overall PROGRESS (total n⫽10, 610) 4498 330 2255 1914 1613
In-hospital mortality (%) 35.5 38.2 51.5 62.4 73.0 1.46 1.42 1.50
P0 23.6 30.3 40.6 52.2 65.0 1.55 1.46 1.64
P1 33.5 35.4 46.9 61.4 69.6 1.45 1.38 1.53
P2 41.1 43.8 56.5 63.5 73.7 1.39 1.33 1.45
P3 43.0 42.1 56.0 72.3 82.1 1.53 1.42 1.66
P4 47.1 66.7 65.4 68.8 83.0 1.46 1.32 1.62
I0 16.2 20.0 31.8 35.1 50.0 1.48 1.28 1.72
I1 21.7 0.0 71.4 45.0 63.0 1.54 1.24 1.91
I2 32.2 33.7 48.2 62.0 73.7 1.53 1.48 1.59
I3 43.6 44.4 58.0 67.3 74.2 1.39 1.32 1.45
I4 50.0 66.7 61.3 76.9 90.2 1.63 1.27 2.08
R0 31.3 29.7 44.0 56.8 68.9 1.44 1.35 1.53
R1 36.9 42.5 53.4 63.7 73.6 1.46 1.42 1.51
CI, confidence interval. a
Significance level between O0 and O1 for PROGRESS study is atp⫽0.151;b
Odds ratio based on logistic regression for an increase of one O level after adjusting for P, I, and R.
Table 7. Multivariate logistic regression to assess risk associated with each of the PIRO components
Domain
Stratification Level
0 1 2 3 4
Predisposition P0 P1 P2 P3 P4
Age⬍46 yrs Age 46–64 yrs, no CLD
Age 64–85 yrs, no CLD and no congestive cardiomyopathy
Age 46–64 yrs with CLD or 64–85 yrs with congestive cardiomyopathy
Age 64–85 yrs with CLD or age⬎85 yrs
Insult/infection I0 I1 I2 I3 I4
CA-UTI Gram-negative
CA-UTI not Gram-negative
CA infection except CA-UTI or nosocomial Gram-positive
Nosocomial acquired infection except Gram-positive or nosocomial fungal nonabdominal infection
Nosocomial abdominal fungal infection
Response R0 R1
No tachycardia and/or no tachypnea
Both tachycardia and tachypnea
Organ dysfunction O0 O1 O2 O3 O4
2 OF 3 OF, 1 hepatic 3 OF, none hepatic 4 OF 5 OF
“O” was as follows: O0, two or fewer or-gan failures; O1, three oror-gan failures, one of which is hepatic failure; O2, three or-gan failures, excluding hepatic failure; O3, four organ failures; and O4, five or more organ failures. The relationship with the O stage and mortality is demon-strated in Table 6. Among the PROGRESS population, these groups of two or fewer organ failures and three organ failures
(one of which is hepatic) were only a trend of significance (p⫽0.15), although the results were consistent within two ran-domly selected populations of PROGRESS. However, PROWESS mortality rates for O0 were numerically greater than O1, indicat-ing a lack of consistency.
Inclusion of O increased the AUC from 67.1% for P, I, and R alone, to 70.0% in the PROWESS trial population. By
com-parison, APACHE II had an AUC of 68.6% within the PROWESS placebo group. When APACHE II is added to PIRO for PROWESS, only the AUC increased to 73.7%. The PROGRESS registry popula-tion increased from 62.2% for P, I, and R alone to 69.6% with the inclusion of O.
Composite. Table 7 summarizes the PIRO domains with each respective strat-ification level. The risk associated with each of the PIRO components was as-sessed in both of the datasets (Table 8). For the PROWESS placebo database, all individual components except R have a significant increase in odds ratio for mor-tality in logistic regression after adjust-ment for an earlier variable for PIRO, and as noted, because of the observed odds ratio and width of confidence interval, this may be due to underpowered sample sizes of PROWESS to detect “R” effects. The Hosmer-Lemeshow tests for PROWESS (p⫽0.33) indicate that the model using P, I, R, and O has a good fit of the data across all patients, from high to low risk of death. In the PROGRESS dataset, all PIRO components were significant (p⬍
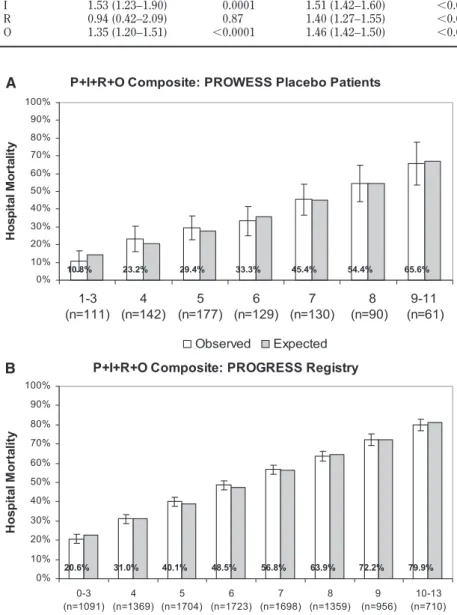
0.0001). Generally, all of the components were similar in their increase in risk of death for every one-point increase (odds ratios range from 1.3 to 1.5 for one level increases). A nonsignificant Hosmer-Lemeshow test (p⫽0.45) indicated that the model had a good fit of the data across all patients, from high to low risk of death. Comparing odds ratios allows one to assess the relative contributions of changes in each component. Because, generally, all of the components were similar in their increase in risk of death for every one point increase, we per-formed an analysis of mortality by com-posite PIRO score with a minimum of 0 and a maximum of 13. Figure 1,AandB
demonstrate the in-hospital mortality by composite PIRO score from PROWESS and PROGRESS, respectively. In PROWESS, the correlation of the PIRO total score and in-hospital mortality rates was 0.974 (p ⬍ 0.0001), and in PROGRESS, the correlation of the PIRO total score and hospital mortality rates was 0.998 (p ⬍
0.0001).
DISCUSSION
There is enormous heterogeneity in the patient population suffering from se-vere sepsis. Many risk stratification mod-els have been developed for sepsis, yet a recent study demonstrated that in the first 24 hours of intensive care unit ad-P+I+R+O Composite: PROWESS Placebo Patients
10.8% 23.2% 29.4% 33.3% 45.4% 54.4% 65.6%
0% 10% 20% 30% 40% 50% 60% 70% 80% 90% 100%
1-3 (n=111)
4 (n=142)
5 (n=177)
6 (n=129)
7 (n=130)
8 (n=90)
9-11 (n=61)
H
o
sp
it
al
M
o
rt
al
it
y
Observed Expected P+I+R+O Composite: PROGRESS Registry
20.6% 31.0% 40.1% 48.5% 56.8% 63.9% 72.2% 79.9%
0% 10% 20% 30% 40% 50% 60% 70% 80% 90% 100%
0-3 (n=1091)
4 (n=1369)
5 (n=1704)
6 (n=1723)
7 (n=1698)
8 (n=1359)
9 (n=956)
10-13 (n=710)
H
o
sp
it
al
M
o
rt
al
it
y
Observed Expected
A
B
Figure 1.A, Hospital mortality and 95% confidence intervals by composite predisposition, insult/ infection, response, and organ dysfunction (PIRO) stage in PROWESS placebo patients, and expected mortality rates based on the Hosmer-Lemeshow test. B, Hospital mortality and 95% confidence intervals by composite PIRO stage in PROGRESS patients, and expected mortality rates based on the Hosmer-Lemeshow test.
Table 8. Multivariate logistic regression to assess risk associated with each of the PIRO components
Component
PROWESS PROGRESS
Odds Ratio (95% CI) p Odds Ratio (95% CI) p
mission physicians predicted mortality more accurately than scoring systems (13). However, the authors also found that the accuracy of the physician’s prog-nostication was only moderate, which underscores the need for better tools for risk assessment in both clinical practice and clinical trial stratification. Many studies have demonstrated that intensive care unit scoring systems are better at predicting outcome of populations than individual patients (14). There are several organ dysfunction scoring systems, but none of these scoring systems is exclusive for patients with sepsis syndrome.
We have demonstrated that each com-ponent of PIRO contributes to the overall risk of death in this model with an in-crease in odds of death of approximately 30% to 50% for each increase in one level per individual PIRO component, even af-ter adjustment for other components. As demonstrated in Figure 1, A and B, the composite PIRO score accurately pre-dicted mortality over a broad range of scores in both the PROWESS and PROGRESS databases. How could the PIRO score be used in both clinical trials and patient care? We envision potentially using this novel model in a way similar to how the TNM staging system is used in clinical oncology. The model also allows researchers and clinicians to speak a common language, which facilitates communication that allows us to put pa-tients with similar prognosis and treat-ment in the same staging group. Given the heterogeneity of this patient popula-tion as well as the providers that care for them, we believe these types of efforts to improve our taxonomy are crucial. Addi-tionally, treatment guidelines rely on proper staging of disease to optimize care for an individual patient. For example, a patient with a T1N0M0 lung cancer will have very different treatment options than a patient with a T3, N3, M1 tumor classification. The PIRO staging system potentially could be used for risk stratifi-cation in a severe sepsis clinical trial, which is aiming to enroll patients at a high risk of death who are not moribund. As an example, a patient with a composite PIRO score of 6 or greater could be part of a trial’s inclusion criteria. In addition, as the PIRO score undergoes further re-finement, we could envision that a pa-tient with a P1, I2, R1, O2 vs. a papa-tient staged at P4, I3, R1, O4 would be pre-scribed different treatments for severe sepsis. Clinicians are always searching for additional tools to help with risk
stratification for clinical trials, with an appropriate use of intensive care unit resources, and to assist with family dis-cussions.
How does PIRO compare with other commonly used tools to predict outcome from severe sepsis? In this study, the area under the curve analysis for PIRO in the validation cohort was 0.696. In the recent publication of the global sepsis registry PROGRESS, multiple severity scores (APACHE II, APACHE III, Sequential Or-gan Failure Assessment, SAPS II, and MODS) were assessed and demonstrated area under the curves ranging from 0.6 to 0.7 (11). In our opinion, the PIRO staging system is less laborious than the APACHE II score, which has been demonstrated to have significant problems with reproduc-ibility when applied to individual patients (15). Thus, although PIRO does not seem superior to other scoring systems in pre-dicting mortality, it performs in a com-parable fashion despite the fact that this is the first version of this model. Histor-ically, outcome models have been re-viewed and revised over time resulting in improved discrimination (16).
To our knowledge, we are the first to generate a PIRO model from a large se-vere sepsis database and subsequently validate this model in a large global sepsis database. Moreno (17) describes an anal-ysis of 2628 patients from the SAPS III multinational cohort database and re-ported a partial PIRO covering only P, I, and R developed from a subset of the SAPS III database. As it stands, their model is different from our’s as it uses organ dysfunction/failure as “R” rather than providing distinct “R” and “O” scales. They categorized variables from the SAPS model into three of the four domains of the PIRO model—predisposi-tion, injury, and response—and evaluated the impact of each of these on patient stratification. The article reports the re-sults of these analyses, broken down by diagnostic category of sepsis (sepsis, se-vere sepsis, septic shock, and infection alone). This is a laudable effort to try to explore the utility of the PIRO model using the SAPS database, but our study has a much larger pool of patients diag-nosed with severe sepsis (11,500 vs. 1,099). We have used classification trees to optimize the ability to place patients in distinct groups that maximize risk differ-ences. For example, rather than deter-mining age cut-offs heuristically before or after a logistic regression, classifica-tion and regression tree determines age
cut-points that maximize differences of mortality risk. Also, we believe the se-quential creation of components that count for the mortality risk not ac-counted by the preceding components to be a novel approach to independent risk factors that contain no significant pair-wise interactions.
A major strength of our study is that we were able to generate a PIRO model in one sepsis dataset and subsequently vali-date the model in a larger, more diverse dataset. The large PROWESS and PROGRESS databases had detailed data collection performed, which is ideal for generating such models. Another strength of this study is the nature of PROGRESS, a global sepsis registry in-volving 37 countries, which increases the spreading of the PIRO model in this study. We are pleased by the general con-sistency of the PIRO classes across both datasets, and the potential that the sys-tem can be applied to multiple mortality measures and patient populations. Al-though there are several variables that would be beneficial to include in the fu-ture, PROWESS and PROGRESS pro-vided comprehensive information from more than 10,000 patients. The ability to compare PIRO to multiple other prognos-tic scores in PROGRESS is also a unique strength. There are important limitations in this study. First, we did not have suf-ficient genomic data to incorporate it into the model, which might have improved the prognostic ability of the P component. Sec-ond, the R variable only included the stan-dard systemic inflammatory response syn-drome criteria, whereas other signs or biomarkers could have significantly im-proved the R variable. Future sepsis studies should focus on collecting additional bi-omarkers to help expand the R variable. For a statistical analysis such as this, there are many approaches that could be used. The regression tree approach was our choice because it inherently gives rules to classify patients rather than merely stating which risk factors are significant. Of course, the score has been developed retrospectively and prospective use at the bedside, in real time, may be different (for instance, in as-sessing source and type of infection).
be used as a prospectively defined sub-group analysis outcome variable for fu-ture clinical trials. Third, as this model is reviewed and refined over time, we antic-ipate that this severe sepsis staging sys-tem could be used like the TNM syssys-tem to determine prognosis and individual treat-ment recommendations for an individual patient suffering from severe sepsis. Fi-nally, this score could even be used as a triage tool or as a tool to assist with end-of-life discussion.
In conclusion, our evaluation of the utility of the PIRO model for risk assess-ment in patient with severe sepsis shows that each variable contributes to outcome prediction with a 30% to 50% increase in odds of death. We repeat that this should be seen as a preliminary, hypothesis-generating version of the model. Subse-quent studies will be needed to test the clinical efficacy and further refine the PIRO scoring system in the diagnosis and risk assessment of severe sepsis.
REFERENCES
1. Martin GS, Mannino DM, Eaton S, et al: The epidemiology of sepsis in the United States from 1979 through 2000.N Engl J Med2003; 348:1546 –1554
2. Martin GS, Mannino DM, Moss M: The effect
of age on the development and outcome of adult sepsis.Crit Care Med2006; 34:15–21 3. Bone RC, Balk RA, Cerra FB, et al: American
College of Chest Physicians/Society of Criti-cal Care Medicine Consensus Conference. Definitions for sepsis and organ failure and guidelines for the use of innovative therapies in sepsis.Chest1992; 101:1644 –1655 4. Knaus WA, Draper EA, Wagner DP, et al:
APACHE II: A severity of disease classifica-tion system. Crit Care Med 1985; 13: 818 – 829
5. Knaus W, Wagner D, Draper E: APACHE III study design: Analytic plan for evaluation of severity and outcome in intensive care unit patients. Implications.Crit Care Med1989; 17(Suppl 2): S219 –S221
6. Vincent JL, De Mendonca A, Cantraine F, et al: Use of the SOFA score to assess the inci-dence of organ dysfunction/failure in inten-sive care units: Results of a multicenter, pro-spective study. Working group on “sepsis-related problems” of the European Society of Intensive Care Medicine.Crit Care Med1998; 26:1793–1800
7. Marshall JC, Cook DJ, Christou NV, et al: Multiple organ dysfunction score: A reliable descriptor of a complex clinical outcome.关see comment兴.关Review兴Crit Care Med1995; 23: 1638 –1652
8. Le Gall JR, Lemeshow S, Saulnier F: A new Simplified Acute Physiology Score (SAPS II) based on a European/North American multi-center study.关erratum appears inJAMA1994; 271:1321兴.JAMA1993; 270:2957–2963
9. Levy MM, Fink MP, Marshall JC, et al: 2001 SCCM/ESICM/ACCP/ATS/SIS International sepsis definitions conference.Crit Care Med 2003; 31:1250 –1256
10. Bernard GR, Vincent JL, Laterre PF, et al: Efficacy and safety of recombinant human activated protein C for severe sepsis.N Engl J Med2001; 344:699 –709
11. Beale R, Reinhart K, Brunkhorst F, et al: PROGRESS (Promoting Global Research Ex-cellence in Severe Sepsis): Lessons from an International Sepsis Registry.Infectionin press 12. Breiman L. Classification and Regression Trees.New York, Kluwer Academic Publish-ers, 1984.
13. Sinuff T, Adhikari NK, Cook DJ, et al: Mor-tality predictions in the intensive care unit: Comparing physicians with scoring systems. Crit Care Med2006; 34:878 – 885
14. Skrobik Y, Kavanagh BP: Scoring systems for the critically ill: Use, misuse and abuse.Can J Anesth2006; 53:432– 436
15. Booth FV, Short M, Shorr AF, et al: Applica-tion of a populaApplica-tion-based severity scoring system to individual patients results in fre-quent misclassification. Crit Care 2005; 9:R522–R529
16. Le Gall JR, Neumann A, Hemery F, et al: Mortality prediction using SAPS II: An up-date for French intensive care units. Crit Care2005; 9:R645–R652