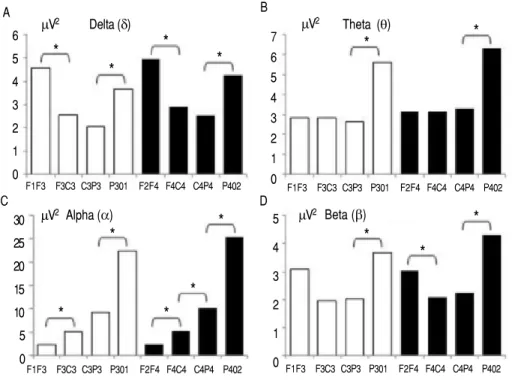
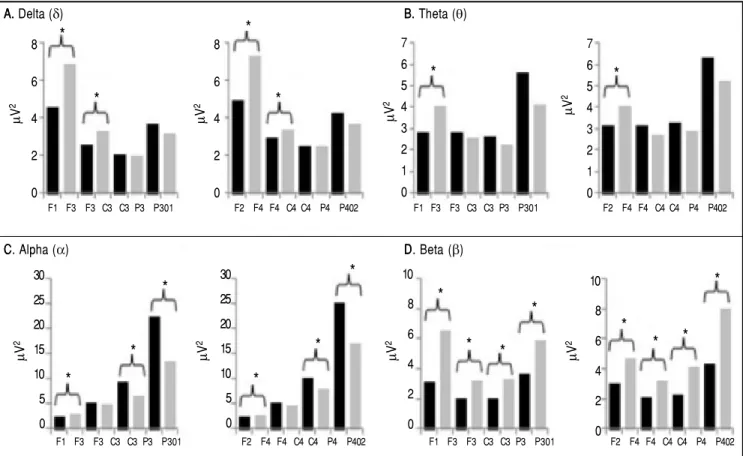
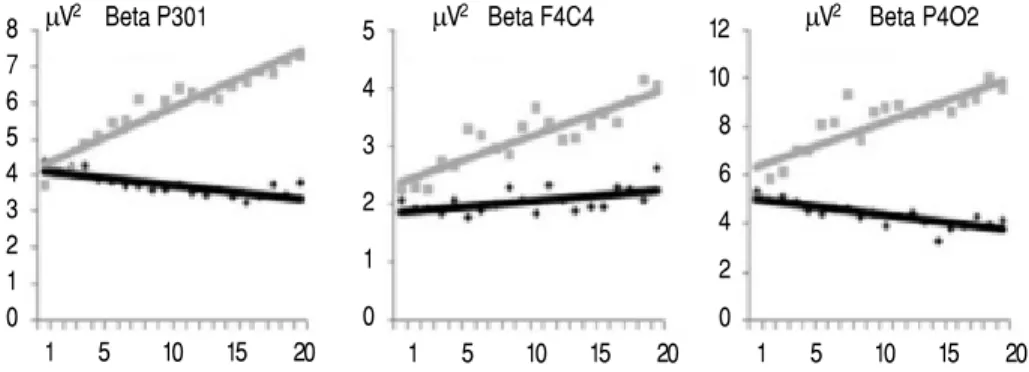
Desincronizacin/sincronizacin de ritmos EEG parasagitales en la habituacin a la fotoestimulacin en adultos
Texto completo
Figure


Documento similar
The host star peak intensity (blue line), the companion intensity (green line), the inverse of the averaged intensity in an area surrounding the central peak (red line) and
Factors of the length of the rack, L, and mean d discharge coefficient, C qH , for different slopes, void ratios, and longitudinal slopes are presented for the design of the
Ripley’s synthetic training set with the Bayes border (solid line) and the class borders computed with lear1NN for 2 (dotted line), 6 (dashed line) and 32 (dashdot line)
The expansionary monetary policy measures have had a negative impact on net interest margins both via the reduction in interest rates and –less powerfully- the flattening of the
Jointly estimate this entry game with several outcome equations (fees/rates, credit limits) for bank accounts, credit cards and lines of credit. Use simulation methods to
(a) Angular velocity as a function of the applied laser power and power density for a bare upconverting NaYF 4 :Er 3+ ,Yb 3+ microspinner (black line and hexagons) and for a
There is a tight correlation (lower black line) between [O i] line emission and 63 μm continuum flux for non-outflow sources (sources with less than 3σ detection in line or
- El problema ABP lo obtenían en Moodle (bajándose el correspondiente archivo pdf depositado en el foro del grupo) y sabían cómo tenían que trabajar en las fechas