A capillary zone electrophoresis for determination of
thiolic peptides in biological samples
Mónica Pérez-Rama, Julio Abalde, Concepción Herrero, Cristina
Suárez, Enrique Torres
Laboratorio de Microbiología, Facultad de Ciencias, Universidade da Coruña, A
Coruña, Spain
Journal of Separation Science, Volume 32, Issue 12, June 2009, Pages 2152–2158 First published: 22 June 2009, Accepted: 2 April 2009, Received: 16 February 2009
This is the peer reviewed version of the following article:
Pérez-Rama, M., Abalde, J., Herrero, C., Suárez, C. and Torres, E. (2009), A
capillary zone electrophoresis for determination of thiolic peptides in biological
samples. J. Sep. Science, 32: 2152–2158. doi:10.1002/jssc.200900104
which has been published in final form at http://dx.doi.org/10.1002/jssc.200900104 .
This article may be used for non-commercial purposes in accordance with Wiley Terms
and Conditions for Self-Archiving.
Abstract
A new method to improve the analyses of thiolic peptides (cysteine, γGlu-Cys, glutathione, phytochelatins and desglycyl-phytochelatins) derivatized with
monobromobimane (mBrB) in complex biological samples by CZE is described. The
method involves a SPE using Sep-Pak Light C18 Cartridges after derivatization and a
later CZE analysis. Elution of mBrB-thiols was achieved with 10 mM HCl + 70%
methanol v/v in deionised water. Electrophoretic parameters, such as BGE pH and
concentration, different organic additives (methanol and trifluoroethanol), applied
voltage and capillary length were studied in order to establish suitable analytical
mM sodium borate buffer at pH 7.60. The electrophoretic conditions were +15 kV, capillary length of 90 cm from inlet to detector (98 cm total length, 50 μm ID), samples were loaded into the capillary by hydrodynamic injection (50 mbar, 20 s) and detection
was performed at 390 nm. The improved method showed good reproducibility, linearity
and sensitivity. The LODs and LOQs estimated using a standard of GSH were 1.41 and 4.69 μM respectively.
Keywords:
Capillary zone electrophoresis / Cysteine / Glutathione / Phytochelatins / Thiols
Sulphur (S) is an essential macronutrient. It is taken up as sulphate by autotrophic organisms and it is assimilated into cysteine (Cys), an amino acid at the cross roads of
primary metabolism, protein synthesis and the formation of low molecular weight
sulphur-containing defence compounds (glutathione (GSH) (γ-Glu-Cys-Gly),
phytochelatins, various secondary metabolites and other sulphur-rich polypeptides).
Sulphur-containing defence compounds are crucial for the survival of organisms under
biotic and abiotic stress [1].
The most important/critical low molecular weight biological thiols are GSH and Cys.
Cys is synthesized in the final step of the sulphate reduction pathway by the enzyme
Cys synthase and it is incorporated into sulphurrich proteins and GSH. The amount of
GSH in a given organism is the result of the combined action of biosynthesis,
consumption and degradation. GSH protects the cytosol and other cellular compartments against reactive oxygen species, which accumulate in response to biotic
and abiotic stress. In the ascorbate–GSH cycle, the function of GSH is linked to that of
ascorbic acid and electron flow from NADPH. Moreover, GSH also operates as a
component in GSH S-transferase (GST)-based detoxification mechanisms. Finally, in
fungi, plants and algae, under heavy-metal exposure, GSH is the precursor of
phytochelatins, Cys-rich peptides synthesized via phytochelatin synthase [2], which
have an important role in the mechanisms of metal detoxification [3]. Also, desglycyl
phytochelatins (desGly-PCn, also known as d-PCn) with n γ-Glu-Cys subunits
(γ-Glu-Cys)n, PCs lacking terminal amino acid Gly, are involved in the tolerance mechanisms
to metals. Qualitative and quantitative analyses of PCs and desGly-PCs provide useful
information about how organisms respond to metals in the environment.
Several methods for analysis of thiols, in different biological matrices, have been
RP HPLC and it is still in use for their detection and quantification [4–6]. The
derivatization with a specific chromogenic or fluorogenic compound provides better
selectivity in the detection process. Monobromobimane (mBrB)
(3,7-dimethyl-4-brommethyl-6-methyl-1,5-diazabicyclo-[3.3.0]-octa-3,6-dien-2,8-dion) is a fluorogenic
compound commonly used because it reacts with several low molecular weight thiols
[7, 8]. CE has proven being a good alternative to HPLC. Several CE methods have been
reported for the determination of GSH, Cys or other thiols in biological samples [9–12].
However, few works of CE include the simultaneous separation of all these peptides
(Cys, GSH, phytochelatins and desGly-PCs) in the same run.
The proposal of this study is the development of a method that allows analyzing
different thiolic peptides in biological samples, in the same CE run. For this purpose, selective and accurate analytical methods are obviously required, because of the
complex matrix of this type of samples. A clean-up of the sample, with SPE, before
analyses was used to remove matrix ions which otherwise caused electrophoretic
de-stacking. This step also allowed a preconcentration and acidification of the sample.
With those conditions, separation buffer and electrophoretic parameters were considered
to obtain an adequate resolution and separation efficiency of peaks in
electropherograms.
The biological material chosen for the development of this procedure was the marine
microalga TetraseµMis suecica because the extracts obtained from this organism are
very complex and previous works showed that TetraseµMis produces a notable quantity of different thiol compounds (included phytochelatins and desGly-PCs) when it is
exposed to cadmium [13].
The method developed offers an attractive approach for the analysis of thiols. Due to
its simplicity and reliability, the developed procedure was convenient for routine
analyses of biologically significant thiolic peptides in complex matrix.
Materials and methods
Chemicals and reagents
All chemicals used were of the highest purity available. Boric acid (H3BO3),
hydrochloric acid (HCl), sodium hydroxide (NaOH), mBrB (C10H11N2O2Br),
cient_fica s.l., Madrid, Spain). HPLCgrade methanol was purchased from Scharlau
(Scharlau Chemie, S.A., Barcelona, Spain). NC filters were obtained from Millipore
(Millipore Ib_rica, Madrid, Spain). C18 SPE columns (Sep-Pak Light C18 Cartridges)
were obtained from Waters (Waters Corporation, USA).
The different reagents and buffers were prepared with water obtained from a Milli-Q
system.
Electrophoretic system
All the electrophoretic experiments were performed in an HP3DCE CE System
(Agilent Technologies, Waldbronn, Germany) equipped with a photodiode array
detector. The detection was set at a wavelength of 390 nm. All system control, data collection, processing and analyses were performed using the Agilent ChemStation
Software (Agilent Technologies, Waldbronn, Germany).
Electrophoresis procedure
A 70, 80 and 90 cm effective length (78, 88 and 98 cm total length respectively), 50
µm ID and 375 µm OD uncoated fused silica capillaries (Composite Metal Services
Ltd., UK Block) were used for the method. The temperature of the cassette containing
the capillary was maintained at 25ºC with an air coolant control system.
Borate buffer with different pHs and concentrations was used as BGE for the
separation. The pH of boric acid was adjusted with 1 M NaOH to obtain electrolytes
with pHs from 7.1 to 7.8.
In all cases, the pH was measured in a 720A+ Thermo pH meter (Thermo Electron
Corporation, England). After the pH adjustments, the volume of the solution was
adjusted to obtain final sodium borate concentrations of 25, 50, 75, 100 and 125 mM,
each one with the range of pHs assayed.
Different concentrations of methanol or trifluoroethanol from 2.5 to 10% v/v,
dissolved in the BGE and used as organic modifiers, were also assayed.
All buffers were passed through a 0.22 µm NC filter and degassed before use.
Prior to the runs, the capillary was rinsed with 0.1 M NaOH solution followed by
deionised water under a 50 mbar internal pressure, each for 3 min. Finally, it was
conditioned with the BGE. The protocol for each sample run consisted of a 5 min
prerinse with BGE followed by sample injection. Samples were loaded into the anodic
The power supply was operated in the constant-voltage mode at +15 kV. All
electrophoretic separations were carried out at least in triplicate. Number of theoretical
plates and resolution was calculated by software.
Linearity in a graphic of current versus voltage applied to the selected BGE (Ohm's
law plot) was used to select the suitable voltage that could be utilized for the developed
procedure. Different voltages (1–30 kV) were applied to the finally selected BGE and
the current was registered. A graphical representation with these two parameters was
performed. The maximum voltage was indicated by the point at which nonlinearity
occurs.
Biological samples
Biological samples of a marine microalga were used to develop this procedure. The
marine microalga T. suecica (Kylin) Butch was cultured in natural seawater enriched
with inorganic nutrients without EDTA and Tris [14]. Cultures were grown in glass
bottles (PYREX) with natural sterile air at a flow rate of 10 L/min. They were
maintained at 18 ± 1ºC and 68 (Einstein/m2/s, with a dark/light cycle of 12:12 h. Initial
cell density was 25x104 cells/mL.
Cadmium was the metal used for the induction of phytochelatins. The marine
microalga was exposed to 8 mg/L of this metal, added to the culture medium as CdCl2.
After 7 days of culture, cells exposed to cadmium were collected by centrifugation
(12000 x g for 10 min). Samples were stored at –20ºC until analyses.
Extraction and derivatization of low-molecularmassthiol compounds in biological samples using mBrB
The derivatization procedure was adapted from Pérez-Rama et al. [15]. Frozen
samples were resuspended in an appropriate volume of 0.1 M HCl. Cells were
homogenized with an ultrasonic cell disrupter for 3 min at 150 W and 14 µm amplitude.
Unbroken cells and cell debris were removed by centrifugation at 12000 x g for 15
min at 4ºC. The supernatant was collected and 500 µL was added to 500 µL of a
derivatization buffer freshly prepared. This buffer was composed of 1 M sodium borate
buffer (pH 9), 1 mM DTPA and 1.5 mg/L of NaBH4.
Once the sample was mixed with the buffer, 8 µL of 0.1 M mBrB dissolved in ACN
h in darkness. Samples were centrifuged at 12000 x g for 10 min at 4ºC. The
supernatant was then concentrated and purified by means of SPE using Sep-Pak Light
C18 cartridges. The column was activated with methanol and then rinsed with 10 mL of
10 mMHCl plus 0.5% v/v methanol in deionised water. Samples of 2 ml were
introduced in the column and washed with 2 ml of the rinsed solution. Finally, the
mBrB-thiol compounds were eluted using 10 mM HCl plus 70% methanol v/v in
deionised water. Using this procedure, the samples were acidified and it was not
necessary to filter or centrifugate prior to injection into the CE system. 600 µL of the
sample was transferred to CZE vials for injection.
Standards of Cys, γ-Glu-Cys, GSH, phytochelatins and desGly-PCs derivatized in the
same way, compared to biological samples, were used to identify the different peaks.
Method validation
To determine linearity, a regression line was calculated using GSH. A standard
calibration graph was obtained for GSH in order to do a quantitative analyses of the
different mBrB-thiolic peptides. The graph was constructed using GSH standards at
concentration ranges from 7.5 to 100 µM, derivatized and processed as the biological
samples, and finally analyzed by the CE procedure developed. The analyses was
performed in triplicate for each concentration. The peak area obtained was plotted
against the corresponding concentration of GSH (µM) and the regression equation (y = a + bx, where x was GSH concentration and y was the peak area) was determined by the least-squares method. LODs and LOQs were estimated in accordance with IUPAC.
A within-run precision for the method was obtained by injecting the same biological
sample six times consecutively to the EC system and six times on different days to
obtain the inter-day precision. Cys was taken as the reference peak (marker) to calculate
the relative migration time (RMT) of other thiol compounds.
Accuracy was evaluated by means of recovery assays using the standard addition
method. Two different standard analytes (Cys and GSH) were added to microalgal
extracts before sample pre-treatment, in which the concentration of these analytes had
already been determined. Three increasing known quantities (7.5, 40 and 100 µM) of
these standards were added to three aliquots of microalgal extract. Following the
procedure, the percentage of recovery rate was established from the response values
In this way, the total concentration of the standard was calculated after analyses and
the percentage of recovery of added analyte was calculated by means of the equation:
Recovery (%) = (100 x total concentration measured (original concentration in
sample))/added concentration.
Student's t-test was applied to determine if the recovery was satisfactory.
Results and discussion
In the present study, a SPE column (Sep-Pak Light C18 cartridge) was used to
concentrate, acidify and clean up the sample to remove the matrix interferences. The
thiol compounds were eluted from the SPE column using a buffer containing 10 mM
HCl plus 70% methanol. One of the simple and practical methods to perform stacking is dissolving the sample in organic solvents and injecting a large volume of sample on the
capillary. This leads to concentration of the sample 10–30 folds directly on the capillary
(stacking) [16, 17]. The elution of the sample with a solvent containing methanol
allowed to decrease the LOD and to reduce band broadening to obtain sharper peaks.
The replacement to an acidic medium has the additional advantage of stabilizing the
thiols, allowing preserving the sample for more time before the analyses.
Buffer electrolyte and electrophoretic parameters were considered to obtain an
adequate resolution and separation efficiency of peaks in electropherograms, taking the
conditions of the sample into account. In this case, a basic BGE was selected to achieve
an online electrophoretic preconcentration through sample stacking [18].
Phosphate buffer, although it is one of the most commonly used BGEs, within neutral and weak alkaline pH, may deteriorate the analytical results when analyzing
mobile anions [19]. Tris/HCl and carbonate buffer have also been used as basic BGE to
obtain an optimum separation and identification of PCs and GSH [20, 21]. However,
borate buffer has been used to analyze not only PCs and GSH but also other thiols as
Cys and γ-Glu-Cys [22–24].
Moreover, borate buffer in the neutral to slightly basic range has been found useful
as a starting buffer for small molecules, peptides and proteins. For these reasons borate
Effect of pH and concentration of the BGE on the separation
The pH and concentration of the BGE are among the most important parameters in a
CE separation. The running buffer pH plays a key role in CE by modifying the EOF and
overall charges of the analytes (especially in the case of peptides or amino acids), both
of which affect the effective mobility and separation efficiency. The effect of running
buffer concentration was studied by preparing buffers containing sodium borate
concentrations of 25, 50, 75, 100 and 125 mM. All the concentrations evaluated were
assayed by varying the BGE pH within the 7.1–7.8 range.
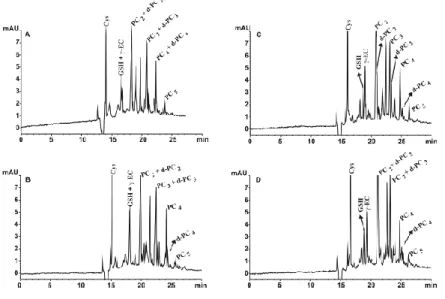
Figure 1 shows the effect of different pHs had in the separation, in buffers containing
sodium borate concentrations of 100 mM. As can be seen in the figure, pH influenced
the separation of the peaks significantly. As pH increased from 7.1 to 7.6, the separation
improved.
Although the PCs with different chain length were well separated in all the pHs
assayed, PCs co-migrated with their respective desGly-PCs and only when the pH was
7.6 the separation among them was achieved. With pHs higher than 7.6, desGly-PCs
co-migrated with PCs again.
The values of RMT showed only slight variations as pH increased which
demonstrates that the increase in this narrow range of pH has little effect in the
charge/mass ratio of the PCs. However, this increase had enough magnitude to allow the
separation of desGly-PCs from PCs with only one amino acid of difference.
In CE the concentration of the electrolyte buffer can be adjusted to enhance the
preferable because capillary walls–analytes interactions are suppressed and sample
stacking effects are facilitated. However, Joule heating must be carefully controlled.
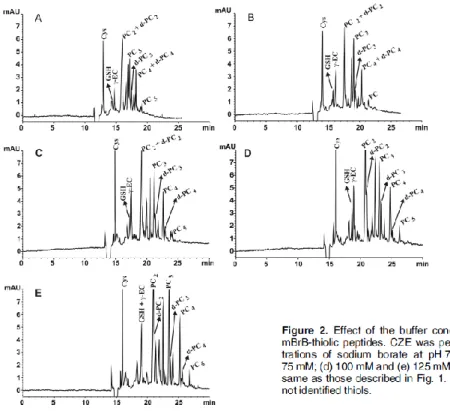
Figure 2 shows the sodium borate concentration effect at the pH with the best results
in the separation. The increase in the sodium borate buffer concentration from 25 to 100
mM showed an increase in the separation efficiencies with a noticeable change in the
height of the peaks but with the concentration of 125 mM the resolution of some
peptides get worse. In this way, desGly-PC3 and PC3 can be distinguished in all sodium
borate concentrations at pH 7.6 except with the highest concentration; however, the rest
of the PCs peaks needed a concentration higher than 50 mM to reach a satisfactory
separation from their respective desGly-PCs the concentration of 100 mM being the
optimum. Low concentrations (25 and 50 mM) and pH higher than 7.3 enabled the
separation of the small thiol peptides GSH and γ-Glu-Cys but if the concentration of sodium borate is increased to 75 and 100 mM, an optimal separation is also reached at
pH 7.6. The results indicate that the RMT increased slightly from 25 to 125 mM. This
increase was higher than with the pH changes, moreover, the total time of the
electropherogram increased substantially due to the decrease in the EOF and the
electrophoretic separation of the analytes was better with the exception of the
concentration of 125 mM (Fig. 2).
Considering the results obtained with the different assayed electrolytes, a sodium
borate concentration of 100 mM and a pH 7.6 was selected as the most suitable for the
peptide. Only desGly-PC2 was not suitably separated from PC2 due to the amount of
PC2 which was too high to achieve the separation.
Effect of organic additives
In order to determine the influence of organic solvents, methanol and trifluoroethanol
was added to the BGE composed by sodium borate 100 mMand pH 7.6. Because of
their amino acid composition similarities, the relative electrophoretic separation of this
set of related mBrBpeptides should not be significantly influenced by the addition of an
organic solvent. In fact, the addition of these modifiers produced a decrease in
conductivity and the resolution only improved slightly with some peaks, but with most of them got worse. Also, migration time increased considerably both with methanol and
trifluoroethanol.
For these reasons, organic modifiers were omitted in the BGE, since they did not
contribute to improve the analyses.
Effect of applied voltage and capillary length
The Ohm's law plot was used for the determination of the maximum voltage that can
be utilized with the BGE chosen. Linearity in the graphical representation of current
versus voltage applied (R2 = 0.998, graphic not shown) was kept in the whole range of
voltages assayed. With this condition, the maximum voltage (+30 kV) would not be
expected to be problematic and for this reason it was tested to obtain maximum
efficiency and to reduce the analysis time. The total time of the electropherogram was lower and peaks were sharper but GSH and γ-Glu-Cys as well as PCs and desGly-PCs
were not well separated. Because of this, voltage was reduced to obtain a compromise
between analytical time and resolution.
Otherwise, the use of a shorter capillary also means a shorter analysis time. Initial
separations were performed in a capillary of 90 cm length from inlet to detector. When
the capillary was shortened to 70 and 80 cm, the migration time decreased reducing the
separation time; however, with these lengths the resolution also decreased considerably. γ-Glu-Cys peak overlapped with GSH peak and desGly-PCs were not separated (electropherograms not shown).
Considering these results, a capillary with an effective length of 90 cm combined
Method validation
The validation of the method was carried out using the optimized conditions. The
optimal conditions obtained for separating the thiolic peptides derivatized with mBrB
and dissolved in 10 mM HCl + 0.5% v/v methanol were as follows: 100 mM sodium
borate at pH 7.60, effective length of 90 cm x 50 µMID (98 cm total length) uncoated
fused silica capillary, pressure injection of 50 mbar for 20 s, applied voltage of +15 kV
and detection wavelength of 390 nm.
Figure 1C and 2D show a typical electropherogram with the separation of the
different mBrB-thiolic peptides by the procedure developed.
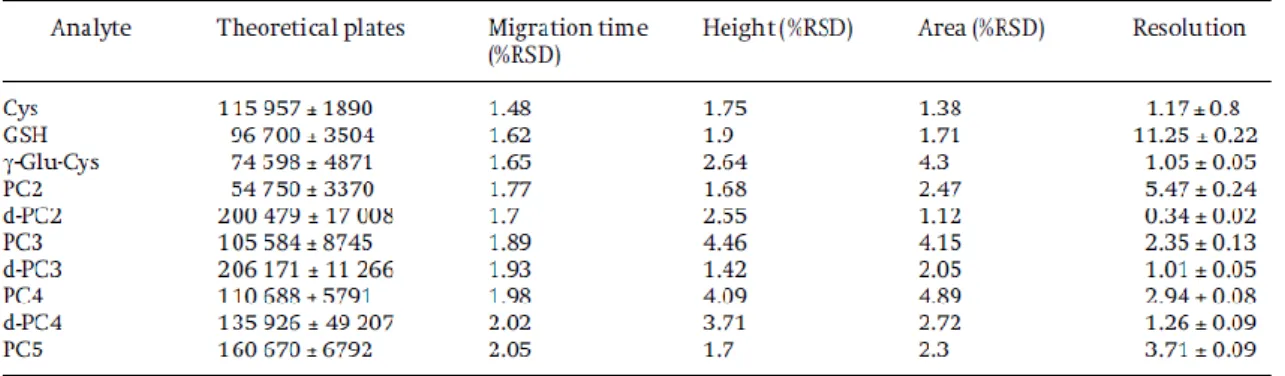
Reproducibility of the migration times of analytes is an important factor in the
evaluation of a CE method. The reproducibility of migration time and peak height of the derivatized thiolic peptides under the optimal conditions were tested by repeated
injection (n = 6) sequentially in a single day to obtain the within-run precision. The RSD of the migration times and the peak height obtained for the within-run precision is
shown in Table 1. The values of RSD% in the migration times obtained for the different
peptides identified in the electropherograms ranged from 1.48 to 2.05%. The inter-day
precision was obtained by injecting the same biological sample six times on different
days. The values of RSD% for the migration times and for the height obtained for the
different peptides identified in the electropherograms ranged from 1.55 to 2.57% and
from 1.11 to 4.9% respectively. The RSD values of the peak areas of these compounds
for the within-run and inter-day precision were less than 6% in both cases. These results
mean a satisfactory analytical precision indicating a good reproducibility of the method.
The number of theoretical plates is a useful measure of the capillary performance. In
most of the peaks the number of plates obtained was higher than 100 000 (Table 1). The
greatest enhancement of separation efficiency was obtained for desGly-PC3 with more
than 205000 theoretical plates per metre. The worst efficiency was obtained for PC2 due
to the greater quantity of this phytochelatin in the sample. In comparison with [15], the
efficiencies, demonstrating that the separation is better. Also, with the present method,
the values obtained in the resolution were suitable to separate themBrB-peptides.
The recovery efficiency was evaluated for Cys and GSH. Recovery was very high for
both thiol compounds reaching average values of 91.3 and 99.8% respectively, with
coefficients of variation (%) of 2.1 and 1.5. Student's t-test to each set of concentrations
showed no significant differences in the recovery percentages.
Six-point calibration plot was established by analyzing GSH standard solutions. Six
different concentrations that range from 7.5 to 100 µM were used in order to do a
quantitative analyses of the different thiolic peptides.
With detection at 390 nm, a good linearity between peak area and concentration can be observed in this range of concentrations, with correlation coefficient R2 = 0.9991, the
equation obtained being y = 0.4313x –0.35. The LODs and LOQs estimated were 1.41 and 4.69 µM respectively with hydrodynamic injection of 20 s at 50 mbar. These
quantities mean an additional improvement in relation to LOD and LOQ obtained in
[15] with values of 2.8 and 9.59 µM, respectively.
Concluding remarks
The results of this study show an adequate procedure for the analyses of thiolic
peptides derivatized with mBrB. A CZE method to determine the presence and
concentration of low-molecular-mass thiols in complex matrix of biological samples
was developed with borate buffer 100 mM pH 7.6 being selected as a suitable
electrolyte. The method reported has several advantages. One of the most worthwhile advantages is the simultaneous determination of several low-molecular-mass thiols:
Cys, γ-Glu-Cys, GSH, phytochelatins and desGly-PCs. The precision, accuracy,
sensitivity and linearity were determined in a set of validation experiments that indicate
that the method possesses high selectivity and accuracy. It should be highlighted that
recovery efficiency was 91 and 100% for Cys and GSH respectively. The LODs and
LOQs were 1.41 and 4.69 µM respectively.
Therefore, the CZE method described here was demonstrated to be a suitable
procedure for the simultaneous determination of different thiol compounds in complex
biological samples.
References
[1] Rausch, T., Wachter, A., Trends Plant Sci. 2005, 10, 503 – 509.
[2] Noctor, G., Arisi, A. C. M., Jouanin, L., Kunert, K. L., Rennenberg, H., Foyer, C. H.,
J. Exp. Bot. 1998, 49, 623 – 647.
[3] Cobbett, C., Goldsbrough, P., Annu. Rev. Plant Biol. 2002, 53, 159 – 182.
[4] Figueroa, J. A. L., Afton, S., Wrobel, K., Caruso, J. A., J. Anal. At. Spectrom. 2007, 22, 897 – 904.
[5] Thangavel, P., Long, S., Minocha, R., Plant Cell Tissue Organ Cult. 2007, 88, 201 – 216.
[6] Srivastava, S., Mishra, S., Tripathi, R. D., Dwivedi, S., Trivedi, P. K., Tandon, P. K.,
Environ. Sci. Technol. 2007, 41, 2930 – 2936.
[7] Newton, G. L., Dorian, R., Fahey, R. C., Anal. Biochem. 1981, 114, 383 – 387.
[8] Minchinton, A. I., Int. J. Radiat. Oncol. Biol. Phys. 1984, 10, 1503 – 1506.
[9] Imaizumi, Y., Yamashiro, T., Arikawa, Y., Anal. Sci. 2001, 17, i1325 – i1327.
[10] Chassaing, C., Gonin, J., Wilcox, C. S., Wainer, I. W., J. Chromatogr. B Biomed. Sci. Appl. 1999, 735, 219 – 227.
[11] Mendoza, J., Soto, P., Ahumada, I., Garrido, T., Electrophoresis 2004, 25, 890 – 896.
[12] Tanaka, Y., Higashi, T., Rakwal, R., Wakida, S., Iwahashi, H., J. Pharm. Biomed. Anal. 2007, 44, 608 – 613.
[13] Pérez-Rama, M., Torres, E., Abalde, J., Environ. Toxicol. Chem. 2006, 25, 128 – 136.
[14] Fábregas, J., Abalde, J., Herrero, C., Cabezas, B., Veiga, M., Aquaculture 1984, 42, 207 – 215.
[15] Pérez-Rama, M., Torres, E., Abalde, J., Electrophoresis 2005, 26, 610 – 620.
[16] Shihabi, Z. K., Curr. Pharm. Anal. 2006, 2, 9 – 15.
[17] Shihabi, Z. K., Electrophoresis 2002, 23, 1612 – 1617.
[18] Monton, M. R., Imami, K., Nakanishi, M., Kim, J. B., Terabe, S., J. Chromatogr. A
2005, 1079, 266 – 273.
[19] Gebauer, P., Pantuikova, P., Bocek, P., J. Chromatogr. A 2000, 894, 89 – 93.
[20] Musenga, A., Mandrioli, R., Bonifazi, P., Kenndler, E., Pompei, A., Raggi, M. A.,
[21] Sutter, K., Friebe, S., Krauss, G. J., Int. J. Environ. Anal. Chem. 1999, 74, 167 – 178.
[22] Kubota, H., Sato, K., Yamada, T., Maitani, T., J. Chromatogr. A 1998, 803, 315 – 320.
[23] Bayle, C., Issac, C., Salvayre, R., Couderc, F., Causse, E., J. Chromatogr. A 2002, 979, 255 – 260.