(1) Instituto Nacional de Salud Pública de México. Cuernavaca, Morelos, México.
Received on: May 17, 2012 • Accepted on: February 1, 2013
Corresponding author: M en C Fabiola Mejía Rodríguez. Av. Universidad 655, col. Santa María Ahuacatitlán. 62100 Cuernavaca, Morelos, México.
E-mail: fmejia@insp.mx
Iron, zinc, copper and magnesium deficiencies
in Mexican adults from the National Health
and Nutrition Survey 2006
Fabiola Mejía-Rodríguez, MSc,(1) Teresa Shamah-Levy, MSc, PhD,(1) Salvador Villalpando, MD, PhD,(1)
Armando García-Guerra, MSc,(1) Ignacio Méndez-Gómez Humarán, MSc, PhD.(1)
Mejía-Rodríguez F, Shamah-Levy T, Villalpando S, García-Guerra A, Méndez-Gómez Humarán I. Iron, zinc, copper and magnesium deficiencies in Mexican adults from the National Health and Nutrition Survey 2006. Salud Publica Mex 2013;55:275-284.
Abstract
Objective. To describe the prevalence of serum iron and zinc deficiencies and low serum concentrations (LSC) of copper and magnesium in Mexican adults. Materials and methods. Blood samples from subjects (≥20 years, both genders) participating in the 2006 National Health and Nutrition Survey were used to measure the serum concen-trations of s-ferritin, soluble-transferrin-receptor (s-TfR), zinc, copper, and magnesium. Results. The prevalence of s-ferritin≤12ug/L was 18.1 and 3.6% while s-TfR>6mg/L was 9.5 and 4.4%, for females and males, respectively. The prevalence of zinc deficiency was 33.8% females and 42.6% males; LSC of copper were 16.8 and 18.2%, and 36.3 and 31.0% for magnesium, for females and males, respectively. Conclusions. The prevalence of deficiencies in iron (in females), and zinc are still high in the adult population. LSC of copper and magnesium are published for the first time and show significant prevalence of deficiencies. Corrective actions are necessary in order to diminish these nutritional deficits in the Mexican population.
Key words: Minerals; iron; zinc; copper; magnesium; Mexico
Mejía-Rodríguez F, Shamah-Levy T, Villalpando S, García-Guerra A, Méndez-Gómez Humarán I. Deficiencias de hierro, zinc, cobre y magnesio en adultos mexicanos. Encuesta Nacional de Salud y Nutrición 2006.
Salud Publica Mex 2013;55:275-284.
Resumen
Objetivo. Describir la prevalencia de deficiencias de hierro y zinc y valores bajos (VB) de cobre y magnesio en adultos mexicanos. Material y métodos. Se utilizaron muestras de sangre de individuos (≥20 años, ambos sexos) de la Encuesta Nacional de Salud y Nutrición 2006 para medir concentra-ciones séricas de s-ferritina, receptor soluble de transferrina (s-TfR), zinc, cobre y magnesio. Resultados. La prevalencia de s-ferritina≤12ug/L fue de 18.1 y 3.6%, s-TfR>6mg/L de 9.5 y 4.4% para mujeres y hombres, respectivamente. Para zinc fue de 33.8% mujeres y 42.6% hombres. Para VB de cobre fue 16.8 y 18.2%; y magnesio 36.3 y 31.0% en mujeres y hombres, respectivamente. Conclusiones. Las prevalen-cias de deficiencia de hierro (mujeres) y zinc aún son altas en la población adulta. VB de cobre y magnesio se publican por primera vez en una muestra representativa de adultos y muestran prevalencias importantes. Son necesarias medidas correctivas para combatir estos problemas en la población mexicana.
D
eficiency of micronutrients such as iron, iodine, and vitamin A, are globally the most frequent. Some reports estimate that more than two thousand million persons suffer from these nutritional deficien -cies worldwide.1,2,3Iron deficiency during pregnancy is linked to in -creased maternal morbidity and mortality.4 Women of childbearing age from middle- and low-income coun -tries are prone to iron deficiency anemia.5 Low serum
concentrations (LSC) of copper are linked to a decreased activity of some metalloenzymes6 reducing iron ions to facilitate its absorption and transport.7 It has also been
associated with a decreased immune response,8 osteopo -rosis, hypercholesterolemia, and glucose intolerance.9-11
In adult males, a zinc to copper ratio >1 is associated with decreased immune response and higher mortal -ity in HIV positive individuals.12 LSC of magnesium is
less common, but it produces hypokalemia; a condition affecting the electrolyte equilibrium of the body.13-15
In developing countries, micronutrient deficiencies frequently coexist with inflammation and infection, impeding the interpretation of iron and zinc deficiencies. C-reactive protein or alpha 1-acid glycoprotein should be measured simultaneously to avoid confounding ef -fects of inflammation.16,17
In Mexico, information about mineral deficiencies in adults from probabilistic surveys is limited to the prevalence of iron and zinc deficiencies in women of childbearing age, reported in the 1999 Mexican National Nutrition Survey (ENN 99)18 which found a prevalence of iron and zinc deficiencies, of 40 and 30% respec -tively.19 Reports from other countries found a LSC of copper of 17 and 8.6% in Iranian females and males,11 respectively, and 5.9% in Chilean females.20
Information on the national prevalence of these deficiencies is required in order to consider redesign of ongoing or new interventions to accelerate the reduction of micronutrient deficiencies. The aim of this study is to describe the magnitude and distribution of iron and zinc deficiencies, and LSC of copper and magnesium and the inflammation status using protein C reactive (PCR) in Mexican adults.
Materials and methods
Population and methods
Data for the present analysis were from a sample of 30% of male and female adults who were older than 20 years, participating in the 2006 Mexican National Health and Nutrition Survey (ENSANUT 2006); with available measurements of the serum concentrations of s-ferritin, soluble transferrin receptor (s-TfR), zinc,
copper, magnesium and C reactive protein (PCR). The power of the subsample allowed for distinctions at the national and regional level. Pregnant womenand those with no biochemical determinations were excluded from the analysis. The final number of subjects was 3 421 female and 1 989 males.
Survey design
ENSANUT 2006 is a Mexican nationwide survey rep -resentative of both rural and urban areas from four regions of the country. The study used a stratified cluster sample design.21
Blood sample collection, preparation and storage
Fasting blood samples were drawn from an antecubital vein and centrifuged; serum was separated, stored in cryovials kept in liquid nitrogen, and transported to the nutrition laboratory at INSP in Cuernavaca, Mexico.22
Methods for determination of micronutrients
S-Ferritin, soluble transferrin receptor, and C-reactive protein
Iron levels were approximated using measures of s-ferritin and soluble transferrin receptor (s-TfR). The deficiency of body iron stores was defined as s-ferritin ≤12ug/L and tissue iron deficiency as by s-TfR concen -trations >6mg/L.23 Serum concentrations of C-reactive
protein (PCR) were measured by nephelometry using an ultrasensitive, monoclonal antibody and the manu -facturer protocol was followed.
Determinations of serum iron, zinc, copper, and magne-sium concentrations
Measurements of serum iron, zinc, copper, and mag -nesium concentrations were measured using an induc -tively coupled plasma optical emission spectrometer, following the procedure described by Tietz et al.24 Zinc
deficiency was defined as serum zinc <70ug/dL in fe -males and < 74ug/dL in -males,25 LSC of serum copper
<70ug/dL in men and <80ug/dL in women,26 and LSC
of serum magnesium <1.823mg/dL (<0.75 mmol/L).26
The controls for measurements are expressed as fol -lows: mean±SD (coefficient of variation=%). S-ferritin 74.6±3.67mg/L, (c.v.=4.4%); s-TfR 2.32±0.13mg/L,
dL, (c.v.=5.6%) and magnesium 1564±27.2mg/dL (c.v.=11.7%).
Anemia
Anemia was defined as hemoglobin concentration <120 g/L in non-pregnant women and <130 g/L in men23,
adjusting for altitude above sea level, as by Cohen and Haas.27 Iron deficiency anemia (IDA) was defined when
an abnormal Hb value coexisted with at least one iron status indicator below the cut-off values, s-ferritin ≤ 12 ug/L or s-TfR >6 mg/L.28 Both venous and capillary
blood was obtained from each subject.
Dietary intake of micronutrients
Dietary intakes data collection have been described in detail elsewhere.29 Inadequate intake was defined
when it was below the cutoff of Estimated Average Requirement (EAR). For iron intake was <16 mg/day and copper <0.7mg/day; zinc <11mg/day (females) and <12mg/day (males) and magnesium <280mg/day (fe -males) and <215mg/day (-males).30 We did not consider
bioavailability in the assessment of mineral intake.
Definition of variables
Demographic and socioeconomic information was col -lected using ad hoc questionnaires.18 Selected variables including age, sex, body mass index (BMI),31 indigenous
status (any member spoke an indigenous language), socioeconomic status (SES, index was constructed using a principal components analysis),32 area and region of
residence, and affiliation to food assistance programs such as Oportunidades and the milk distribution pro -gram Liconsa.
Statistical analysis
Distribution of variables was described using means, medians, frequencies or proportions stratified by sex. Prevalence of mineral deficiencies or LSC and 95% confidence intervals were calculated.33 Multiple logistic
regression models were constructed to test whether prevalence of iron deficiency anemia, IDA or prevalence of zinc deficiency changed with inflammation (PCR>6 mg/L), adjusting for age group, sex and interaction sex-age group. Other logistic regression models were constructed to estimate predictors of the prevalence of the following micronutrient deficiencies or LSCs (in females): iron, zinc, copper and magnesium, adjusting for affiliation to food assistance programs, age, SES, micronutrient dietary intake, enhancers and inhibitors
of mineral bioavailability, and excluding cases with PCR concentration >6 mg/L.
All analyses were adjusted for the study design, considering the Primary Sample Unit (PSU), the strata defined for the survey, and their corresponding cali -brated weights. Analyses were done using Stata Versión 12 (StataCorp. 2011 Stata Statistical Software: Release 12. College Station, Tx: Stata Corp LP).
Ethical aspects
The study protocol was approved by the Ethics, Biosecu -rity, and Research Boards of the National Institute of Pub -lic Health (INSP), Cuernavaca, Mexico. Anthropometric measurements and blood samples were obtained after participants had signed an informed consent letter.
Results
This analysis included 3 421 non-pregnant females and 1 989 males who represented about 59 million people older than 20 years. About 70% of the sample (sexes combined) was overweight or obese. Females (44.8%) and males (37.6%) had 6 years and (15.8 and 28.3%) had more than 12 years of schooling. Only 8.8% of females and 6% of males (6%) spoke an indigenous language, while 26.2 and 20.6% lived in rural areas (table I).
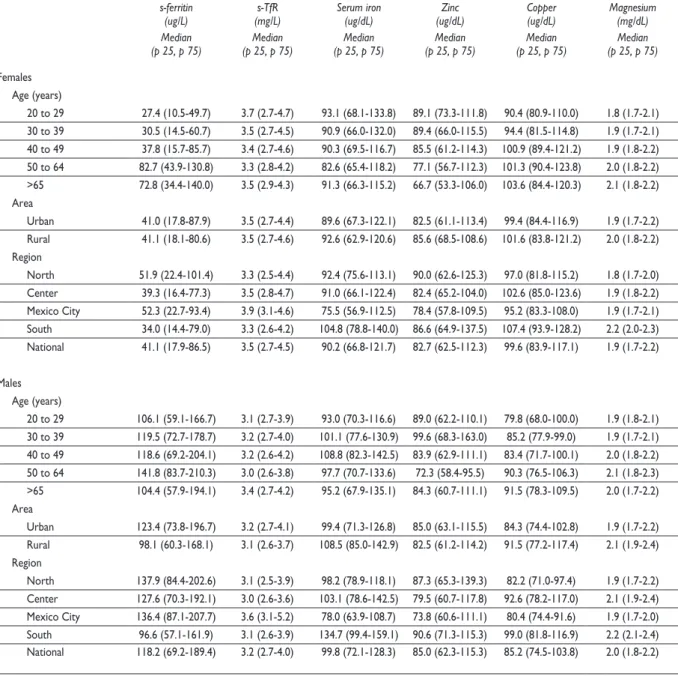
In table II are shown the medians and interquartile ranges (p25, p75) for serum concentrations of s-ferritin, s-TfR, iron, zinc, copper, and magnesium.
Iron nutritional status
The prevalence of iron deficiency (table III) based on s-ferritin was lower in males (2-7%) than in females in all age groups. It was higher in females aged 20 to 50 years (19.3-26.9%) and decreased to a half in older than 50 years (8.0-9.4%). The prevalence was 2-fold higher in the South region (21.6%) compared with Mexico City (12.1%), (table III). The prevalence of tissue iron defi -ciency as determined by high concentrations of s-TfR was higher in female aged 20-49 years (9.6-13.5%) than in those older than 50 years (4.8-5.1%). It was higher in the Center region (11.4%) compared with Mexico City (9.6%), (table III). The prevalence of tissue iron deficiency were similar in males by age group and by urban or rural area of residence, although it was higher in Mexico City (12.2%) compared with other regions (1.3-2.8%). No differences were found when control -ling for PCR.
Table I
CharaCteristiCsofthepopulation. MexiCo, ensanut 2006
Characteristics
Females Males
Estimated N
(thousands) mean (95% CI)
Estimated N
(thousands) mean (95% CI)
Weight (kg) 34 151.8 66.1 (65.1-66.8) 23 573.2 75.3 (74.0-76.7)
Height (cm) 33 763.5 151.9 (151.5-152.4) 23 470.8 165.9 (165.1-166.7)
PCR (mg/L) 33 976.4 4.8 (4.5-5.1) 23 415.2 3.4 (3.0-3.8)
Vitamin C (dietary, mg) 33 496.5 102.1 (96.3-108.1) 23 261.5 100.3 (92.2-108.4)
n
Expanded
n
Expanded Estimated N
(thousands) (%) Estimated N(thousands) (%)
Age (years)
20 to 29 722 7 934.7 23.2 398 5 296.7 22.5
30 to 39 1 062 8 911.0 26.1 472 5 430.4 23.0
40 to 49 737 7 394.8 21.7 401 4 465.8 18.9
50 to 64 538 5 741.1 16.8 430 5 115.7 21.7
>65 362 4 170.2 12.2 288 3 264.6 13.9
PCR
<6 mg/L 2 511 25 671.4 75.6 1 691 20 307.3 86.8
≥6 mg/L 889 8 309.4 24.4 285 3 095.0 13.2
BMI (kg/m2)
<18.5 36 457.1 1.4 29 251.1 1.1
18.5-24.9 857 8 587.7 25.5 619 7 664.3 32.8
25-29.9 1 240 12 922.4 38.3 854 10 276.7 44.0
>30 1 251 11 737.7 34.8 472 5 178.0 22.2
Socioeconomic status
Low 1 469 12 228.7 35.6 857 7 677.2 32.6
Middle 1 231 11 714.3 34.5 631 7 226.5 30.7
High 709 10 063.6 29.6 497 8 633.3 36.7
Schooling (years)
None 431 4 936.6 14.5 224 2 164.5 9.2
6 1 668 15 258.7 44.8 866 8 827.6 37.6
9 898 8 528.6 25.0 455 5 811.6 24.8
12 263 3 018.3 8.9 235 2 845.8 12.1
> 16 154 2 333.4 6.9 201 3 802.0 16.2
Literacy
Literate 2 958 29 280.2 86.0 1 773 21 490.5 91.5
Illiterate 458 4 770.6 14.0 214 2 005.9 8.5
Indigenous status
Indigenous 378 2 987.7 8.8 185 1 423.2 6.0
Non-indigenous 3 041 31 148.5 91.3 1 803 22 148.7 94.0
Area
Urban 2 276 25 198.6 73.8 1 390 18 718.0 79.4
Rural 1 145 8 953.2 26.2 599 4 855.3 20.6
Region
North 576 5 630.8 16.4 409 4 300.2 18.2
Center 1 430 10 500.4 30.7 670 5 824.3 24.7
Mexico City 126 5 841.2 17.1 91 4 727.2 20.1
South 1 289 12 179.3 35.7 819 8 721.6 37.0
Food assistance program
Oportunidades 1 390 9 803.7 28.7 61 278.4 1.2
Table II
Medianandinterquartilerangeofs-ferritin, (s-tfr), iron, zinC, CopperandMagnesiuM. MexiCo, ensanut 2006
s-ferritin
(ug/L) (mg/L)s-TfR Serum iron(ug/dL) (ug/dL)Zinc Copper(ug/dL) Magnesium(mg/dL) Median
(p 25, p 75) (p 25, p 75)Median (p 25, p 75)Median (p 25, p 75)Median (p 25, p 75)Median (p 25, p 75)Median
Females Age (years)
20 to 29 27.4 (10.5-49.7) 3.7 (2.7-4.7) 93.1 (68.1-133.8) 89.1 (73.3-111.8) 90.4 (80.9-110.0) 1.8 (1.7-2.1) 30 to 39 30.5 (14.5-60.7) 3.5 (2.7-4.5) 90.9 (66.0-132.0) 89.4 (66.0-115.5) 94.4 (81.5-114.8) 1.9 (1.7-2.1) 40 to 49 37.8 (15.7-85.7) 3.4 (2.7-4.6) 90.3 (69.5-116.7) 85.5 (61.2-114.3) 100.9 (89.4-121.2) 1.9 (1.8-2.2) 50 to 64 82.7 (43.9-130.8) 3.3 (2.8-4.2) 82.6 (65.4-118.2) 77.1 (56.7-112.3) 101.3 (90.4-123.8) 2.0 (1.8-2.2) >65 72.8 (34.4-140.0) 3.5 (2.9-4.3) 91.3 (66.3-115.2) 66.7 (53.3-106.0) 103.6 (84.4-120.3) 2.1 (1.8-2.2) Area
Urban 41.0 (17.8-87.9) 3.5 (2.7-4.4) 89.6 (67.3-122.1) 82.5 (61.1-113.4) 99.4 (84.4-116.9) 1.9 (1.7-2.2) Rural 41.1 (18.1-80.6) 3.5 (2.7-4.6) 92.6 (62.9-120.6) 85.6 (68.5-108.6) 101.6 (83.8-121.2) 2.0 (1.8-2.2) Region
North 51.9 (22.4-101.4) 3.3 (2.5-4.4) 92.4 (75.6-113.1) 90.0 (62.6-125.3) 97.0 (81.8-115.2) 1.8 (1.7-2.0) Center 39.3 (16.4-77.3) 3.5 (2.8-4.7) 91.0 (66.1-122.4) 82.4 (65.2-104.0) 102.6 (85.0-123.6) 1.9 (1.8-2.2) Mexico City 52.3 (22.7-93.4) 3.9 (3.1-4.6) 75.5 (56.9-112.5) 78.4 (57.8-109.5) 95.2 (83.3-108.0) 1.9 (1.7-2.1) South 34.0 (14.4-79.0) 3.3 (2.6-4.2) 104.8 (78.8-140.0) 86.6 (64.9-137.5) 107.4 (93.9-128.2) 2.2 (2.0-2.3) National 41.1 (17.9-86.5) 3.5 (2.7-4.5) 90.2 (66.8-121.7) 82.7 (62.5-112.3) 99.6 (83.9-117.1) 1.9 (1.7-2.2)
Males Age (years)
20 to 29 106.1 (59.1-166.7) 3.1 (2.7-3.9) 93.0 (70.3-116.6) 89.0 (62.2-110.1) 79.8 (68.0-100.0) 1.9 (1.8-2.1) 30 to 39 119.5 (72.7-178.7) 3.2 (2.7-4.0) 101.1 (77.6-130.9) 99.6 (68.3-163.0) 85.2 (77.9-99.0) 1.9 (1.7-2.1) 40 to 49 118.6 (69.2-204.1) 3.2 (2.6-4.2) 108.8 (82.3-142.5) 83.9 (62.9-111.1) 83.4 (71.7-100.1) 2.0 (1.8-2.2) 50 to 64 141.8 (83.7-210.3) 3.0 (2.6-3.8) 97.7 (70.7-133.6) 72.3 (58.4-95.5) 90.3 (76.5-106.3) 2.1 (1.8-2.3) >65 104.4 (57.9-194.1) 3.4 (2.7-4.2) 95.2 (67.9-135.1) 84.3 (60.7-111.1) 91.5 (78.3-109.5) 2.0 (1.7-2.2) Area
Urban 123.4 (73.8-196.7) 3.2 (2.7-4.1) 99.4 (71.3-126.8) 85.0 (63.1-115.5) 84.3 (74.4-102.8) 1.9 (1.7-2.2) Rural 98.1 (60.3-168.1) 3.1 (2.6-3.7) 108.5 (85.0-142.9) 82.5 (61.2-114.2) 91.5 (77.2-117.4) 2.1 (1.9-2.4) Region
North 137.9 (84.4-202.6) 3.1 (2.5-3.9) 98.2 (78.9-118.1) 87.3 (65.3-139.3) 82.2 (71.0-97.4) 1.9 (1.7-2.2) Center 127.6 (70.3-192.1) 3.0 (2.6-3.6) 103.1 (78.6-142.5) 79.5 (60.7-117.8) 92.6 (78.2-117.0) 2.1 (1.9-2.4) Mexico City 136.4 (87.1-207.7) 3.6 (3.1-5.2) 78.0 (63.9-108.7) 73.8 (60.6-111.1) 80.4 (74.4-91.6) 1.9 (1.7-2.0) South 96.6 (57.1-161.9) 3.1 (2.6-3.9) 134.7 (99.4-159.1) 90.6 (71.3-115.3) 99.0 (81.8-116.9) 2.2 (2.1-2.4) National 118.2 (69.2-189.4) 3.2 (2.7-4.0) 99.8 (72.1-128.3) 85.0 (62.3-115.3) 85.2 (74.5-103.8) 2.0 (1.8-2.2)
found when controlling for PCR in both males and females, although the prevalence was 12.8% without inflammation and 13.8% with inflammation in females; in males was 8.2% without inflammation and 5.7% with inflammation (data not shown).
The total prevalence of IDA was 28.5% in females and 10% in males. No differences were found when controlling for PCR in both males and females. IDA after adjusting by PCR, the prevalence was 26.8% without
A
r
t
íc
u
lo
o
r
ig
in
A
l
salud pública de méxico / vol. 55, no. 3, mayo-junio de 2013
Mejía-Rodríguez F y col.
anddefiCienCiesofzinC,§Copper,#andMagnesiuM&. MexiCo, ensanut 2006
s-ferritin s-TfR Zinc Copper Magnesium
n N Expanded n Expanded n Expanded n Expanded n Expanded
(Millions) % (95%CI)
N
(Millions) % (95%CI)
N
(Millions) % (95%CI)
N
(Millions) % (95%CI)
N
(Millions) % (95%CI)
Females
Age (years)
20 to 29 711 7.9 26.9 (21.5-32.4) 710 7.8 9.6 (6.1-13.0) 373 4.3 19.3 (12.5-26.1) 220 3.2 20.9 (10.3-31.4) 220 3.2 40.2 (29.0-51.3)
30 to 39 1 061 8.9 19.8 (15.7-23.9) 1 057 8.8 11.1 (8.1-14.1) 601 5.2 30.6 (23.6-37.7) 325 3.5 23.4 (12.4-34.3) 325 3.5 36.0 (24.8-47.1)
40 to 49 738 7.4 19.3 (15.4-23.2) 735 7.4 13.5 (10.0-17.0) 440 4.4 33.1 (25.2-41.1) 285 3.6 15.2 (7.1-23.3) 285 3.6 39.7 (30.4-49.0)
50 to 64 530 5.7 8.0 (4.7-11.4) 529 5.7 4.8 (1.2-8.4) 298 3.6 42.3 (32.8-51.7) 301 3.6 8.4 (3.6-13.2) 301 3.6 34.0 (24.2-43.7)
>65 359 4.1 9.4 (4.0-14.8) 359 4.2 5.1 (0.7-9.6) 220 2.9 51.7 (40.4-63.0) 221 2.9 16.8 (8.8-24.8) 221 2.9 31.2 (19.7-42.8)
Area
Urban 2 262 25.1 18.1 (15.6-20.6) 2 261 25.1 8.8 (6.9-10.6) 1 217 15.4 36.1 (30.5-41.7) 1 021 14.2 17.6 (13.3-21.8) 1 021 14.2 38.4 (32.8-44.0)
Rural 1 137 8.9 18.0 (14.1-21.9) 1 129 8.8 11.5 (8.0-15.0) 715 5.0 26.9 (19.5-34.2) 331 2.5 12.4 (5.6-19.2) 331 2.5 24.3 (15.3-33.3)
Region
North 566 5.6 16.0 (11.8-20.1) 567 5.6 9.4 (5.8-12.9) 405 4.1 30.9 (24.2-37.6) 405 4.1 24.3 (17.2-31.4) 405 4.1 47.4 (38.9-55.8)
Center 1 427 10.5 18.6 (14.4-22.7) 1 422 10.4 11.4 (8.6-14.2) 1 045 7.3 30.5 (24.1-36.9) 538 3.8 9.7 (5.4-14.0) 538 3.8 32.6 (23.9-41.4)
Mexico City 125 5.8 12.1 (6.5-17.7) 125 5.8 9.6 (4.2-14.9) 121 5.6 41.3 (28.4-54.2) 117 5.6 18.6 (10.2-27.1) 117 5.6 46.2 (35.2-57.3)
South 1 281 12.1 21.6 (18.6-24.5) 1 276 12.0 7.8 (5.5-10.2) 361 3.4 32.0 (23.9-40.2) 292 3.2 12.3 (4.8-19.8) 292 3.2 9.5 (5.9-13.1)
National 3 399 34.0 18.1 (16.0-20.2) 3 390 33.9 9.5 (7.8-11.1) 1 932 20.4 33.8 (29.2-38.5) 1 352 16.7 16.8 (13.0-20.6) 1 352 16.7 36.3 (31.3-41.3)
Males
Age (years)
20 to 29 397 5.3 3.7 (-0.1-7.5) 397 5.3 6.1 (1.1-11.1) 172 2.9 42.4 (28.5-56.3) 172 2.9 33.9 (19.9-47.9) 172 2.9 33.7 (21.3-46.0)
30 to 39 469 5.4 2.0 (0.6-3.4) 463 5.4 4.0 (1.0-6.9) 194 2.5 31.8 (19.1-44.5) 194 2.5 14.0 (5.9-22.1) 194 2.5 39.7 (20.7-58.7)
40 to 49 398 4.4 2.8 (0.6-5.1) 397 4.4 4.8 (1.4-8.2) 197 2.5 45.0 (32.5-57.5) 198 2.5 21.1 (11.1-31.0) 198 2.5 23.9 (15.0-32.8)
50 to 64 429 5.1 3.5 (1.2-5.8) 427 5.1 2.8 (0.3-5.2) 215 2.8 52.2 (41.9-62.5) 215 2.8 10.3 (4.4-16.3) 215 2.8 27.2 (18.0-36.3)
>65 286 3.2 7.0 (2.5-11.5) 283 3.2 4.0 (0.4-7.7) 146 2.0 39.9 (25.0-54.7) 146 2.0 7.7 (1.6-13.8) 146 2.0 30.4 (14.2-46.6)
Area
Urban 1 381 18.6 3.9 (2.3-5.5) 1 371 8.8 4.9 (2.9-6.9) 697 11.0 42.7 (35.8-49.5) 698 11.0 19.1 (13.5-24.6) 698 11.0 32.8 (24.5-41.0)
Rural 598 4.9 2.2 (1.0-3.3) 596 4.8 2.1 (0.9-3.3) 227 1.7 42.4 (24.5-60.4) 227 1.7 12.5 (5.4-19.5) 227 1.7 19.0 (11.9-26.0)
Region
North 404 4.2 2.5 (0.8-4.2) 402 4.2 1.3 (0.3-2.4) 298 3.0 40.4 (32.5-48.4) 299 3.0 24.2 (16.6-31.9) 299 3.0 39.3 (30.0-48.5)
Center 667 5.8 2.1 (0.7-3.5) 663 5.8 2.5 (1.2-3.9) 343 2.8 42.7 (29.2-56.3) 343 2.8 15.2 (6.2-24.2) 343 2.8 20.8 (13.6-28.0)
Mexico City 90 4.7 4.7 (-0.1-9.5) 90 4.7 12.2 (5.1-19.4) 87 4.6 51.1 (37.0-65.1) 87 4.6 20.5 (9.6-31.4) 87 4.6 45.0 (28.6-61.5)
South 818 8.7 4.4 (2.4-6.5) 812 8.7 2.8 (1.3-4.2) 196 2.4 29.0 (20.7-37.4) 196 2.4 9.5 (3.6-15.4) 196 2.4 5.1 (1.0-9.2)
National 1 979 23.4 3.6 (2.2-4.9) 1 967 23.3 4.4 (2.7-6.0) 924 12.7 42.6 (36.2-49.0) 925 12.7 18.2 (13.3-23.0) 925 12.7 31.0 (23.7-38.3)
* s-Ferritin deficiency <12 ug/L
‡ Soluble transferrin receptor (s-TfR) deficiency >6 mg/L § Zinc deficiency <65 ug/dL
iron below the EAR was 88.2% for females and 76.6% for males (data not shown).
In a multiple logistic regression model, high socio -economic status (OR=0.64, 95%CI: 0.42-0.97; p<0.05), older age (OR = 0.97, 95%CI: 0.96-0.99; p< 0.001), meat intake (OR=0.0997, 95CI%: 0.995-0.999; p<0.05) and the food assistance program Oportunidades (OR=0.73; 95CI%: 0.53-1.02; p=0.063) had a protective effect for the risk of iron deficiency by s-ferritin; no association was found with dietary iron, zinc, PCR, vitamin C, or phytates (data not shown).
Zinc nutritional status
The prevalence of zinc deficiency was higher in females >65 (51.7%) relative to the age group 20-29 years (19.3%). The prevalence was higher in urban females (36.1%) compared with their rural counterparts (26.9%), and in those living in Mexico City (41.3%) compared with the ones who lived in the Center region (30.5%), (table III). In males, the prevalence of zinc deficiency varied inconsis -tently by age group (31.8 to 52.2%). The prevalence was similar in rural (42.2%) and in urban (42.7%) males. The highest prevalence was seen in the Mexico City region (S1.1) and the lowest in the South region (29.0%), (table III). The prevalence of zinc deficiency did not change with PCR concentrations (p=0.551).
The median of the daily intake of zinc was below the EAR and the prevalence of inadequate consump -tion was 90.3% for females and 83.5% for males (data not shown). In a multiple logistic regression model age (OR= 1.03, 95%CI 1.01-1.04; p<0.001), males (OR= 1.43, 95%CI 0.99-2.07; p=0.059), and dietary fiber (OR= 1.03, 95%CI 0.999-1.000; p=0.053) increased the risk for zinc deficiency. No association was found with PCR con -centrations, dietary iron, zinc, vitamin C, phytates, or affiliation with Oportunidades or Liconsa food assistance programs (data not shown).
Copper and magnesium nutritional status
The prevalence of LSC of copper were lower in females (8.4-23.4%) compared with males (7.7-33.9%); the preva -lence for magnesium was higher in females (31.2-40.2%) than in males (23.9-39.7%). The prevalence of LSC of these two minerals was higher in urban compared with rural areas in both males and females. The highest preva -lence was seen in the North and Mexico City regions and the lowest in the South region (table III).
In a multiple logistic regression model with LSC of magnesium as dependent variable there were no signifi -cant predictors. In contrast, in the model having LSC of
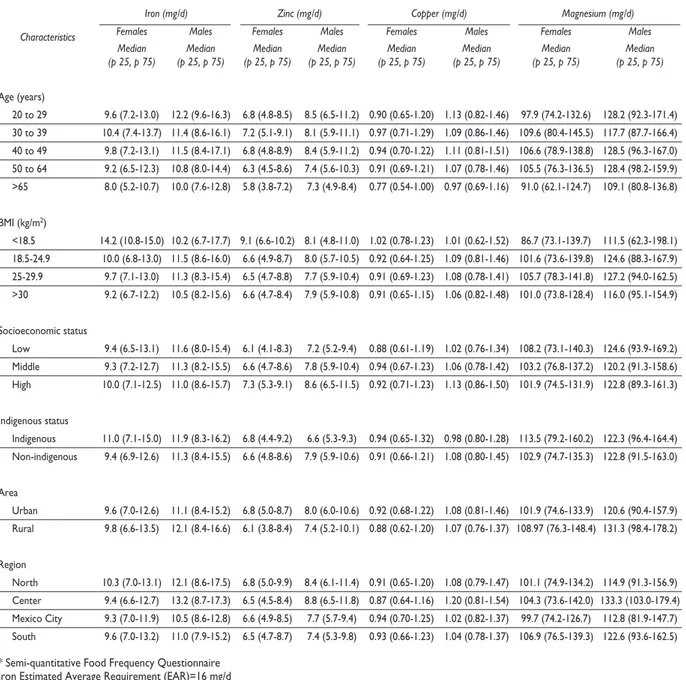
copper as dependent variable, only copper intake was protective (OR=0.15, 95%CI 0.03-0.80, p=0.03), data not shown. The median of copper dietary intake was 0.9-0.97 mg/day in both genders. The median of magnesium intake in female was 91-106 mg/day and in male 109-128 mg/day (table IV). Prevalence for daily intake of copper below the EAR was 28.6% for female and 15.9% for males. For magnesium the prevalence was 64.2% for female and 25.2% for males (data not shown).
Discussion
The present study demonstrates that younger women have a higher prevalence of iron deficiency than older women and adults, as indicated by low s-ferritin and by high serum s-TfR concentrations. This finding suggests that iron requirements are not met by young women, likely secondary to iron losses from menstruation and reproductive cycles resulting in a high prevalence of iron deficiency. This hypothesis is also supported by the low prevalence of iron deficiency found in men in the same age groups.
In the ENN 99,34,35 iron status was evaluated by a
different method, the percentage of transferrin satura -tion (PST),19 whereas in the ENSANUT 2006 it was estimated by s-ferritin and s-TfR concentrations, thus comparisons are not possible.
In our study, we found a protective association between participation in the Oportunidades or Liconsa
programs and the risk for iron deficiency. This evidence suggests that the fortified foods distributed by both programs are playing a role in reducing anemia.36,
Nevertheless, the program Oportunidades offers other benefits that may contribute to reduce iron deficiency, as is the case of cash transfer which play a role in the increase in the familiar income that allows greater food availability with high nutritional content in the Oportu-nidades homes.
The prevalence of zinc deficiency in Mexican popu -lation represents a high public health risk according to the IZiCG (≥20%).25 The prevalence of zinc deficiency
Table IV
dailydietaryintake* ofiron, zinC, Copper, andMagnesiuMinadultMenandwoMen. MexiCo, ensanut 2006
Characteristics
Iron (mg/d) Zinc (mg/d) Copper (mg/d) Magnesium (mg/d)
Females Males Females Males Females Males Females Males
Median
(p 25, p 75) (p 25, p 75)Median (p 25, p 75)Median (p 25, p 75)Median (p 25, p 75)Median (p 25, p 75)Median (p 25, p 75)Median (p 25, p 75)Median
Age (years)
20 to 29 9.6 (7.2-13.0) 12.2 (9.6-16.3) 6.8 (4.8-8.5) 8.5 (6.5-11.2) 0.90 (0.65-1.20) 1.13 (0.82-1.46) 97.9 (74.2-132.6) 128.2 (92.3-171.4) 30 to 39 10.4 (7.4-13.7) 11.4 (8.6-16.1) 7.2 (5.1-9.1) 8.1 (5.9-11.1) 0.97 (0.71-1.29) 1.09 (0.86-1.46) 109.6 (80.4-145.5) 117.7 (87.7-166.4) 40 to 49 9.8 (7.2-13.1) 11.5 (8.4-17.1) 6.8 (4.8-8.9) 8.4 (5.9-11.2) 0.94 (0.70-1.22) 1.11 (0.81-1.51) 106.6 (78.9-138.8) 128.5 (96.3-167.0) 50 to 64 9.2 (6.5-12.3) 10.8 (8.0-14.4) 6.3 (4.5-8.6) 7.4 (5.6-10.3) 0.91 (0.69-1.21) 1.07 (0.78-1.46) 105.5 (76.3-136.5) 128.4 (98.2-159.9) >65 8.0 (5.2-10.7) 10.0 (7.6-12.8) 5.8 (3.8-7.2) 7.3 (4.9-8.4) 0.77 (0.54-1.00) 0.97 (0.69-1.16) 91.0 (62.1-124.7) 109.1 (80.8-136.8) BMI (kg/m2)
<18.5 14.2 (10.8-15.0) 10.2 (6.7-17.7) 9.1 (6.6-10.2) 8.1 (4.8-11.0) 1.02 (0.78-1.23) 1.01 (0.62-1.52) 86.7 (73.1-139.7) 111.5 (62.3-198.1) 18.5-24.9 10.0 (6.8-13.0) 11.5 (8.6-16.0) 6.6 (4.9-8.7) 8.0 (5.7-10.5) 0.92 (0.64-1.25) 1.09 (0.81-1.46) 101.6 (73.6-139.8) 124.6 (88.3-167.9) 25-29.9 9.7 (7.1-13.0) 11.3 (8.3-15.4) 6.5 (4.7-8.8) 7.7 (5.9-10.4) 0.91 (0.69-1.23) 1.08 (0.78-1.41) 105.7 (78.3-141.8) 127.2 (94.0-162.5) >30 9.2 (6.7-12.2) 10.5 (8.2-15.6) 6.6 (4.7-8.4) 7.9 (5.9-10.8) 0.91 (0.65-1.15) 1.06 (0.82-1.48) 101.0 (73.8-128.4) 116.0 (95.1-154.9) Socioeconomic status
Low 9.4 (6.5-13.1) 11.6 (8.0-15.4) 6.1 (4.1-8.3) 7.2 (5.2-9.4) 0.88 (0.61-1.19) 1.02 (0.76-1.34) 108.2 (73.1-140.3) 124.6 (93.9-169.2) Middle 9.3 (7.2-12.7) 11.3 (8.2-15.5) 6.6 (4.7-8.6) 7.8 (5.9-10.4) 0.94 (0.67-1.23) 1.06 (0.78-1.42) 103.2 (76.8-137.2) 120.2 (91.3-158.6) High 10.0 (7.1-12.5) 11.0 (8.6-15.7) 7.3 (5.3-9.1) 8.6 (6.5-11.5) 0.92 (0.71-1.23) 1.13 (0.86-1.50) 101.9 (74.5-131.9) 122.8 (89.3-161.3) Indigenous status
Indigenous 11.0 (7.1-15.0) 11.9 (8.3-16.2) 6.8 (4.4-9.2) 6.6 (5.3-9.3) 0.94 (0.65-1.32) 0.98 (0.80-1.28) 113.5 (79.2-160.2) 122.3 (96.4-164.4) Non-indigenous 9.4 (6.9-12.6) 11.3 (8.4-15.5) 6.6 (4.8-8.6) 7.9 (5.9-10.6) 0.91 (0.66-1.21) 1.08 (0.80-1.45) 102.9 (74.7-135.3) 122.8 (91.5-163.0) Area
Urban 9.6 (7.0-12.6) 11.1 (8.4-15.2) 6.8 (5.0-8.7) 8.0 (6.0-10.6) 0.92 (0.68-1.22) 1.08 (0.81-1.46) 101.9 (74.6-133.9) 120.6 (90.4-157.9) Rural 9.8 (6.6-13.5) 12.1 (8.4-16.6) 6.1 (3.8-8.4) 7.4 (5.2-10.1) 0.88 (0.62-1.20) 1.07 (0.76-1.37) 108.97 (76.3-148.4) 131.3 (98.4-178.2) Region
North 10.3 (7.0-13.1) 12.1 (8.6-17.5) 6.8 (5.0-9.9) 8.4 (6.1-11.4) 0.91 (0.65-1.20) 1.08 (0.79-1.47) 101.1 (74.9-134.2) 114.9 (91.3-156.9) Center 9.4 (6.6-12.7) 13.2 (8.7-17.3) 6.5 (4.5-8.4) 8.8 (6.5-11.8) 0.87 (0.64-1.16) 1.20 (0.81-1.54) 104.3 (73.6-142.0) 133.3 (103.0-179.4) Mexico City 9.3 (7.0-11.9) 10.5 (8.6-12.8) 6.6 (4.9-8.5) 7.7 (5.7-9.4) 0.94 (0.70-1.25) 1.02 (0.82-1.37) 99.7 (74.2-126.7) 112.8 (81.9-147.7) South 9.6 (7.0-13.2) 11.0 (7.9-15.2) 6.5 (4.7-8.7) 7.4 (5.3-9.8) 0.93 (0.66-1.23) 1.04 (0.78-1.37) 106.9 (76.5-139.3) 122.6 (93.6-162.5)
* Semi-quantitative Food Frequency Questionnaire Iron Estimated Average Requirement (EAR)=16 mg/d Zinc EAR= women 11mg/d, men 12mg/d
Copper EAR= 0.7mg/d UL=8.0mg/d
Magnesium EAR= women 280mg/d, men 215mg/d
the Mexican diet,37 in our study total fiber resulted a
risk factor. Other cause may be the low dietary intake of zinc, because the intake was only half of the EAR for females (6.8 mg/d) and about ¾ of the EAR for males (8.1 mg/d).
Our analysis presents for the first time LSC of copper and magnesium in Mexican adult population.
Although the prevalence was high, the scarce avail -ability of population-based investigations precludes comparisons between studies. In focal studies, LSC copper was 17% in Iran11 and 5.9-8.6% in Chile.20 A
contradiction in our study was that the median copper intake exceeded the EAR,30 and cannot explain the high
of antagonists, such as phytate and fiber, could reduce copper bioavailability.
The prevalence of LSC of magnesium in this sur -vey is almost twice the prevalences reported in other countries (14.5%).38 LSC of magnesium was associated
with an insufficient dietary intake, although we did not consider bioavailability of this mineral.26 Both factors
may contribute to the high prevalence of LSC of mag -nesium in Mexico. A study in South Mexico City found a magnesium intake three fold above ours; however its focal nature may explain the difference.39 Ames et al,40
suggest that in humans, LSC of magnesium has been as -sociated with colorectal and other cancers, hypertension, osteoporosis, diabetes, and the metabolic syndrome.
Dietary copper deficiency may play a role in the genesis of iron deficiency,41 however, in this case the
association was not significant between dietary copper and iron deficiency by s-ferritin (p=0.63). High dietary intake of phytates42,43 negatively affects iron, zinc, and
copper absorption. Likewise, a high intake of tannins reduces iron absorption up to 50%. However, in our study, phytate was not associated with a risk for iron and zinc deficiencies and LSC of copper; but this may explain the lack of improvement of the prevalence of zinc deficiency.
An inconsistency in our study was that no differ -ences were found in IDA when controlling for PCR in males and females, because values of PCR and ferritin increased in these circumstances and may not reflect actual state of iron deficiency. So the prevalence of IDA was overestimated in people without inflammation in total prevalence of IDA.16,17
The lack of association between dietary intakes of iron, zinc, copper and magnesium on the deficiencies or LSC of these minerals may be due to a lack of precision of a semi-quantitative food frequency questionnaire.26
A better estimation of LSC of magnesium is erythrocyte magnesium, as serum magnesium reflects the recent intake of this mineral. Likewise, Milne44 recommends the use of more sensitive indicators than serum copper concentrations for measuring copper deficiency (eryth -rocyte superoxide dismutase and platelet cytochrome-c oxidase). However, some of them are not feasible for large epidemiological studies as is the case of ENSA -NUT 2006.
Our study confirms a high prevalence of iron defi -ciency in female and zinc defi-ciency in both sexes. Data on LSC of copper and magnesium in Mexico are published here for the first time, reporting a high prevalence. We conclude that it is necessary to reexamine the nutritional interventions aimed at decreasing the prevalence of zinc deficiency because apparently there is no change in the prevalence in women 12-49 years of age. Likewise, LSC
of copper and magnesium should be examined their ad -verse effects and to decide about the pertinence to include them as part of the strategies to reduce the prevalence of micronutrient deficiencies in Mexico.
Declaración de conflicto de intereses: Los autores declararon no tener conflicto de intereses.
References
1. Ramakrishnan U. Prevalence of micronutrient malnutrition worldwide. Nutr Rev 2002;60:S46-S52.
2. Freire W. La anemia por deficiencia de hierro: estrategias de la OPS/ OMS para combatirla. Salud Publica Mex 1998;40(2):199-205. 3. Stoltzfus RJ. Iron-deficiency anemia: reexamining the nature and mag-nitude of the public health problem. Summary: implications for research and programs. J Nutr 2001;131(2):697S-701S.
4. Brabin BJ, Hakimi M, Pelletier D. An analysis of anemia and pregnancy-related maternal mortality. J Nutr 2001;131:604S-615S.
5. Dallman P. Iron. Present knowledge in nutrition. 6th edition.
Interna-tional Life Sciences Institute. ILSI. North America. 1990.
6. Wang J, Pantopoulos K. Regulation of cellular iron metabolism. Bio-chem J 2011;434:365-381.
7. Zidar BL, Shadduck RK, Zeigler Z, Winkelstein A. Observations on the anemia and neutropenia of human copper deficiency. Am J Hematol 1977;3:177-185.
8. Chandra RK, Grace A, Goldsmith Award lecture. Trace element regu-lation of immunity and infection. J Am Coll Nutr 1985;4(1):5-16. 9. Klevay LM, Canfield WK, Gallagher SK, Henriksen LK, Lukaski HC, Bolonchuk W, et al. Decreased glucose tolerance in two men during experimental copper depletion. Nutr Rep Int 1986;33:371-382. 10. Klevay LM. Metabolic interactions among dietary cholesterol, copper, and fructose. Am J Physiol Endocrinol Metab 2010;298(1):138-139. 11. Mir E, Hossein-nezhad A, Bahrami A, Bekheirnia MR, Javadi E, Afshar Naderi A, et al. Adequate Serum Copper Concentration Could Improve Bone Density, Postpone Bone Loss and Protect Osteoporosis in Women. Iranian J Publ Health 2007; suppl Osteoporosis:24-29.
12. Lai H, Lai S, Shor-Posner G, Ma F, Trapido E, Baum MK. Plasma zinc, copper, copper:zinc ratio, and survival in a cohort of HIV-1-infected homosexual men. J Acquir Immune Defic Syndr 2001;1;27(1):56-62. 13. Nachimuthu S, Balamuthusamy S, Irimpen A, Delafontaine P. Calcific constrictive pericarditis with refractory hypokalemia in a patient with Gitelman’s syndrome. Am J Med Sci 2009;337:74-76.
14. Kasifoglu T, Akalin A, Cansu DU, Korkmaz C, Saudi J. Hypokalemic paralysis due to primary hyperaldosteronism simulating Gitelman’s syn-drome. Kidney Dis Transpl 2009;20:285-287.
15. Akinci B, Celik A, Saygili F, Yesil S. A case of Gitelman’s syndrome presenting with extreme hypokalaemia and paralysis. Exp Clin Endocrinol Diabet 2009;117:69-71.
16. Calò LA, Pagnin E, Ceolotto G, Davis PA, Schiavo S, Papparella I, et al. Silencing regulator of G protein signaling-2 (RGS-2) increases angiotensin II signaling: insights into hypertension from findings in Bartter’s/Gitelman’s syndromes. J Hypertens 2008;26:938-945.
17. Thurnham D, Northrop-Clewes. Infection and the etiology of anemia. En: Nutritional Anemia. Kraemer K, Zimmermann MB, eds. Sight and Life Press 2007:231-256.
Cuernavaca, Morelos, México: Instituto Nacional de Salud Pública, 2001. 19. Villalpando S, García-Guerra A, Ramírez CI, Mejía F, Matute G, Shamah T, et al. Iron, zinc, and iodide status in Mexican children under 12 years and women 12-49 years of age. A probabilistic national survey. Salud Publica Mex 2003; 45:520-529.
20. Cediel DG, Olivares GM, Araya QM, Letelier CMA, López de Romana ED, Pizarra AF. Efecto de la inflamación subclínica sobre el estado nutri-cional de hierro, cobre y zinc en adultos. Rev Chil Nutr 2009; 36(1): 8-14. 21. Resano-Pérez E, Méndez-Ramírez I, Shamah-Levy T, Rivera Juan A, Sepúlveda-Amor J. Methods of the National Nutrition Survey 1999. Salud Publica Mex 2003;45(3):558-64.
22. Villalpando S, Gaytán MA, González Herrera O, Morales Ruán MC, Gómez Acosta LM, García Guerra A. Toma de muestras sanguíneas. En: Shamah- Levy T, Villalpando- Hernández S, Rivera-Dommarco J. Manual de Procedimientos para Proyectos de Nutrición. Cuernavaca, México. Instituto Nacional de Salud Pública 2006:109-148.
23. World Health Organization/United Nations University/UNICEF. Iron deficiency anemia: assessment, prevention, and control. Ginebra, Orga-nización Mundial de la Salud, 2001 (WHO/NHD/01.3).
24. Tietz NW (Ed): Clinical Guide to Laboratory Tests, 3rd ed. W. B. Saunders, Philadelphia, PA 1995:142-145.
25. International zinc Nutrition Consultative Group (IzincG). Technical Document # 1. Assessment of the risk of zinc deficiency in populations and options for its control. Hotz C and Brown KH (eds). Food Nutr Bull 2004;25:S94-S203.
26. Gibson R. Cap 23. Assessment of calcium, phosphorus, and magne-sium status. In: Principles of nutritional assessment. Nueva York (NY): Oxford University Press, 2005.
27. Cohen JH, Haas JD. Hemoglobin correction factors for estimating the prevalence of iron deficiency anemia in pregnant women residing at high altitudes in Bolivia. Pan Am J Public Health 1999;6(6):392-399. 28. Cogswell ME, Looker AC, Pfeiffer CM, Cook JD, Lacher DA, Beard JL, Lynch SR, and Grummer-Strawn LM. Assessment of iron deficiency in US preschool children and nonpregnant females of childbearing age: National Health and Nutrition Examination Survey 2003-2006. Am J Clin Nutr 2009;89:1334-42.
29. Rodríguez-Ramírez S, Mundo-Rosas V, Jiménez-Aguilar A, Shamah-Levy T. Methodology for the analysis of dietary data from the Mexican National Health and Nutrition Survey 2006. Salud Publica Mex 2009;51 suppl 4:S523-S529.
30. Bourges H, Casanueva E, Rosado JL. Recomendaciones de Ingestión de Nutrimentos para la población Mexicana. Bases Fisiológicas. Tomo 1. México: Medica Panamericana, 2005.
31. World Heal Organization. Physical status: The use and interpretation of anthropometry. Geneva: WHO, 1995.
32. Brofman M, Guiscafre H, Castro V, Castro R y Gutiérrez G. La medición de la desigualdad: una estrategia metodológica, análisis de las
características socioeconómicas de la muestra. Arch Invest Med (Méx) 1988;19:351-360.
33. Sharon L Lohr. Chap 9. Variance estimation in complex Surveys. In: Sharon L Lohr. Sampling: desing and analysis. Duxbury Press, 1999. 34. Shamah-Levy T, Villalpando-Hernández S, García-Guerra A, Mundo-Rosas V, Mejía-Rodríguez F, Domínguez-Islas CP. Anemia in Mexican women: Results of two national probabilistic surveys. Salud Publica Mex 2009;51 suppl 4:S515-S522.
35. Shamah-Levy T, Cuevas-Nasu L, Mundo-Rosas V, Morales-Ruán C, Cervantes-Turrubiates L, Villalpando-Hernández S. Health and nutrition status of older adults in Mexico: Results of a national probabilistic survey. Salud Publica Mex 2008;50:383-389.
36. Shama-Levy T, Villalpando-Hernandez S, Rivera-Dommarco JA, Cuevas-Nasu L. Capítulo 4: Impacto en Oportunidades en el estado de nutrición y anemia de niños y mujeres en edad fértil: Componente rural. Neufeld L, Garcia-Guerra A, Fernandez-Gaxiola AC, Rivera-Dom-marco JA. Capítulo 5: Impacto de Oportunidades en alimentación y nutrición en niños y mujeres en zonas Urbanas. En: González de Cossio T, López Acevedo G, Rivera Dommarco J, Rubio Soto GM. Nutrición y Pobreza: Política Pública Basada en videncia. México: Banco Mundial: SEDESOL, 2008.
37. WHO. Zinc. In: Vitamin and mineral requirements in human nutrition: report of a joint FAO/WHO expert consultation. Bangkok, Thailand: World Health Organization, 2005:230-245.
38. Schimatschek HF, Rempis R. Prevalence of hypomagnesemia in an unselected German population of 16,000 individuals. Magnes Res 2001;14(4): p. 283-90.
39. Hernández-Avila M, Romieu I, Parra S, Hernández-Avila J, Madrigal H, Willett W. Validity and reproducibility of a food frequency questionnaire to assess dietary intake of women living in Mexico City. Salud Publica Mex 998;40:133-140.
40. Ames BN. Low micronutrient intake may accelerate the degenerative diseases of aging through allocation of scarce micronutrients by triage. PNAS 2006; 103 (47): 17589-17594.
41. Knovich MA, Il’yasova D, Ivanova A, Molnar I. The association between serum copper and anemia in the adult Second National Health and Nutrition Examination Survey (NHANES II) population. Br J Nutr 2008;99(6):1226-1229.
42. Barquera S, Hernández-Barrera L, Campos-Nonato I, Espinosa J, Flores M, Barriguete JA, et al. Energy and nutrient consumption in adults: Analysis of the Mexican National Health and Nutrition Survey 2006. Salud Publica Mex 2009;51 suppl 4:S562-S573.
43. Barquera S, Rivera JA, Espinosa-Montero J, Safdie M, Campirano F, Monterrubio EA. Energy and nutrient consumption in Mexican women 12-49 years of age: Analysis of the National Nutrition Survey, 1999. Salud Publica Mex 2003;45 suppl 4:S530-S539.