Otras secciones de este sitio:
☞ ☞ ☞ ☞
☞ Índice de este número
☞ ☞ ☞ ☞
☞ Más revistas
☞ ☞ ☞ ☞
☞ Búsqueda
Others sections in this web site:
☞ ☞ ☞ ☞
☞ Contents of this number ☞
☞ ☞ ☞
☞ More journals ☞
☞ ☞ ☞ ☞ Search Artículo:
Hepatic morphological changes and oxidative stress in chronic
streptozotocin-diabetic rats
Copyright © 2005: Mexican Association of Hepatology ANNALS OF HEPATOLOGY
Number 2 April-June 2 0 0 5 Volume 4
P Evelson et al. Hepatic morphological changes and oxidative stress in chronic streptozotocin-diabetic rats
MG
115
edigraphic.com
Annals of Hepatology 2005; 4(2): April-June: 115-120
Annals of Hepatology
Abstract
Oxidative stress (OS) is a biological entity quoted as re-sponsible for several pathologies including diabetes. Di-abetes mellitus (DM) has been also associated to human cirrhosis. The present work was designed to study the occurrence of OS as well as morphologic alterations in rat livers following induction of DM. Two groups of rats were used: Control and Diabetic. DM was induced in the second group by streptozotocin (STZ) in a single dose of 60 mg/kg, injected i.p. The occurrence of OS was determined in liver homogenates by measuring the hydroperoxide-initiated chemiluminescence and the ac-tivity of antioxidant enzymes (superoxide dismutase, catalase and glutathione peroxidase). Liver sinusoids were morphometrically analyzed. In conclusion, livers from the diabetic group did not show evidence of the occurrence of OS, as it would be expected, but dilation of hepatic sinusoids was documented and it was signifi-cantly different from control group.
Key words: Diabetes, liver, chemiluminescence, free radicals, sinusoids.
Introduction
Several experimental models of type 1 and type 2 diabe-tes mellitus (DM) are available in rats.1). Streptozotocin
Original Article
Hepatic morphological changes and oxidative
stress in chronic streptozotocin-diabetic rats
Pablo Evelson;1 Carlota Susemihl;2 Irene Villarreal;2 Susana Llesuy;1 Ricardo Rodríguez;3 Horacio Peredo;4 Abraham Lemberg;4 Juan Perazzo;5 Ester Filinger2
1Laboratorio de Estrés Oxidativo en Patologías Humanas (LEOPH).
Cátedra de Química General e Inorgánica, Facultad de Farmacia y Bioquímica, Universidad de Buenos Aires, Argentina,
2Cátedra de Farmacia Clínica, Facultad de Farmacia y Bioquímica,
Universidad de Buenos Aires, Argentina, CONICET.
3Facultad de Medicina. Universidad de El Salvador, Buenos Aires,
Argentina.
4Cátedra de Farmacotecnia I. Facultad de Farmacia y Bioquímica,
Universidad de Buenos Aires, Argentina, CONICET.
5Cátedra de Fisiopatología. Facultad de Farmacia y Bioquímica,
Universidad de Buenos Aires, Argentina.
Address for correspondence: Prof. Dra. E. Filinger
Facultad de Farmacia y Bioquímica, UBA. Junín 956, 1113, Ciudad de Buenos Aires. Argentina.
Manuscript received: 21 February, 2005 and accepted: 11 April, 2005.
(STZ) is a frequently used drug that exerts a diabetogenic effect through a specific damage of the pancreatic beta cells, mimicking type 1 DM. It also induces systemic mi-crovascular alterations, as observed in retina and kidney.2,3
The liver constitutes an important parenchyma whose functions have been found altered in patients with DM.4
Oxidative stress (OS) can be associated to an increased rate of reactive oxygen species (ROS) generation, a de-crease of antioxidant defences or a combination of both. ROS-mediated alterations include damage to cells, tissues or organs and are proposed as a major factor in the mech-anism of several diseases including atherosclerosis,5
DM6,7 and chronic alcoholic intoxication.
An increased production of oxygen-derived free radi-cals as well as a decrease in the activity of free radical scavenger systems have been reported in DM.8 It has also
been proposed that an increase in OS could contribute to tissue damage in DM.9 Moreover, OS is an important
fac-tor in the etiology and pathogenesis of DM.10 Hepatic
glu-tathione levels were found decreased in STZ-diabetic rats.11 Recently, lipid peroxide levels were found
in-creased and superoxide dismutase activity dein-creased in liver homogenates of STZ-diabetic rats12 and the levels of
the antioxidant enzymes catalase, glutathione peroxidase and superoxide dismutase are diminished in liver of ex-perimental diabetic rats.13
The aim of the present work was to study the occur-rence of OS and morphological alterations in rat livers following induction of chronic STZ DM.
Methods
Animals
Wistar male rats weighing 240-270 g were used. All animals were housed individually in an environmentally controlled room and allowed free access to food and wa-ter. This experiment was performed according to the Guidelines for Animal Experiment of the School of Phar-macy and Biochemistry, University of Bs. As.
Experimental model
Annals of Hepatology 4(2) 2005: 115-120
116
edigraphic.com
• Group I, control. • Group II, diabetic
Experimental diabetes
Experimental diabetes was induced in rats by the ad-ministration of a single injection of STZ (60 mg/ kg; ip). Before the assays were performed, rats of Group II were maintained during 3 months, recording body weight and glycemia weekly.
Biochemical parameters
Blood samples were obtained before sacrifice and processed for determination of glycemia and tissue damage markers. Levels of glucose, aspartate ami-notransferase (AST) and alanine amiami-notransferase (ALT) activities were measured in serum samples us-ing conventional laboratory kits. Glycemia values are given in mg/dL of blood and the enzyme activities in U/L of serum.
Tissue homogenates
Liver samples processed for the determination of hy-droperoxide-initiated chemiluminescence (0.5-1.0 g of wet weight) were homogenized in 120 mM KCI, 30 mM phosphate buffer (pH 7.4) at 0-4 ºC. The suspension was centrifuged at 600 x g for 10 min at 0-4 ºC to remove nu-clei and cell debris. The pellet was discarded and the su-pernatant was used as ‘homogenate’ (MM3)14 and for the
measure of antioxidant enzyme activities.
Hydroperoxide-initiated chemiluminescence
Hydroperoxide-initiated chemiluminescence of rat ho-mogenates was measured in a liquid scintillation counter. Homogenates were placed in 25 mm diameter and 50 mm height low potassium glass vials. Reaction medium con-tained 120 mM KCI, 30 mM phosphate buffer (pH adjust-ed to 7.5). Protein content was adjustadjust-ed at 1.0 mg/mL of protein homogenate. Chemiluminescence measurements were made after the addition of 3 mM tert-butyl hydrop-eroxide to the reaction medium.15 Measurements were
carried out at 30 ºC. Results are expressed as counts per minute (cpm)/mg of protein.
Superoxide dismutase
Superoxide dismutase activity was determined spec-trophotometrically in plasma samples by measuring the inhibition of the rate of autocatalytic adrenochrome for-mation at 480 nm in a reaction medium containing 1 mM epinephrine and 50 mM glycine - buffer (pH adjusted to 10.2 with NaOH 1M). The enzymatic activity is ex-pressed as SOD units (U) per mg of protein. One SOD
unit is defined as the amount of enzyme that inhibits the rate of adenochrome formation in 50%.16
Catalase
Catalase activity was measured in the homogenates treat-ed with Triton X-100 by following the decrease of absorp-tion at 240 nm. The reacabsorp-tion medium consisted of 50 mM phosphate buffer (pH adjusted to 7.2) and 10 mM H202. The results are expressed as pmol catalase/ mg of protein.17
Glutathione peroxidase
Glutathione peroxidase activity was measured in the ho-mogenates by following NADPH oxidation at 340 nm as described by Flohé and Gunzler.18 The reaction medium
consisted of 30 mM phosphate buffer (pH adjusted to 7.0), 0.17 mM GSH, 0.2 U/ mL glutathione reductase and 0.5 mM tert-butyl hydroperoxide. The glutathione peroxidase activity is expressed as mU/mg of protein. One unit corre-sponds to 1 umol NADPH per min per mg of protein.
Protein determination
Protein concentration in homogenates was measured by the method of Lowry et al19 using bovine serum
albu-min as standard.
Microscopy and image analysis
After sacrifice, livers were removed, weighed and fixed in buffered formalin, included in Paraplast and stained with hematoxilin-eosin, PAS and Masson´s trichromic.
The hepatic sinusoidal area was measured by an auto-matic computerized semiquantitative method using the Scion Image Beta 0.4 software, coupled to an optical mi-croscope equipped with a VCC video camera. Results were expressed as the inverse log of intensity per sinusoi-dal area (ILGV/area). These soft images are properly standardized for background lighting ILGV/area results proportional to the unweighted average optical density, which is then used to determine optical density and sinu-soidal area. At least 9 sections per rat were analysed at the level of the 3 zones of the liver lobular histology.20
Select-ed areas for quantification were measurSelect-ed as pixels per area (square inches). Standard referenced area utilized was 8.33 square inches.21
For High resolution Optic Microscopy (HROM) tissue was fixed in 3% glutaraldehyde buffered with sodium cacodylate, embedded in epoxy and stained with toluidine blue.
Statistical analysis
MG
117
edigraphic.com
data were statistically analyzed by factorial analysis of variance (ANOVA) followed by the Neumann-Keuls test for comparison of means. Differences were considered significant at p <0.05 in the bilateral situation.
Results
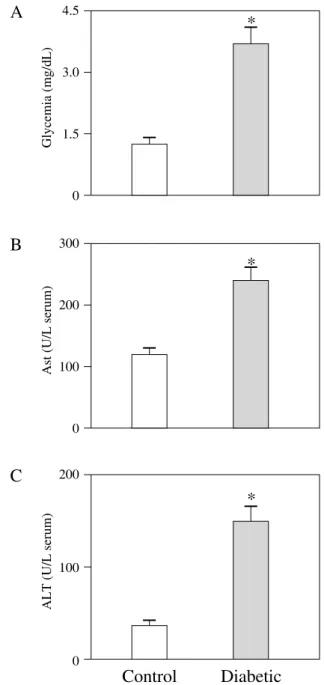
The general conditions of the animals were assessed by the evaluation of clinical parameters. As shown in Fig-ure 1A, fasting glycemia values in the diabetic animals were significantly higher when compared to controls. Se-rum levels of tissue damage marker enzymes AST
(Fig-ure 1B) and ALT (Fig(Fig-ure 1C) were significantly
in-creased in the diabetic rats as compared to the controls. No change was found for serum creatinine levels (data not shown).
The presence of oxidative damage can be evaluated by the determination of tert-butyl hydroperoxide-initiated chemiluminescence in liver homogenates (Figure 2). Hy-droperoxide-initiated chemiluminescence showed no modifications in diabetic rats.
The antioxidant system in diabetic rats liver homoge-nates showed an increased SOD activity as compared to the control (3.4 ± 0.2 USOD/mg prot, Figure 3A). When catalase activity (CA) in liver homogenates was mea-sured, it was found to be significantly decreased in dia-betics as compared to the controls (Figure 3B). Also glu-tathione peroxidase activity in diabetic liver homogenates decreased significantly (p< 0.001) when compared to controls (42 ± 2 mU/mg prot.). Enzyme activity de-creased 38 % in the diabetic liver, as shown in Figure 3C. As can be seen in Table I, significant differences were found in the sinusoidal area of diabetic animals when compared with controls. These results, recorded on a frame work area of 8.33 inches,22,23 show that sinusoidal
area determined at three zones expressed the same phe-nomena (no significant differences were registered in the different zones).
Light microscopy showed normal features in group I
(Figure 4), while group II showed sinusoidal dilation in
the pericentral vein zone as the major changes (Figure 5).
Discussion
Liver was selected as a target for oxidative stress eval-uation because its important metabolic functions and role in DM. The occurrence of OS was evaluated by measure-ment of tert-butyl hydroperoxide-initiated chemilumines-cence and the antioxidant enzymes activities.
The determination of tert-butyl hydroperoxide initiat-ed chemiluminescence is a sensitive assay that has been applied to detect OS associated to experimental patholog-ical situations such as ethanol treatment in rats,24 barbital
treatment in mice,25 tumor-bearing in mice,26 and
adria-mycin cardiotoxicity in rats, mice and rabbits.27,28 The
ra-tionale of the assay is that two samples of tissue with
sim-ilar characteristics will yield higher or lower chemilumi-nescence depending on the levels of endogenous antioxi-dants. A lower level of antioxidants as a consequence of a previous situation of oxidative stress will correspond to a higher chemiluminescence and this will indicate the oc-currence of oxidative stress.
Tert-butyl hydroperoxide-initiated chemiluminescence, recorded in the livers of diabetic rats showed the same val-ues observed in controls. These results are not in accor-dance with other authors that stated that OS was present as a contributory factor to diabetic pathology.29 It must be
Figure 1. Biochemical parameters. Glycemia, as mg/dL of blood (A),
aspartate aminotransferase (AST, B) and alanine aminotransferase, as U/ L of serum (ALT, C) in control (open bars, n=5) and diabetic (filled bars, n=5) rats. Data are the mean ± SEM. *P<0.01 compared with the control group.
4.5
3.0
1.5
0
Glycemia
(mg/dL)
A
*
300
200
100
0
Ast
(U/L
serum)
B
*
200
100
0
ALT
(U/L
serum)
C
*
Annals of Hepatology 4(2) 2005: 115-120
118
edigraphic.com
:rop odarobale FDP
VC ed AS, cidemihparG arap
acidémoiB arutaretiL :cihpargideM
sustraídode-m.e.d.i.g.r.a.p.h.i.c sustraídode-m.e.d.i.g.r.a.p.h.i.c cihpargidemedodabor
recalled that the decreased activity of catalase and glu-tathione peroxidase found in the diabetic group could possibly means an enzyme consuming effect. On the oth-er hand, othoth-er authors reported that OS is not ovoth-ertly or systematically increased in DM, except in final stages of its evolution when complications appear.30 Another
possi-ble explanation for these results could be that chronic di-abetic rat livers could produce some unknown antioxidant agent.
It can also be suggested that STZ-induced diabetes produced a sort of antioxidant effect through an unknown metabolite, glucose or advanced glycation end products.21
Liver antioxidant enzymatic defences were evaluated to determine parenchyma responses to the possible pres-ence of OS in these pathologies. The results obtained by measuring antioxidant enzymes, were also intriguing. Di-abetic animals showed that liver catalase and glutathion peroxidase activity decreased significantly.
It is difficult to assess in what extent liver microcir-culation, including its endothelial cells, participate in the vascular damage produced by chronic diabetes as occurred in other vascular beds.31-34 Besides, is not clear
if liver microvascular system is even more modified. The endothelial damage described by other authors1,35
could be the first event in vascular injury, producing cellular alterations. Accordingly to Huszka et al,36 NO
production is reduced in diabetes in correlation with en-dothelial damage.
Nitric oxide (NO), heme oxygenase 1 (HO1) and car-bon monoxide (CO) are endogenous compounds that acti-vate guanylate cyclase,35 leading to the generation of
cy-clic guanosine monophosphate, which in turn mediates various physiological functions. Moreover, an excessive production of CO, as a consequence of HO-1 overexpres-sion, could play an important role in the modulation of vascular tone under different pathological situations.1,2
Beside this, cytokines play also an important role an endothelin 3 is the major factor involved in the regulation of vascular resistance in the liver. All the former
path-ways should be explored to achieve a comprehensive state of the sinusoidal modulation under the present ex-perimental conditions.
It can be concluded that under these experimental con-ditions chronic diabetic rats do not suffer liver OS, as could be expected.
4000
3000
2000
1000
0
Chemiluminescence (c.p.m./mg
protein)
Control Diabetic
Figure 2. Chemiluminescence. Chemiluminescence as cpm/mg of
pro-tein in liver homogenates from control (open bars, n=5) and diabetic (filled bars, n=5) rats. Data are the mean ± SEM.
Figure 3. Oxidative stress parameters. A: Superoxide dismutase (SOD)
activity as U/mg of protein in liver homogenates from control (open bars, n=5) and diabetic (filled bars, n=5) rats. Data are the mean ± SEM. B: Catalase activity as pmol/mg of protein in liver homogenates from control (open bars, n=5) and diabetic (filled bars, n=5) rats. Data are the mean ± SEM. *P<0.01 compared with the control group. C: Glutathione peroxidase activity as mU/mg of protein in liver homoge-nates from control (open bars, n=5) and diabetic (filled bars, n=5) rats. Data are the mean ± SEM. *P<0.01 compared with the control group.
7.5
5.0
2.5
0
Catalase
(pmol/mg
protein)
B
*
50
40
30
20
10
0
Glutathione
peroxidase
activity
(mU/mg
protein)
C
*
Control
Diabetic
5
4
3
2
1
0
SOD
activity
(SOD
U
/mg
protein)
MG
119
edigraphic.com
Table I. Liver sinusoidal area quantification.
Group Sinusoidal area/field
Control (n = 87) 27,263.37 ± 698.64 Diabetic (n = 63) 35,364.43 ± 867.20a
t & p test t T = 7.32 - 0.0001
The selected areas for quantification were measured as pixels per area. The standard area used was 8.33 square inch.
a, indicate significant difference (P < 0.0001) according to student t test, two-sided P value.
n: number of fields measured.
Figure 4. Light micrograph from a control rat liver. Large arrow shows
a central vein and small arrow shows normal parenchymal cells (Mag-nification 600 X).
Figure 5. Light micrograph from a diabetic rat liver. Large arrow
shows a central vein and small arrow shows a dilated sinusoid. (Magni-fication 600 X).
Acknowledgements
This work was supported by grants from University of Buenos Aires (FA 056) and Fiorini Foundation.
References
1. Rodriguez R, Poucheret P, Battell M, McNeill H. In: Experimental
models of diabetes. J. McNeill ed. CRC Press. 1999: 3-17.
2. Veelken R, Hilgers K, Hartner A, Haas A, Bohnier K, Sterzel R. Nitric oxide synthase isoforms and glomerular hyperfiltration in early diabetic nephropathy. J Am Soc Nephrol 2000; 11:71-9.
3. Alder VA, Su E, Yu D, Cringle S, Yu PK. Diabetic retinopathy: early functional changes. Clin Exp Pharmacol Physiol 1997; 10: 785-88. 4. Cairus SR, Peters TJ. Biochemical analysis of hepatic lipid in
alco-holic and diabetic and control subjects. Clin Sci 1983; 65: 645-52. 5. Glaseer S, Selwyn A, Ganz P. Atherosclerosis: risk factors and the
vascular endothelium. Am Heart J 1996; 131: 379-84.
1. Kakkar R, Kalza J, Mantha S, Prasad K. Lipid peroxidation and ac-tivity of antioxidant enzymes in diabetic rats. Mol Cell Biochem 1995; 151: 113-9.
2. Matkovics B, Kotorman M, Varga S, Hai DQ, Varga C. Oxidative stress in experimental diabetes induced by streptozotocin. Acta Physiol
Hung 1997; 85: 29-38.
3. Wolff SP, Dean RT. Glucose autoxidation and protein modification: The role of oxidative glycosylation in diabetes. Biochem J 1987; 245: 234-50. 4. Tomlinson KC, Gardiner SM, Hebden RA, Bennett T. Functional consequences of STZ-induced DM, with particular reference to the CV system. Pharmacol Reviews 1992; 41: 104-31.
5. Raza H, Prabu SK, Robin MS, Avadhani NG. Elevated mitocondrial cytochrome P450 2E1 and glutathione S-transferase A4-4 in STZ-induced diabetic rats: tissue-specific variations and roles in oxidative stress. Diabetes 2004; 53: 185-94.
6. Otsyula M, King MS, Ketcham TG, Sanders RA, Watkins JB 3rd.. Oxidative stress in rats after 60 days of hypergalactosemia or hyper-glycemia. Int Toxicol 2003; 22: 423-27.
7. Anwar MM, Meki AR. Oxidative stress in STZ-induced diabetic rats: effects of garlic oil and melatonin. Comp Biochem Physiol A Mol
Integr Physiol 2003; 135: 539-47.
13. Genet S, Kale RK, Baquer NZ. Alterations in antioxidant enzymes and oxidative damage in experimental diabetic rat tissues: effect of vanadate and fenugreek (Trigonellafoenum graecum). Mol Cell
Biochem 2002; 236: 7-12.
14. Llesuy S, Evelson P, González Flecha P, Peralta J, Carreras M, Poderoso J, Boveris A. Oxidative stress in muscle and liver of rats with septic syndrome. Free Radic Biol & Med 1994; 16: 445-51. 15. González Flecha B, Llesuy S, Boveris A. Hydroperoxide-initiated
chemiluminiscence: an assay for oxidative stress in biopsies of heart, liver and muscle. Free Radic Biol & Med 1991; 10: 93-100. 1. Misra, I. Fridovich, I. The generation of superoxide radical during
the autoxidation of ferredoxins. J Biol Chem 1971; 246: 6886-90. 2. Chance B. In: Special methods: catalase. R. Glick. ed. Interscience.
New York. 1954: 408-24.
3. Flohé L, Gunzler A. Assays of Glutatione Peroxidase. Methods
Enzy-mology 1984: 114-21.
19. Lowry OH, Rosembrough NJ, Farr AL, Randall, RJ. Protein measure-ment with the folin phenol reagent. J Biol Chem 1951; 193: 265-75. 20. Miyai K. Structural organization of the liver. In: Neeks RG, Harrison SD,
Bull RJ, eds. Hepatotoxicology, Boca Ratón: CRC Press, 1991: 1-65. 21. Ling X, Nagai R, Sakashita N, Takeya M, Horiuchi S, Takahashi K.
Immunohistochemical distribution and quantitative biochemical detec-tion of advanced glycadetec-tion end products in fetal to adult rats and in rats with streptozotocin-induced diabetes. Lab Invest 2001; 81: 845-61. 22. Otterbein LE, Choi AM. Heme oxygenase: colours of defence against
cellular stress. Am J Physiol 2000; 279: L1029-37.
23. Otterbein LE, Soares MP, Yamashita K, Bach FH. Heme oxygenase-1: unleashing the protective properties of heme. Trends Inmunol 2003; 24: 449-55.
24. Boveris A, Fraga C, Varsavsky A, Koch O. Increased chemilumines-cence and superoxide production in the liver of chronically ethanol-treated rats. Arch. Biochem. Biophys 1983; 227: 534-541. 25. Fraga C, Llesuy S, Boveris A. Increased carbon
tetrachloride-stimu-lated chemiluminescence in the in situ liver of barbital treated mice.
Acta Physiol Pharmacol. Latinoamer 1984; 34: 143-150.
26. Boveris A, Llesuy S, Fraga C. Increased liver chemiluminescence in tumor-bearing mice. J Free Radic Biol & Med 1985; 1: 131-138. 27. Milei J, Boveris A, Llesuy S, Molina H, Storino R, Ortega D, Milei
Annals of Hepatology 4(2) 2005: 115-120
120
edigraphic.com
28. Llesuy S, Milei J, González Flecha B, Boveris A. Myocardialdam-age induced by doxorubicins: hydroperoxide-initiated chemilumines-cence and morphology. J Free Radic Biol & Med 1990; 8: 259-264. 29. Ramanathan M, Jaiswal A, Bhattacharya. Superoxide dismutase, cata-lase and glutathione peroxidase activities in the brain of streptozotocin induced diabetic rats. Indian J Exp Biol 1999; 37: 182-3.
30. Karasu C. Increased activity of H2O2 in aorta isolated from chroni-cally streptozotocin-diabetic rats: effects of antioxidant enzymes and enzymes inhibitors. Free Radic Biol & Med 1999; 27: 16-27. 31. Moore S, Bohlen H, Miller B, Evan A. Cellular and vessel wall
mor-phology of cerebral cortical arterioles after short-term diabetes in adult rats. Blood Vessels 1985; 22: 265-77.
32. Murata T, Nakagawa K, Klialil A, Ishibashi T, Inornata H, Sueishi K. The relation between expression of vascular endothelial growth factor and breakdown of the blood-retinal barrier in diabetic rat reti-nas. Lab Invest 1996; 74: 819-25.
33. Bazan N, Gordon W, Marcheselli V, Lukiw W, Duhault J, Koenig-Berard E, Linn D, et al. Experimental models and their use in studies of diabetic retinal microangiopathy. Therapie 1997; 52: 447-51.
34. Bassirat M, Khalil Z. Endothelin and free radicals modulate microvas-cular responses in streptozotocin-induced diabetic rats. Microvasc Res 2000; 59: 88-98.
35. Turk J, Corbett J, Ramanadham S, Bohrer A, McDaniel M. Biochemi-cal evidence for nitric oxide formation from streptozotocin in iso-lated pancreatic islets. Biochem Biophys Res Commun 1993; 197: 1458-64.