miR-182-5p Attenuates
High-Fat -Diet-Induced Nonalcoholic
Steatohepatitis in Mice
Qionghe Liang,*,** Huan Chen,* Xiaoqun Xu,* Weiwei Jiang*,**** Department of Neonatal Surgery, Children’s Hospital of Nanjing Medical University, Nanjing, China. ** Department of Radiology, Children’s Hospital of Nanjing Medical University, Nanjing, China. *** Institute of Pediatric Research, Children’s Hospital of Nanjing Medical University, Nanjing, China.
January-February, Vol. 18 No. 1, 2019: 116-125
The Official Journal of the Mexican Association of Hepatology, the Latin-American Association for Study of the Liver and
the Canadian Association for the Study of the Liver
Manuscript received: Manuscript received: Manuscript received: Manuscript received:
Manuscript received: October 17, 2017. Manuscript accepted:Manuscript accepted:Manuscript accepted:Manuscript accepted:Manuscript accepted: January 29, 2018.
DOI:10.5604/01.3001.0012.7902
A B S T R A C T A B S T R A C T A B S T R A C T A B S T R A C T A B S T R A C T
Introduction and aim.
Introduction and aim.Introduction and aim.
Introduction and aim.
Introduction and aim. Patients with NASH have increased risk for sepsis or cardiovascular disease after Liver transplantation. An important role of Toll-like receptor (TLR) 4 in the pathogenesis of nonalcoholic steatohepatitis (NASH) was demonstrated. Here,
we study the role of miR-182-5p in TLR4 expression and high-fat-diet (HFD)-induced NASH in vitro and in vivo. Material andMaterial andMaterial andMaterial andMaterial and
methods.
methods.methods.
methods.
methods. Following transfection with a miR-182-5p mimic, the effect of miR-182-5p on TLR4 in RAW264.7 and HepG2 cells was investigated. Following administration of the miR-182-5p mimic into the livers of HFD-induced NASH mice, we determined the in vivo
expression of TLR4, TNFα, and IL-6 and assessed the histologic features of the livers. Results.Results.Results.Results. Following lipopolysaccharideResults.
(LPS) treatment of RAW264.7 cells, real-time RT-PCR and western blot results indicated decreases levels of TLR4 mRNA and
pro-tein in the miR-182-5p group as compared with levels observed in controls, with similar trends were observed in TNFα and IL-6
pro-tein levels. Following oleic acid (OA) treatment of HepG2 cells, TLR4, TNFα, and IL-6 levels were significantly decreased in the
miR-182-5p group as compared with levels observed in controls. Following miR-182-5p administration, TLR4 mRNA and protein
lev-els decreased along with those of TNFα and IL-6 proteins, and the liver weight/body weight ratio of treated mice was less than that
observed in controls. Furthermore, hematoxylin and eosin staining showed that the miR-182-5p-treated group exhibited low adipose-cell cross-sectional areas, and Oil Red O staining showed decreases in the size of lipid droplets in the miR-182-5p-treated group. Conclusions.
Conclusions. Conclusions.
Conclusions.
Conclusions. miR-182-5p ameliorated HFD-induced NASH by suppressing TLR4.
Key words.
Key words.Key words.
Key words.
Key words. miR-182-5p. Non-alcoholic fatty liver disease. Non-alcoholic steatohepatitis. Toll-like receptor 4.
INTRODUCTION
In recent years, the morbidity associated with nonalco-holic fatty liver disease (NAFLD), one of the most com-mon liver diseases worldwide, in younger patients in
many countries, such as China,1-3 has increased. The most
commonly accepted pathogenic mechanisms associated with nonalcoholic steatohepatitis (NASH) involve
in-creased oxidative stress,4 insulin resistance, and expression
of inflammatory cytokines.5
The interest in Toll-like receptor (TLR) 4 in relation
to NAFLD pathogenesis has increased.6-9 Activation of
TLR4 triggers intracellular signaling molecules, including myeloid differentiation factor (MyD88)-dependent and MyD88-independent pathways. MyD88-dependent
path-ways induce nuclear translocation of nuclear factor
(NF)-κB, resulting in the production of inflammatory cytokines,
such as interleukin (IL) 6 and tumor necrosis factor
(TNF) α, whereas MyD88-independent pathways
pro-mote the release of inflammatory cytokines, such as
trans-forming growth factor β, IL6, and TNFα, which
subsequently induce inflammation and the formation of
fi-brosis.10-12 Moreover, the MyD88-dependent pathway was
implicated in high-fat-diet (HFD)-induced NAFLD.8
MicroRNAs (miRNAs) are highly conserved, endog-enous, noncoding RNA molecules that silence protein translation by binding to the 3' untranslated regions
(3'UTRs) of target mRNA.13 Analysis using TargetScan
de-rived from a 4-kb region of murine chromosome 6q is complementary to the 3'UTR of mouse TLR4.
Currently, there are no reports regarding the role of miR-182-5p in HFD-induced nonalcoholic steatohepatitis in mice in vivo, as well as in lipopolysaccharide (LPS)-in-duced inflammatory response in RAW264.7 cells or oleic acid (OA)-induced lipid accumulation in HepG2 cells in vitro. Here, we studied the roles of miR-182-5p in the in-flammatory response in macrophages following LPS ad-ministration, in lipid accumulation in HepG2 cells following OA administration, and in HFD-induced non-alcoholic steatohepatitis in mice to investigate miR-182-5p-related mechanisms associated with NAFLD.
MATERIALS AND METHODS
Cell cultures
The mouse macrophage cell line, RAW 264.7 (Ameri-can Type Culture Collection, Rockville, MD, USA), was cultured in high-glucose DMEM (Invitrogen, CA, USA) supplemented with 10% fetal bovine serum (FBS; Invitro-gen), and 1% (w/v) penicillin-streptomycin and
strepto-mycin (100 μg/mL). Cells were fasted in serum-free
medium for 12 h before stimulation with LPS. RAW264.7 cells were cultured in a six-well culture plate at a density
of 2-4 x 10⁵ cells per well for 24 h, then the cells were
transfected with 50 nM miR-182-5p mimic, miR-182-5p NC, and lip2000 (GenaPharma, Shanghai, China) for 24 h using Lipofectamine 2000 (Invitrogen) according to the manufacturer’s instructions. Then, RAW264.7 cells were
exposed to 1 μg/mL of LPS.
HepG2 cells were cultured in high-glucose DMEM supplemented with 10% fetal bovine serum and 1% (w/v) penicillin-streptomycin and streptomycin (100 ìg/mL). Oleic acid (OA) was used as a steatosis vector of HepG2 cells. After reaching 30-40% confluence, the cultured cells in six-well plates were transfected with miR-182-5p mim-ic, miR-182-5p NC, and lip2000. Non-transfected HepG2 cells served as steatotic controls. After 24 h, the cells reached 80% confluence, and then the cells were exposed to 1.0 mmol/L OA, 1% FFA-free BSA, and 100 nmol/L long-acting insulin in DMEM.
All cells were incubated at 37oC in a humidified
atmos-phere with 5% CO2. Total RNA and total protein were
ex-tracted from harvested cells for mRNA and protein expression by RT-PCR and Western blotting, respectively.
Animals
Twenty-four male C57BL / 6 mice were purchased from the Laboratory Animal Center of Nanjing Medical University at 3 weeks of age. All mice were kept in a
spe-cific pathogen-free facility under controlled light (06:00 am - 06:00 pm) and temperature (22 ± 2°C) conditions with free access to tap water. After a 7-day adaptation peri-od, the mice were randomly split into four groups of six mice each and fed a high-fat diet (HF; 4.73 kcal/g with 45% fat, 20% protein, and 35% carbohydrate; Medicience Ltd., China) for a period of 12 weeks. Three groups of mice were administered 5 mg/kg of Ago- miR-182-5p (Ribobio, Guangzhou, China) via tail vein in saline (182-5p group), and miR-182-5p normal control (182-5p NC group) twice a week; the HF group was not treated. HFD and miR-182-5p NC groups were the control groups of HFD+miR-182-5p group. Body weight was monitored throughout life. After 12 weeks, the mice were killed at 09:00 am after overnight fasting (12 h). The animals in each cohort were sacrificed for liver and plasma collection. All animals were treated as recommended in the Guide for the Care and Use of Laboratory Animals, issued by the China Associa-tion of Laboratory Animal Care. All of the studies were ap-proved by the University Committee on Use and Care of Animals and overseen by the Unit for Laboratory Animal Medicine at Nanjing Medical University.
Real-time RT-PCR
Total RNA was isolated from tissue and cultured cells with TRIzol reagent (Invitrogen) and reverse-transcribed with a reaction mixture. Quantitative real-time PCR (qPCR) analysis was performed using the SYBR Green qPCR Master Mix (Applied Biosystems [ABI], CA, USA) and a Step One Plus real-time PCR system (ABI). The
ex-pression data were normalized to the exex-pression of β
-ac-tin. To determine miRNA expression, total RNA was reverse-transcribed and the resulting cDNA was used with miRNA-specific TaqMan primers (ABI) and Taq-Man Universal PCR Master Mix (ABI). RNU6B was used as an endogenous control for data normalization of miR-182-5p levels. The comparative threshold cycle (Ct) meth-od was used to measure the relative changes in expression;
2-ΔΔCt represents the fold change in expression.
Dual-luciferase reporter assays
System (Promega) and a GloMax 20/20 Luminometer (Promega). The ratios of Firefly luciferase lumines-cence relative to Renilla luciferase lumineslumines-cence were calculated.
Western analysis
Total protein from mouse livers or cells were obtained with lysis buffer (Beyotime, Nantong, China), resolved by SDS-polyacrylamide gel electrophoresis (PAGE), and transferred to an Immobilon-P polyvinylidene difluoride (PVDF; Millipore, MA, USA) membrane. After blocking the membranes using (5% wt/vol) skim milk for 60 min, the membranes were incubated with an TLR4
anti-body (Abcam, Cambs, UK), and anti-β-actin antibody
(Santa Cruz, CA, USA). After washing, the membranes were probed with the corresponding secondary antibod-ies before development using an ECL Western blotting detection system (Pierce, NJ, USA) by enhanced chemi-luminescence.
Immunoassay of
Tumor Necrosis Factor-ααααα and Interleukin-6
TNF-α and IL-6 levels were detected by ELISA
ac-cording to the manufacturer’s protocol (Adlitteram
Diag-nostic Laboratories anti-rat TNF-α Elisa kit and goat
anti-rat IL-6 Elisa kit).
Serum levels of triglycerides (TG)
A standard automatic analyzer (Hitachi 7600-10; Hitachi, Japan) was used to determine the serum levels of TG.
The intraperitoneal glucose tolerance test (IPGTT)
Briefly, at W16, all the groups mice were fasted over-night. The mice injected i.p. with 1.5 g D-glucose (50% stock solution in saline)/kg body weight. Blood samples were taken from tail vein at 0-, 30-, 60-, and 120-min inter-vals after the glucose injection, and glucose levels were measured by a glucose meter (Accu-Chek; Roche).
Histologic analysis
Formalin-fixed, paraffin-embedded mouse liver speci-mens were sectioned at 4 mm and stained with hematoxy-lin and eosin. Liver samples were also stained with picrosirius red solution. The sections used for his-topathologic analysis were examined by light microscopy. Liver samples were also stained with picrosirius red
solu-tion, and the area of liver fibrotic was quantified using the winROOF visual system (Mitani Co., Tokyo, Japan).
Assessment of lipid accumulation in HepG2 cells and liver tissues
Lipid accumulation in HepG2 cells was detected using Oil-red O staining. In brief, cells were washed with phos-phate-buffered saline (PBS) and fixed with 4% (w/v) para-formaldehyde in PBS for 5 min. Then cells were incubated with 0.5% (w/v) Oil-red O in an isopropyl alco-hol/water (60/40, v/v) solution for 30 min, and washed twice with PBS. The percentage of lipid-positive cells was analyzed with image software (Jeda, Jiangsu, China). Liver sections were stained with Oil-red O to detect TG. At least three slices per tissue sample (x 100 magnification) or three different microscopic fields per culture (x 400 magnification) were photographed. Each photograph was assessed by two investigators.
NAFLD activity score (NAS)
The NAS, designed and validated by the Pathology Committee of the NASH Clinical Research Network, is used to assess the severity of NAFLD. An activity score was generated by adding the individual scores for the following features: steatosis (< 5% = 0; 5 33% = 1; 33 -66% = 2; > -66% = 3); lobular inflammation (none = 0; < 2 foci = 1; 2 - 4 foci = 2; > 4 foci = 3); and ballooning (none = 0; few = 1; prominent = 2). A NAS < 3 corre-lates with mild non-alcoholic fatty liver, a NAS of 3-4 correlates with moderate non-alcoholic fatty liver, and a
NAS ≥ 5 correlates with NASH.
Statistical analysis
Statistical analysis was performed using SPSS software (version 14.0; SPSS, Inc., Chicago, IL, USA). Significant differences between groups were analyzed by one-way ANOVA, followed by post-hoc Fisher’s least significance difference (LSD) test. Body weight and serum glucose during IPGTT were analyzed by one-way ANOVA with repeated measures, followed by a LSD test. A P < 0.05 was considered significant.
RESULTS
miR-182-5p reduces macrophage inflammatory response by inhibiting TLR4 expression
Figure 1.
Figure 1.Figure 1.
Figure 1.Figure 1. TLR4 is a miR-182-5p target according to dual-luciferase-reporter assay. (AAAAA) The putative miR-182-5p binding sequences in the TLR4 mRNA
3'-UTR according to TargetScan version 5.2. Transfection with a miR-182-5p mimic inhibits luciferase activity by more than 50% in (BBBBB) RAW264.7 and (CCCCC)
HepG2 cells. ** P < 0.01, miR-182-5p group vs. other groups.
Figure 2. Figure 2. Figure 2. Figure 2.
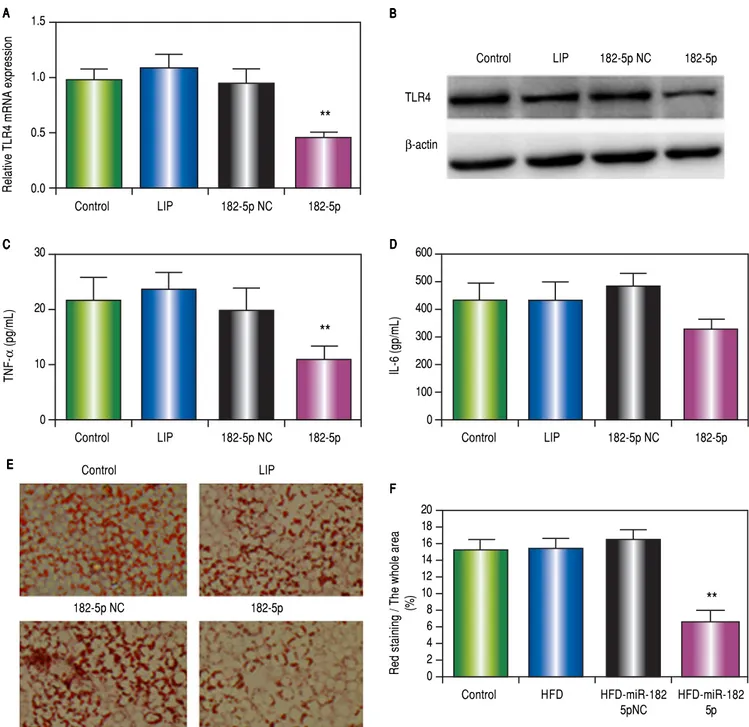
Figure 2. miR-182-5p down-regulates TLR4 in macrophages following LPS administration in vitro. A.A.A.A. RT-PCR analysis of TLR4 expression in macrophagesA.
following LPS administration. B.B.B.B.B. TLR4 protein levels according to western blot analysis. The levels of (CCCCC) TNFα and (DDDDD) IL-6 levels in supernatants according
to ELISA. Results represent the mean ± standard deviation. *P < 0.05 and **P < 0.01, miR-182-5p group vs. other groups.
**
**
AAAAA**
BBBBBControl LIP 182-5P NC 182-5P
TLR4
β-actin
Binding site Predicted consequential pairing of target region (top) and miRNA (bottom)
Position 3287-3293 of TLR4 3’ UTR 5’ . .. AUCA A AGCCAGUUGCUUGCCA AU...
mo-miR-182 3’ GCCACACUC A AGAUGGU A ACGGUUU
Relative
luciferase
activity
(RAW 264.7)
40
30
20
10
0
182-5p-wt 182-5p-mut 182-5p 182-5p lip-wt lip-mut NC-wt NC-mut
**
BBBBBRelative
luciferase
activity
(HepG2)
40
30
20
10
0
182-5p-wt 182-5p-mut 182-5p 182-5p lip-wt lip-mut NC-wt NC-mut
C CC CC
Relative TLR4 mRNA expression
1.5
1.0
0.5
0.0
Control LIP 182-5p NC 182-5p
**
AAAAATN
F-α
(pg/mL)
40
30
20
10
0
Control LIP 182-5p NC 182-5p
**
CCC CC
IL-6 (pg/mL)
800 700 600 500 400 300 200 100 0
Control LIP 182-5p NC 182-5p
**
DFigure 3. Figure 3. Figure 3. Figure 3.
Figure 3. miR-182-5p down-regulates TLR4 in HepG2 cells following OA administration. A.A.A.A.A. RT-PCR analysis of TLR4 in HepG2 cells following OA adminis-tration. B.B.B.B.B. TLR4 protein levels according to western blot analysis. C.C.C.C.C. TNF and (DDDDD) IL-6 levels in supernatants according to ELISA. EEEEE and F.F.F.F.F. Lipid accumu-lation decreased following miR-182-5p transfection. Results are the mean ± standard deviation. * P < 0.05 and ** P < 0.01, miR-182-5p group vs. other groups.
TLR4 (Figure 1A), and a luciferase reporter was used to confirm the role of miR-182-5p in TLR4 inactiva-tion in macrophages. Our results verified that the miR-182-5p mimic inhibited luciferase activity by > 50% (Figure 1B), thereby demonstrating the ability of miR-182-5p to decrease TLR4 expression in
macro-phages. Additionally, transfection with the miR-182-5p mimic resulted in decreased TLR4 mRNA (Figure 2A) and protein (Figure 2B) levels in LPS-treated RAW264.7 cells. Furthermore, miR-182-5p transfec-tion attenuated TNF (Figure 2C) and IL-6 (Figure 2D) levels.
BBBBB
Control LIP 182-5p NC 182-5p
TLR4
-actin
EEEEE Conrtol LIP
182-5p NC 182-5p
TNF
(pg/mL
)
30
20
10
0
Control LIP 182-5p NC 182-5p
**
CCC CC
Relative
TLR4
mRNA
expressio
n
1.5
1.0
0.5
0.0
Control LIP 182-5p NC 182-5p
**
AAAAARed
staining
/
The
whole
are
a
(%
)
20 18 16 14 12 10 8 6 4 2 0
Control HFD HFD-miR-182 HFD-miR-182
5pNC 5p
**
FFFFFIL-6
(gp/mL
)
600
500
400
300
200
100
0
Control LIP 182-5p NC 182-5p
OA administration in miR-182-5p-transfected HepG2 cells downregulates TLR4 expression
OA-administered HepG2 cells transfected with the miR-182-5p mimic inhibited TLR4 mRNA (Figure 3A) and protein (Figure 3B) expression. miR-182-5p
transfec-tion also attenuated TNFα (Figure 3C) and IL-6 (Figure
3D) levels and decreased lipid accumulation (Figures 3E and 3F).
A luciferase reporter was used to confirm the role of miR-182-5p in TLR4 inactivation in HepG2 cells. Our re-sults indicated that transfection with the miR-182-5p mimic inhibited luciferase activity by > 50% (Figure 1C), thereby demonstrating the ability of miR-182-5p to de-crease TLR4 expression in hepatic parenchymal cells.
Effects of miR-182-5p and HFD on the liver weight/body weight ratio and
triglyceride (TG) levels in mice
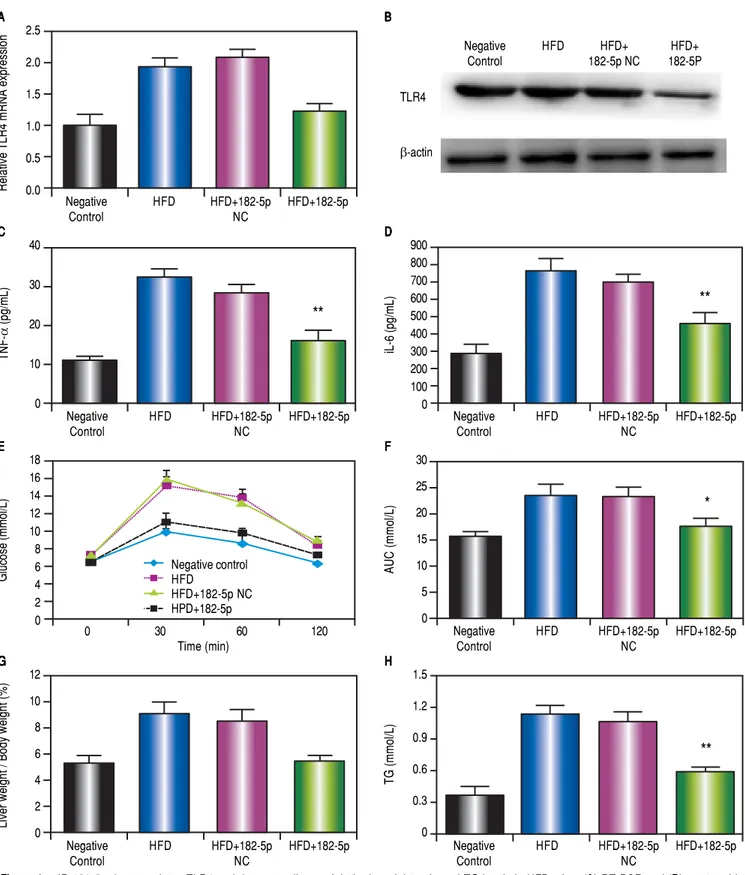
As shown in figure 4G, the liver weight/body weight ra-tio in the HFD+miR-182-5p group was lower than that observed in HFD and HFD+miR-182-5p groups. The TG level in the HFD+miR-182-5p group was also lower than that observed in HFD and HFD+miR-182-5p groups (Figure 4H). The body weight in the HFD+miR-182-5p group was also lower than that observed in HFD and HFD+miR-182-5p groups at 16 weeks (Figure 5P).
The intraperitoneal glucose tolerance test
The intraperitoneal glucose tolerance test show glu-cose levels in the HFD+miR-182-5p group was signifi-cantly reduced compared to the HFD, and HFD+miR-182-5p negative control (NC) groups at W16 (Figures 4E and 4F).
Histologic changes
Hematoxylin and eosin staining in the control, HFD, HFD+miR-182-5p NC, and HFD+miR-182-5p groups revealed that the HFD+miR-182-5p group exhibited low-er avlow-erage adipose-cell cross-sectional areas as compared with the HFD and HFD+miR-182-5p NC groups (Fig-ures 5E-5H).
Assessment of lipid accumulation in liver tissue
As shown in figures 5B and 5C, Oil Red O staining in-dicated that the liver was filled with large droplets in the HFD and HFD+miR-182-5p NC groups; however, in the HFD+miR-182-5p group (Figure 5D), the lipid droplets were smaller. Oil-red O staining revealed lipid
droplets in 5.5% of cells in the HFD+miR-182-5p group; lipid droplets were found in 1.80%, 11.2%, and 10.6% of the cells in the NF, HFD, and HFD+miR-182-5p NC groups, respectively (Figure 5M).
NAFLD Activity Score (NAS)
The severity of the NAFLD in the livers was assessed by NAS (Figure 5N). In HFD and HFD+miR-182-5p NC groups, NAS scores is 3.4 and 3.2, which show in-flammation, liver steatosis, and ballooning was greater than the HFD+miR-182-5p group , which score is 1.2.
Assessment of
the fibrotic index in liver tissue
Picrosirius red solution was used to calculated the fi-brotic index. The red-solution range for the miR-182-5p group (Figure 5L) was smaller than that observed for the HFD (Figure 5J) and HFD+miR-182-5p NC (Figure 5K) groups. The fibrotic index was significantly lower in 182-5p group than in HFD and HFD+miR-182-5p NC groups (Figure 5O).
DISCUSSION
Our results indicated that the levels of TLR4 and pro-inflammatory cytokines decreased following miR-182-5p administration in a mouse model of HFD-induced NASH. Moreover, HFD-induced NASH attenuation was accompanied by decreases in TG levels and improved glu-cose tolerance.
Our previous studies demonstrated that the TLR4-sig-naling pathway is induced in a variety of liver pathological and physiological processes, including liver warm
ischemia/reperfusion (I/R) injury,14 graft injury in
small-for-size liver transplantation,15,16 and NASH
pathogene-sis,17 which are all attenuated by inactivation of
TLR4-signaling. In our previous study, we have shown miR-146b ameliorated HFD induced NASH by directly suppressing IL-1 receptor-associated kinase 1 (IRAK1) and tumor necrosis factor receptor-associated factor 6 (TRAF6), which are two key adaptor molecules down-stream of TLR4. In this article, miR-182-5p directly inhib-its the expression of TLR4, which also can ameliorate HFD-induced NASH. Therefore, 146b and miR-182-5p both can ameliorate HFD-induced NASH by
in-hibiting TLR4 signaling pathway.17
Moreover, we first verified that miR-182-5p can inhib-it the expression of TLR4, and miR-182-5p can amelio-rates liver I/R injury by targeting Toll-Like Receptor 4.18 Qin SB, et al. found that miR-182-5p inhibited spoptosis
Negative HFD HFD+182-5p HFD+182-5p
Control NC
D DD DD
iL-6 (pg/mL)
900 800 700 600 500 400 300 200 100 0
Negative HFD HFD+182-5p HFD+182-5p
Control NC
H HH HH
TG (mmol/L)
1.5
1.2
0.9
0.6
0.3
0
Figure 4.
Figure 4.Figure 4.
Figure 4.
Figure 4. miR-182-5p downregulates TLR4 and decreases liver weight/body weight ratio and TG levels in HFD mice. (AAAAA) RT-PCR and (BBBBB) western blot
analyses revealed significant decreases in TLR4 mRNA and protein levels, respectively, in the liver following miR-182-5p administration. (CCCCC) TNFa and (DDDDD)
IL-6 levels in the liver decreased significantly following transfection with the miR-182-5p mimic. (EEEEE and FFFFF) Blood glucose area under the concentration-time curve
(AUC) values for the 0-h to 2-h interval following glucose injection. (GGGGG) Liver weight/body weight ratio and (HHHHH) TG levels in the miR-182-5p group were lower
than those observed in the HFD and HFD+miR-182-5p NC groups after 16 weeks. Results represent the mean ± standard deviation. * P < 0.05 and ** P <
0.01, miR-182-5p group vs. HFD and HFD+miR-182-5p NC groups.
BBBBB
Negative HFD HFD+ HFD+
Control 182-5p NC 182-5P
TLR4
β-actin
**
**
*
**
Negative HFD HFD+182-5p HFD+182-5pControl NC
AAAAA
Relative TLR4 mRNA expression
2.5
2.0
1.5
1.0
0.5
0.0
Negative HFD HFD+182-5p HFD+182-5p
Control NC
C CC CC
TN
F-α
(pg/mL)
40
30
20
10
0
0 30 60 120
Time (min) EEEEE
Glucose (mmol/L)
18 16 14 12 10 8 6 4 2 0
Negative HFD HFD+182-5p HFD+182-5p
Control NC
G G G G G
Liver
weight
/ Body
weight
(%)
12
10
8
6
4
2
0
Negative HFD HFD+182-5p HFD+182-5p
Control NC
FFFFF
AUC (mmol/L)
30
25
20
15
10
5
0 Negative control
HFD
Figure 5. Figure 5.Figure 5. Figure 5.
Figure 5. miR-182-5p decreased lipid accumulation in liver tissue and histological damage in HFD mice. (A-DA-DA-DA-DA-D) Representative Oil Red O staining in the NC, HFD, HFD+miR-182-5p NC, and HFD+miR-182-5p groups. (BBBBB and CCCCC) Livers of the HFD and HFD+miR-182-5p NC groups were filled with large drop-lets. (DDDDD) Livers of the miR-182-5p group were filled with small lipid droplets. (E-HE-HE-HE-HE-H) Representative hematoxylin and eosin staining in the NC, HFD, HFD+miR-182-5p NC, and HFD+miR-182-5p groups. (FFFFF and GGGGG) Livers of the HFD and HFD+miR-182-5p NC groups exhibited high average adipose-cell cross-sectional areas. (HHHHH) The miR-182-5p group exhibited low average adipose-cell cross-sectional areas as compared with areas observed in the (FFFFF) HFD and (GGGGG) HFD+miR-182-5p NC groups. (I–LI–LI–LI–LI–L) Representative picrosirius red staining to assess the fibrotic index in the NC, HFD, HFD+miR-182-5p NC, and HFD+miR-182-5p groups. The fibrotic index was significantly lower in the HFD+miR-182-5p group as compared with areas observed in the (JJJJJ) HFD and (KKKKK) HFD+miR-182-5p NC groups. Data represent the mean ± standard error of the mean (n = 6, each group). (MMMM) Oil-red O staining revealed lipid droplets inM 5.5% of cells in HFD+miR-182-5p group, which is lower than HFD and HFD+miR-182-5p NC groups. (NNNNN) The severity of the NAFLD in the mouse livers was assessed using the NAS. The NAS scores of HFD+miR-182-5p score is 0.7, which is lower than HFD and HFD+miR-182-5p NC groups. (OOOOO) The fibrotic index was significantly lower in HFD+miR-182-5p than HFD and HFD+miR-182-5p NC groups. (PPPPP)The body weight in the HFD+ miR-182-5p group was also lower than that observed in HFD and HFD+miR-182-5p groups at 16 weeks. *P < 0.05, miR-182-5p group vs. HFD and HFD+miR-182-5p NC groups.
Negative control HFD HFD+182-5p NC HFD+182-5p
Oil-Red O
H&E
Picrosirius red
M MM
MM NNNNN
O OO
OO PPPPP
NF HFD HFD+182-5pNC HFD+182-5p
Red
staining
/
The
whole
are
a
(%
)
14 12 10 8 6 4 2 0
NF HFD HFD+182-5pNc HFD+182-5p
NA
S
4
3
2
1
0
NF HFD HFD+182-5pNC HFD+182-5p
Positive
Sirius
red
(%
)
25
20
15
10
5
0
3W 4W 5W 6W 7W 8W 9W 10W11W 12W 13W 14W15W16W
Body
weight
(g
)
50 45 40 35 30 25 20 15 10 5 0
NF HFD
HFD+182-5pNC
HFD+182-5p *
*
*
TLR4 is potential therapeutic target for NASH.6-9,17
Previous studies reported TLR4 effects on NASH
patho-genesis in Kupffer cells;6,7 however, Liang, et al.8 showed
that liver parenchymal cells also play a primary role in NASH pathogenesis. Moreover, we using TargetScan software found that the sequence of miR-182-5p is com-plementary to the 3'UTR of mouse TLR4. Based on these findings, we transfected different cells lines with an miR-182-5p mimic, with the results indicating significant sup-pression of TLR4 exsup-pression, as well as the downstream
pro-inflammatory cytokines TNFα and IL-6, in both
mouse macrophages and liver parenchymal cells. As a re-sult, miR-182-5p can reduce the expression of inflamma-tory factors by inhibiting the expression of TLR4 in vivo and in vitro, and it can play a protective role for highfat -diet-induced nonalcoholic steatohepatitis in mice.
miR-182-5p also participates in developmental proc-esses, including involvement in the regulation of circadi-an rhythms in the retina circadi-and cellular homeostasis in the
inner ear.20,21 In cancer processes, miR-182-5p is involved
in apoptosis and cellular invasiveness.22-24 In human
gas-tric cancer cells, miR-182-5p improves the viability, mi-gration, mitosis, and invasion ability by targeting the
expression of RAB27A.25 miR-182-5p can regulate the
process of nerve injury-induced nociceptive
hypersensi-tivity by inhibiting Ephrin Type-b Receptor 1.26 These
findings indicated that miR-182-5p may attenuate HFD-induced NASH through additional signaling pathways, which require further study.
In summary, our study revealed potential therapeutic roles for miR-182-5p based on its attenuation of NASH in a mouse model following miR-182-5p administration and overexpression. The underlying mechanism associated with this process might involve decreased inflammatory reactions in hepatic macrophages, as well as decreased in-flammation and lipid metabolism in hepatic parenchymal cells.
ABBREVIATIONS
• ABI: Applied Biosystems.
• Ct: threshold cycle.
• HFD: high-fat-diet.
• I/R: ischemia/reperfusion.
• IL: interleukin.
• IRAK1: IL-1 receptor-associated kinase 1.
• LPS: ipopolysaccharide.
• LSD: least significance difference.
• miR-182-5p: miRNA-182-5p.
• miRNAs: microRNAs.
• NAFLD: nonalcoholic fatty liver disease.
• NAS: NAFLD activity score.
• NASH: nonalcoholic steatohepatitis.
• NC: negative control.
• NF: nuclear factor.
• OA: oleic acid.
• PBS: phosphate-buffered saline.
• PVDF: polyvinylidene difluoride.
• qPCR: quantitative real-time PCR.
• TG: triglyceride.
• TLR: toll-like receptor.
• TNF: tumor necrosis factor.
• TRAF6: tumor necrosis factor receptor-associated
factor 6.
CONFLICT OF INTEREST
The authors declares that there is no conflict of interest regarding the publication of this article.
SUPPORT
This study was supported by National Natural Science Foundation of China (81100318), Young medical talents in Jiangsu Province (QNRC2016081).
ACKNOWLEDGMENTS
We thank Dr. Nan Zhou for the histologic analysis.
REFERENCES
1. Rinella ME. Nonalcoholic fatty liver disease: a systematic re-view.JAMA 2015; 313: 2263-73.
2. Targher G, Chonchol MB, Byrne CD. CKD and nonalcoholic fatty liver disease. Am J Kidney Dis 2014; 64: 638-52. 3. Granér M, Nyman K, Siren R, Pentikäinen MO, Lundbom J,
Hakkarainen A, Lauerma K, et al. Ectopic fat depots and left ventricular function in non-diabetic men with nonalcoholic fatty liver disease. Circ Cardiovasc Imaging 2015; 8: e001979.
4. Day CP, James OF. Steatohepatitis: a tale of two “hits”?
Gastroenterology 1998; 114: 842-5.
5. Day CP. From fat to inflammation. Gastroenterology 2006; 130: 207-10.
6. Rivera CA, Adegboyega P, van Rooijen N, Tagalicud A, All-man M, Wallace M. Toll-like receptor-4 signaling and Kupffer cells play pivotal roles in the pathogenesis of non-alcoholic steatohepatitis. J Hepatol 2007; 47: 571-9.
7. Spruss A, Kanuri G, Wagnerberger S, Haub S, Bischoff SC, Bergheim I. Toll-Like Receptor 4 Is Involved in the Develop-ment of Fructose-Induced Hepatic Steatosis in Mice. Hepa-tology 2009; 50: 1094-104.
8. Li L, Chen L, Hu L, Liu Y, Sun HY, Tang J, Hou YJ, et al. Nu-clear Factor High-Mobility Group Box1 Mediating the Activa-tion of Toll-Like Receptor 4 Signaling in Hepatocytes in the Early Stage of Nonalcoholic Fatty Liver Disease in Mice.
Hepatology2011; 54: 1620-30.
9. Chen W, Wang X, Huang LI, Liu BO. Hepcidin in non-alcoholic fatty liver disease regulated by the TLR4/NF-kB signaling pathway.Exp Ther Med 2016; 11: 73-6.
10. Takeda K, Akira S. TLR signaling pathways. Semin Immunol
11. Seki E, Brenner DA. Toll-like receptors and adaptor mole-cules in liver disease: update. Hepatology 2008; 48: 322-35. 12. Akira S, Takeda K. Toll-like receptor signaling. Nat Rev
Im-munol 2004; 4: 499-511.
13. Ambros V. The functions of animal microRNAs. Nature
2004; 431: 350-5.
14. Jiang W, Kong L, Ni Q, Lu Y, Ding W, Liu G, Pu L, et al. miR-146a ameliorates liver ischemia/reperfusion injury by sup-pressing IRAK1 and TRAF6. PLoS One 2014; 9: e101530. 15. Jiang W, Ni Q, Tan L, Kong L, Lu Y, Xu X, Kong L. The
mi-croRNA-146a/b attenuates acute small-for-size liver graft in-jury in rats. Liver Int 2015; 35: 914-24.
16. Jiang W, Hu M, Rao J, Xu X, Wang X, Kong L. Over-expres-sion of Toll-like receptors and their ligands in small-for-size graft.Hepatol Res 2010; 40: 318-29.
17. Jiang W, Liu J, Dai Y, Zhou N, Ji C, Li X. MiR-146b attenuates high-fat diet-induced non-alcoholic steatohepatitis in mice. J Gastroenterol Hepatol 2015; 30: 933-43.
18. Jiang W, Liu G, Tang W. MicroRNA-182-5p Ameliorates Liver Ischemia-Reperfusion Injury by Suppressing Toll-Like Recep-tor 4. Transplant Proc 2016; 48: 2809-14.
19. Qin SB, Peng DY, Shi Y, Ke ZP. MiR-182-5p Inhibited Oxida-tive Stress and Apoptosis Triggered by Oxidized Low-Den-sity Lipoprotein via Targeting Toll-Like Receptor 4. J Cell Physiol 2017 [Epub ahead of print].
20. Xu S,Witmer PD, Lumayag S, Kovacs B, Valle D. MicroRNA (miRNA) transcriptome of mouse retina and identification of a sensory organ-specific miRNA cluster. J Biol Chem 2007; 282: 25053-66.
21. Li H, Kloosterman W, Fekete DM. MicroRNA-183 family mem-bers regulate sensorineural fates in the inner ear. J Neuros-ci 2010; 30: 3254-63.
22. Guttilla IK,White BA. Coordinate regulation of FOXO1 by miR-27a, miR-96, and miR-182 in breast cancer cells. J Biol Chem 2009; 284: 23204-16.
23. Chiang CH, Hou MF, HungWC. Up-regulation of miR-182 by â-catenin in breast cancer increases tumorigenicity andinva-siveness by targeting the matrix metalloproteinase inhibitor RECK.Biochim Biophys Acta 2013; 1830: 3067-76.
24. Rasheed SA, Teo CR, Beillard EJ, Voorhoeve PM, Casey PJ. MicroRNA-182 and microRNA-200a control G-protein subu-nit alpha-13 (GNA13) expression and cell invasion synergis-tically in prostate cancer cells. J Biol Chem 2013; 288: 7986-95.
25. Li Y, Chen S, Shan Z, Bi L, Yu S, Li Y, Xu S. miR-182-5p im-proves the viability, mitosis, migration, and invasion ability of human gastric cancer cells by down-regulating RAB27A. Bi-osci Rep 2017; 37: pii: BSR20170136.
26. Zhou X, Zhang C, Zhang C, Peng Y, Wang Y, Xu H. MicroR-NA-182-5p Regulates Nerve Injury-induced Nociceptive Hy-persensitivity by Targeting Ephrin Type-b Receptor 1.
Anesthesiology 2017; 126: 967-77.
Correspondence and reprint request:
Weiwei Jiang, M.D.
Department of Neonatal Surgery, Children’s Hospital of Nanjing Medical University,