This Provisional PDF corresponds to the article as it appeared upon acceptance. Fully formatted PDF and full text (HTML) versions will be made available soon.
Mitochondrial genomes reveal an explosive radiation of extinct and extant bears
near the Miocene-Pliocene boundary
BMC Evolutionary Biology 2008, 8:220 doi:10.1186/1471-2148-8-220 Johannes Krause (krause@eva.mpg.de)
Tina Unger (tina.unger@medizin.uni-leipzig.de) Aline Nocon (nocon@eva.mpg.de)
Anna-Sapfo Malaspinas (sapfo@berkeley.edu) Sergios-Orestis Kolokotronis (koloko@amnh.org)
Mathias Stiller (stiller@eva.mpg.de)
Leopoldo Soibelzon (lsoibelzon@fcnym.unlp.edu.ar) Helen Spriggs (hs397@cam.ac.uk)
Paul H Dear (phd@mrc-lmb.cam.ac.uk) Adrian W Briggs (briggs@eva.mpg.de) Sarah CE Bray (sarah.bray@adelaide.edu.au)
Stephen J O'Brien (obrien@ncifcrf.gov) Gernot Rabeder (gernot.rabeder@univie.ac.at)
Paul Matheus (matheus@northwestel.net) Alan Cooper (alan.cooper@adelaide.edu.au) Montgomery Slatkin (slatkin@socrates.berkeley.edu)
Svante Paabo (paabo@eva.mpg.de) Michael Hofreiter (hofreite@eva.mpg.de)
ISSN 1471-2148 Article type Research article Submission date 4 April 2008 Acceptance date 28 July 2008
Publication date 28 July 2008
Article URL http://www.biomedcentral.com/1471-2148/8/220
Like all articles in BMC journals, this peer-reviewed article was published immediately upon acceptance. It can be downloaded, printed and distributed freely for any purposes (see copyright
notice below).
BMC Evolutionary Biology
© 2008 Krause et al., licensee BioMed Central Ltd.
Articles in BMC journals are listed in PubMed and archived at PubMed Central.
For information about publishing your research in BMC journals or any BioMed Central journal, go to http://www.biomedcentral.com/info/authors/
BMC Evolutionary Biology
© 2008 Krause et al., licensee BioMed Central Ltd.
Mitochondrial genomes reveal an explosive radiation of extinct and
extant bears near the Miocene-Pliocene boundary
Johannes Krause1, Tina Unger1, Aline Noçon1, Anna-Sapfo Malaspinas2, Sergios-Orestis
Kolokotronis3,4, Mathias Stiller1, Leopoldo Soibelzon5
, Helen Spriggs6, Paul H. Dear6, Adrian
W. Briggs1, Sarah C. E. Bray7, Stephen J. O’Brien8, Gernot Rabeder9, Paul Matheus10, Alan
Cooper7, Montgomery Slatkin2, Svante Pääbo1 and Michael Hofreiter1§
1
Max Planck Institute for Evolutionary Anthropology, Deutscher Platz 6, D-04103 Leipzig,
Germany. 2
Department of Integrative Biology, University of California, Berkeley, CA 94720-3140,
USA. 3
Department of Ecology, Evolution and Environmental Biology, Columbia University, 1200
Amsterdam Avenue, MC5557, New York, NY 10027, USA 4
Sackler Institute for Comparative Genomics, American Museum of Natural History, Central
Park West at 79th Street, New York, NY 10024, USA 5
Departamento Científico Paleontologia de Vertebrados, Museo de La Plata. Paseo del
Bosque, (1900) La Plata, Buenos Aires, Argentina 6
MRC Laboratory of Molecular Biology, Hills Road, Cambridge CB2 2QH, UK. 7
Australian Centre for Ancient DNA, School of Earth and Environmental Sciences,
University of Adelaide, Adelaide, SA 5005, Australia 8
Laboratory of Genomic Diversity, National Cancer Institute, Frederick, MD 21702-1201,
USA. 9
Department of Paleontology, University of Vienna, 1090 Vienna, Austria. 10
Alaska Quaternary Center, University of Alaska Fairbanks, Fairbanks, AK 99775, USA.
§
Abstract
Background
Despite being one of the most studied families within the Carnivora, the
phylogenetic relationships among the members of the bear family (Ursidae)
have long remained unclear. Widely divergent topologies have been suggested
based on various data sets and methods.
Results
We present a fully resolved phylogeny for ursids based on ten complete
mitochondrial genome sequences from all eight living and two recently extinct
bear species, the European cave bear (Ursus spelaeus) and the American giant
short-faced bear (Arctodus simus). The mitogenomic data yield a well-resolved
topology for ursids, with the sloth bear at the basal position within the genus
Ursus. The sun bear is the sister taxon to both the American and Asian black
bears, and this clade is the sister clade of cave bear, brown bear and polar bear
confirming a recent study on bear mitochondrial genomes.
Conclusions
Sequences from extinct bears represent the third and fourth Pleistocene
species for which complete mitochondrial genomes have been sequenced.
Moreover, the cave bear specimen demonstrates that mitogenomic studies can
be applied to Pleistocene fossils that have not been preserved in permafrost,
and therefore have a broad application within ancient DNA research. Molecular
dating of the mtDNA divergence times suggests a rapid radiation of bears in
both the Old and New Worlds around 5 million years ago, at the
Messinian crisis and the first opening of the Bering Strait, and suggests a
global influence of such events on species radiations.
Background
The bear family (Ursidae) is one of the most studied families within the order Carnivora.
Members of this family are present on most continents and occupy a wide range of ecological
niches from the arctic ice shelves to tropical rainforests (see Additional File 1, Figure S1a).
Despite numerous morphological and molecular studies on the phylogenetic relationship
among Ursidae members, no consensus exists with regard to either their phylogeny or their
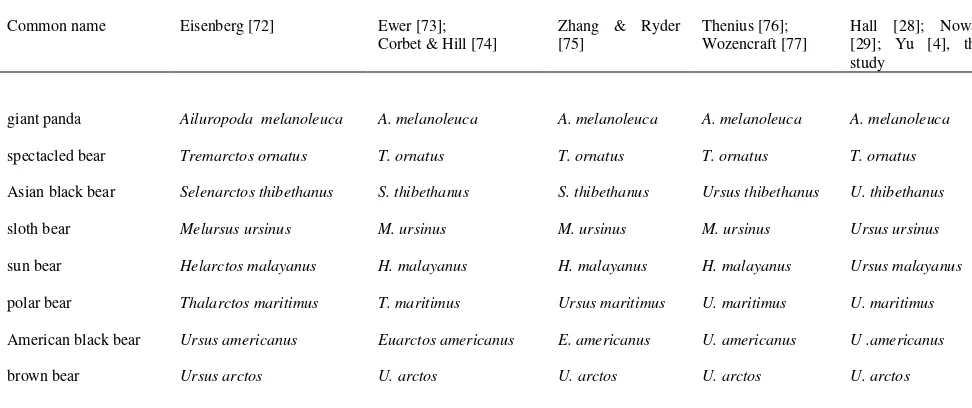
taxonomic nomenclature (Table 1). Most analyses have concentrated on the eight extant bear
species: brown bear, American black bear, Asian black bear, polar bear, sun bear, sloth bear,
spectacled bear and giant panda (for species names see Table 1). Molecular studies based on
mitochondrial and nuclear DNA from modern bears have recently provided convincing
evidence about several of the controversial relationships among the bears, such as the basal
positions of the giant panda and the spectacled bear in the bear tree [1-4] and the position of
the polar bear within the brown bear tree making the later paraphyletic [5, 6]. However,
molecular studies for a long time failed to conclusively resolve the phylogenetic relationships
among the members of the bear subfamily Ursinae [5], which includes all living bear species
except the giant panda and the spectacled bear, from here on referred to as ursine bears. The
phylogenetic uncertainty has resulted in major taxonomic confusion. Based on both
morphological and molecular data up to six different genera (Ursus, Helarctos, Euarctos,
Selenartos, Thalarctos and Melursus; i.e. one for each species) have been suggested for the
extant ursine bears (Table 1).
Recently, a study on mitochondrial genome sequences (mtDNAs) of all extant bears presented
problematic nodes in the bear family tree, except for the position of the sloth bear [4]. This
shows that longer sequences are necessary for reconstructing a robust phylogeny [4, 6-9].
Such large data sets also facilitate the molecular dating of divergence events within a
phylogeny [12-14]. To resolve the relationships between the extant and extinct members of
the bear family and to date the various divergence events among them, we used the complete
mtDNA (consisting of ~ 17kb) from ten different bear species. In addition to three published
modern mtDNAs [10], we amplified and sequenced five modern bear mtDNAs using a 2-step
multiplex PCR approach [9, 16]. We also amplified and sequenced entire mtDNAs from the
extinct European cave bear (Ursus spelaeus), believed to belong to the ursine bears [11], and
the extinct North American giant short-faced bear (Arctodus simus) (see Additional File 1,
Figure S1b), thought to be related to the spectacled bear [12].
Results
Sequence retrieval
We retrieved complete mtDNAs from GenBank for three extant bear species: brown bear,
American black bear and polar bear (GenBank:NC003427, GenBank:NC003428,
GenBank:NC003426). For the remaining five living bear species, we sequenced the entire
mtDNA in overlapping fragments using a 2-step multiplex PCR approach [7] and a mixture of
direct sequencing and sequencing multiple clones (EMBL:FM177759, EMBL:FM177761,
EMBL:FM177763, EMBL:FM177764, EMBL:FM177765). We also obtained the complete
mtDNA from the extinct European cave bear using a 44,000 year old bone found in
Gamssulzen Cave, Austria. Again, we used a 2-step multiplex approach, but in this case, all
PCR products were cloned and multiple clones were sequenced (EMBL:FM177760).
Moreover, to ensure sequence accuracy, we determined each sequence position from at least
sequences from each of the two amplifications we performed a third amplification and used
the consensus sequence from all three amplifications (see Additional File 1). We used the
same approach to sequence the extinct American giant short-faced bear mtDNA, using a
22,000 year-old calcaneum bone from Eldorado Creek, Canada (EMBL:FM177762). In order
to further ascertain that the results obtained are reproducible, samples of both extinct bears
were extracted, amplified and sequenced each in an additional laboratory that did not have
access to the results obtained in Leipzig. For the cave bear a total of 3,520bp were
independently reproduced in Cambridge and for the American giant short-faced bear a total of
395bp was replicated in the Australian Centre for Ancient DNA in Adelaide. The consensus
sequences for all fragments determined in Cambridge were identical to those determined in
Leipzig. The replicated fragments at the Australian Centre for Ancient DNA were identical to
the sequence obtained in Leipzig except for a single deletion close to the 5’-end of the light
strand in the first fragment. The sequence for this fragment was obtained by direct sequencing
in just one 5’ to 3’direction on the light strand. Given that sequence accuracy immediately
downstream the sequencing primer is low, it is likely that this deletion represents a
sequencing artifact.
Phylogenetic analyses
All ten bear mtDNAs were aligned using the harbor seal (Phoca vitulina) mtDNA as
outgroup. Phylogenetic trees were reconstructed using maximum parsimony (MP), maximum
likelihood (ML) and Bayesian inference. We recovered the same topology using all
above-mentioned optimality criteria (Figure 1 and Table 2). Our results confirm the giant panda’s
basal position in the bear phylogeny [1-4, 14-17] and also place the spectacled bear outside
ursine bears. In contrast to previous studies our data was sufficient to resolve the phylogenetic
relationships among ursine bears with statistical support for all nodes. The sloth bear falls
support (MP symmetric resampling, ML bootstrap, and 1.00 Bayesian posterior probability
(PP), respectively). The hypothesis suggesting that the sloth bear is basal to the sun bear and
black bear clade (hypothesis 6, see Additional File 1, Figure S2) did not have a significantly
worse likelihood (AU test, p = 0.147) than the topology favored by our data (sloth bear as the
most basal ursine bear; hypothesis 9, see Additional File 1, Figure S2) although it had a
slightly higher homoplasy index and a less parsimonious tree (HIbest = 0.389, HIcompeting =
0.393; TLbest = 10092, TLcompeting = 10157). In a MP analysis, however, this hypothesis
(hypothesis 6, see Additional File 1, Figure S2) received significantly less support (Wilcoxon
signed-ranks and sign tests, p < 10-4). Thus, we suggest that ursine bears are separated into
two sister clades, comprised of three species each with the sloth bear forming the basal
branch. The first clade contains cave, brown, and polar bears and is supported by all methods.
The second clade is composed of the sun and black bears (American and Asian) and receives
varying support values, depending on the tree reconstruction method (76% MP symmetric
resampling, 97% ML bootstrap, and 1.00 Bayesian PP). Finally, the placement of the extinct
American giant short-faced bear as a sister taxon to the spectacled bear is supported in all
analyses (100% bootstrap/symmetric resampling and 1.00 PP in all analyses).
The phylogenetic reconstruction makes evident a difficulty in resolving the relationships
within ursine bears. As a matter of fact, most of the internal branches are very short. This
observation (Fig. 2) makes it likely that individual genes (or short sequences) may exhibit
different tree topologies, as shown for humans, chimpanzees and gorillas [18]. In our case, we
notice that individual loci of the mtDNA support different topologies. Genes such as 12S
rRNA, ND4L, ND5, and ND3 exhibited phylogenetic incongruence with two to four other
mitochondrial genes (ILD test, p ≤ 0.05). The highest amount of phylogenetic conflict
emerged from partitioning the mtDNA to individual genes and the tRNAs of the two strands
(node t3 HBS = -10, node t5 HBS = -5). Emerging support was evident for all terminal nodes
including the ursine branching point (HBS range: 7–21). Intra-ursine nodes t5, t8, and t9 were
the only nodes to show <100% replicate-based support values, a fact that may be owed to the
lack of consistent support provided by those genes (PHBS range: -1 to -7).
Estimation of divergence times
We used several fossil calibration points to estimate the mtDNA divergence dates within the
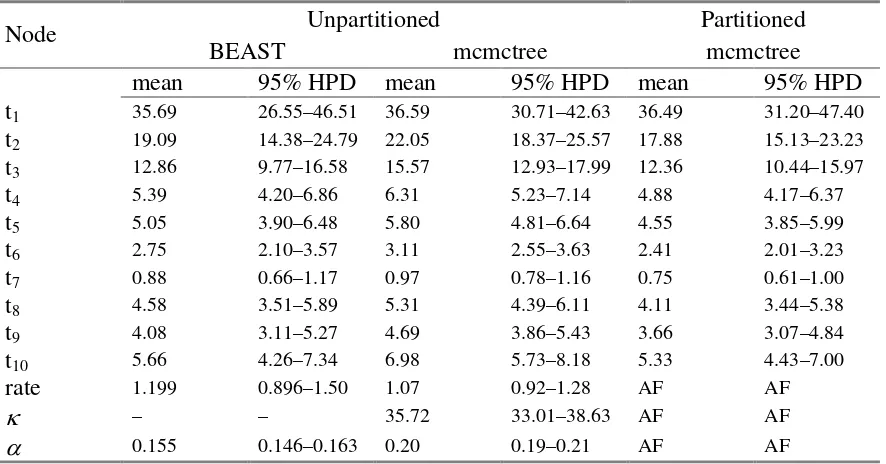
bears (see Materials and Methods). The posterior mean of the divergence time between bears
and the harbor seal was estimated at 36 million years ago (Ma), which agrees with previous
estimates based on both molecular and paleontological data [12, 19]. However, due to the
wide uniform priors we used for the calibration points, the confidence interval (26.5–47.4 Ma,
Table 3) remains large, depending on the type of analysis. The initial divergence within bears
occurred between the giant panda and all remaining bears, estimated to have happened
between 17.9 and 22.1 Ma (range of posterior means across analyses). The next divergence
was that of the New World spectacled bear group, which separated from the main ursine bear
lineage about 12.4 to 15.6 Ma. The posterior mean divergence of the two New World species,
the extant spectacled and the extinct American giant short-faced bear, was estimated to have
happened between 5.3 and 7 Ma. Within the remaining ursine bears, the estimated divergence
times all show overlapping confidence intervals, except for those within the brown bear clade.
Within the brown bear clade, we dated the divergence event between the cave and brown bear
mtDNA to 2.4–3.1 Ma. The origin of the polar bear is more difficult to determine, as partial
mtDNA sequences suggest that polar bears actually fall within the genetic diversity spectrum
of brown bears [20, 21], where they constitute a monophyletic clade closely related to a clade
of brown bears from the ABC Islands in Alaska. Unfortunately, the published brown bear
divergence for polar bears and brown bears is not a minimum date for this event, but rather
the divergence date for different brown bear clades. As a consequence, the estimated
divergence date of 2.7 and 1.3 Ma for brown and polar bears obtained in two recent studies [4,
19] using the same complete mtDNAs should be interpreted with care. A mtDNA from an
ABC island brown bear will be required to date the actual speciation event of polar bears
more accurately.
We also examined whether more sequence data would improve our estimates on divergence
times by plotting the posterior means of divergence times against the width of their
corresponding 95% credibility interval (see Additional File 1, Figure S3), following Yang and
Rannala [22]. We found significant correlations for both the unpartitioned and partitioned
datasets (p < 2.2 ×10⁻¹⁶). This linear relationship strongly suggests that longer sequences or
more taxa than those examined here are unlikely to increase the precision of the divergence
time estimates. Therefore, in order to narrow the confidence intervals for the divergence date
estimates within the bear phylogeny, more precisely dated fossil calibration points would be
required.
The estimated substitution rate of approximately 10-8 substitutions/site/year was more similar
to a mitogenomic dataset from primates than to the rate from extant and extinct proboscideans
[9]. This evolutionary rate was also higher than that for parts of the nuclear IRBP gene in
bears (0.139 ×10⁻⁸ substitutions/site/year; [17]).
Discussion
Our study represents the first comprehensive sampling of mtDNAs for recent bears, including
short-faced bear are the third and fourth Pleistocene species for which mtDNAs have been
determined. Moreover, the cave bear genome is the first determined from a Pleistocene
sample obtained from a non-permafrost environment. Compared to the extinct moas from
which complete mtDNAs have previously been determined from non-permafrost specimens
[23], the cave bear genome extends the time frame by an order of magnitude, showing that
complete mtDNA analysis can be performed using a wide range of samples. As is common in
large scale ancient DNA analyses [7, 9, 24], we found a number of consistent differences
between independent primary PCRs, all of which were either C to T or G to A substitutions
(see Additional File 1). This confirms previous reports that deamination of cytosine is one of
the most common, and probably the only type of miscoding lesion in ancient DNA [13,
24-26]. Moreover, the high number of consistent substitutions (81) observed in the cave bear
genome sequences shows that each sequence position needs to be replicated when performing
such large scale analyses.
This analysis has allowed the phylogenetic topology of the bear family to be resolved with
high support values. Interestingly, it places the sloth bear basal to all other ursine bear species
and the sun bear in a sister group related to the two black bear species. The latter observation
coincides with paleontological information [27] and previous mtDNA studies [4, 17, 21]. An
earlier study analysing six mtDNA fragments, also placed the sloth bear basal to all other
members of the ursine bears [3]. However, this study found weak support for the sun bear as
being basal to the brown bear – polar bear clade rather than to the two black bear species.
The phylogenetic reconstruction also reveals the reasons for previous problems in resolving
the relationships among ursine bears, as most of the internal branches for their phylogenetic
tree are very short. Such a short internal branch structure (Figure 1) makes it likely that
for nuclear loci from humans, chimpanzees and gorillas [18]. Furthermore it was previously
shown that despite being a non-recombining single genetic locus, individual genes on the
mtDNA might produce different tree topologies [6, 8, 9, 18].
The mitogenomic data also has implications for bear taxonomy. Six ursine bears and the sloth
bear are monophyletic with absolute support, which agrees with Hall and Nowak’s inclusion
(Table 1) of the Asian black bear, American black bear, sun bear, polar bear and brown bear
within the genus Ursus [28, 29] and confirms the mitogenomic study by Yu et al [4]. Given
the short divergence time of the six ursine bears and the sloth bear we suggest, following Hall
1981, Nowak 1991 and Yu et al 2007 [4, 28, 29], that the sloth bear is grouped together with
the other ursine bears in the genus Ursus and that the other genus names previously suggested
for members of this radiation are discarded (Table 1).
Using this data set and multiple fossil calibration points, we have dated the various mtDNA
divergence events during bear evolution with reasonable confidence. Strikingly, the
divergence of the giant panda is estimated at about 19 Ma (95% HPD: 14.4–24.8 Ma, HPD:
highest posterior density). This estimate is much earlier than previously reported for the
divergence of the panda lineage from the Ursavus lineage based on teeth morphology of
Agriarctos fossils (12–15 Ma) [30]. The latter divergence date has been used in several
studies as a calibration point for dating bear radiations [2, 4, 35]. We decided not to use this
date as a calibration point, since the oldest known panda fossil, Ailuropoda microta, is less
than 2.4 million years old [31], and therefore allows no inference about the date of divergence
of this lineage. Moreover, the fossil record for both Ailuropoda and its potential ancestral
species from the genus Agriarctos is sparse, making an early Miocene divergence date for the
giant panda’s lineage plausible. Interestingly, the next divergence event is not until 13 Ma
radiation occurs. The American giant short-faced and spectacled bears diverged around 5.7
Ma, and the five ursine lineages diverged between 5.4 and 4.1 Ma (posterior mean age
estimates) (Figures 1 and 2).
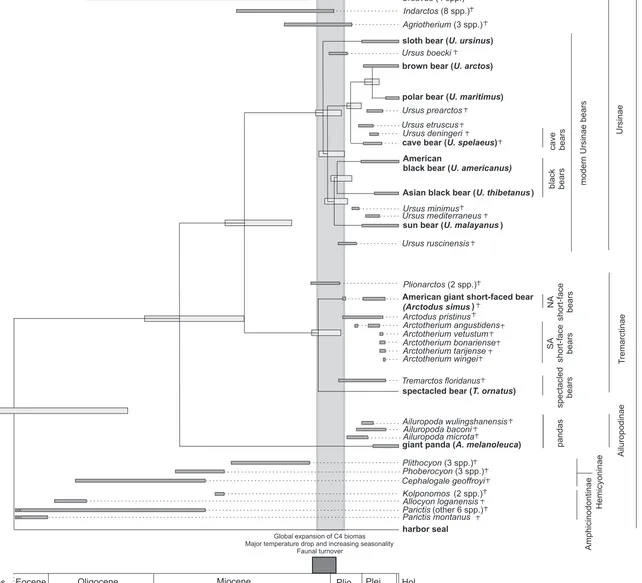
Thus, taking the confidence intervals for the molecular dating into account, seven lineages
radiated between 3.7 and 7 Ma. Such rapid radiations are also observed in other mammals,
such as the cats [32] and procyonids [33], as well as in bird families like the woodpeckers
[34]. Strikingly, the major radiation wave for these families also occurred at the end of the
Miocene. In combination with the fossil record, the mtDNA divergence estimates suggest that
the rapid radiation of the bear family around the Miocene-Pliocene boundary followed a major
extinction of some of the main bear genera such as Ursavus, Indarctos, Agriotherium, and the
Hemicyoninae (Figure 2). Similar species turnover events were also observed for other
mammals over a limited time span near the Miocene-Pliocene boundary resulting in a massive
extinction of more than 60-70% of all Eurasian genera and 70-80% of North American genera
[35]. The cause of this widespread species turnover during this time period remains unclear.
Some studies suggest that the initial opening of the Bering Strait at the beginning of the
Pliocene around 5.3 Ma caused a major separation of northern hemisphere habitats [36].
Major climatic changes occurred during that time, such as the Messinian crisis during which
the Mediterranean Sea lost its connection to the world ocean system and became desiccated
[37]. These changes resulted in forest cover decline and the spread of arid habitats in Northern
America and Eurasia [38, 39] as well as a global increase in C4 biomass [40]. During that
time, open grassland habitats, which were exploited by an entirely new suite of mammals
[40], replaced the earlier less seasonal woodland forest habitats. Thus, it is possible that the
environmental changes associated with the Miocene-Pliocene boundary and the following
emergence of new ecological niches such as open grasslands caused an adaptive radiation in
explain the divergence of the Tremarctinae with the spectacled bear adapted to closed habitats
and the American giant short-faced bears being predators dwelling in open habitats [12, 27].
The latter adaptation was also described in other predator species that evolved around the
Miocene-Pliocene boundary and were built for hunting in open habitats such as the cats [32,
35]. Other events such as the opening of the Bering Strait could have additionally promoted
allopatric speciation in black bears. Our divergence time estimates suggest that the American
black bear could have spread to America before the Bering Strait opened around 5.3 Ma [36].
An early migration of ursine bears into the Americas is also supported by the oldest known
Ursus fossil in North America, Ursus abstrusus [41], which was dated at 4.3 Ma, suggesting
that U. abstrusus may be ancestral to the American black bear lineage.
Obviously, the Miocene-Pliocene global changes had a major impact on the radiation of bears
and other species, both between and within the Old and New Worlds. It is interesting to note
that African apes experienced a similar species turnover at the end of the Miocene, including
the divergence of the chimpanzee and human lineages [42]. This latter event has been
attributed to a magnified climatic variability starting at the end of the Miocene [43]. More
studies are necessary to address the relationships between global changes and species
radiations at the beginning of the Pliocene. Our results strongly support the idea of a major
wave of bear radiations during that time.
Our data also indicate a much earlier divergence for the cave bear and brown bear lineages
than those previously assumed, with a mean estimate at 2.8 Ma. This date agrees with recent
results suggesting the existence of representatives of the brown bear lineage in Europe as
early as 1.5 Ma (G. Rabeder, personal observation). Nevertheless, it questions other studies
suggesting a later divergence time for this species pair at around 1.2–1.4 Ma based on the
Bouvet’s estimated divergence date for the two European brown bear lineages (Western and
Eastern) of 850 ka [45], which in turn was based on an application of Vigilant et al.’s [46]
intraspecific human rate of 8.4 ×10⁻⁸ substitutions/site/year – Taberlet & Bouvet cautioned
that their estimates could be prone to uncertainty as they imported a human evolutionary rate.
Given recent reports of problems in estimated intraspecific divergence times based on
interspecific calibrations and vice versa, the implicit use of indirectly extrapolated
evolutionary rates is not recommended [51, 52].
Most of the youngest fossils for Ursus etruscus, the assumed ancestor of the cave and brown
bear, have been dated to 2–2.7 Ma [47], suggesting that a late divergence for the two lineages
around 1.2 Ma is rather unlikely. These dates also partially overlap with the divergence date
we obtained (range of posterior means across methods: 2.4–3.1 Ma). A greater number of
reliably dated fossils from early members of both the cave bear and brown bear lineages are
necessary to date the divergence of U. spelaeus. However, around 2.8 Ma, the climate again
changed dramatically with the onset of the first major cooling events and climatic oscillations
at the end of the Pliocene that eventually led to the Pleistocene glaciations [48]. Thus, if bear
speciation events were influenced by climate change, cave bears and brown bears may indeed
have separated as early as 2.8 Ma.
Conclusions
Using complete mitochondrial genome sequences from both extinct and extant bears, we
found evidence for a rapid radiation of bears at the Miocene – Pliocene Boundary 5- 6 million
years ago within the Old and New worlds. As rapid radiations were also observed in other
species groups around this time [37-39], we suggest that climate change played an important
Our results clearly demonstrate the power of mitogenomic analyses for resolving complicated
phylogenetic relationships among both extant and extinct species, using samples obtained not
only from permafrost, but also from non-permafrost environments.
Methods
Ancient and modern DNA samples
The modern DNA samples of the Asian black bear, sloth bear and sun bear were obtained
from DNA stocks held at the National Cancer Institute, Laboratory of Genomic Diversity in
Frederick, Maryland (USA). The DNA samples of the giant panda and spectacled bear were
obtained from the National Fish & Wildlife Forensic Lab in Ashland, Oregon (USA).
In Leipzig, cave bear DNA was extracted from 640 mg of bone powder taken from a femur
found in Gamssulzen cave (Austria) that was dated to 44.160 +1.400/-1.190 BP (KIA 25287).
The extraction was performed as described previously [49], yielding 70 µl of DNA extract. In
Cambridge, 500 mg of cave bear bone was extracted using the same protocol as in Leipzig.
Details for the American giant short-faced bear DNA extraction performed in the Australian
Centre for Ancient DNA can be found in Additional File 1.
Multiplex amplification and sequencing
Primer pairs were designed by aligning the three published mtDNAs of brown bear, polar bear
and American black bear [10], and partial mtDNAs from various bear species retrieved from
GenBank. The revised Cambridge reference sequence for the human mtDNA [50] was also
included in the alignment. For the primers, regions were chosen that are highly conserved
the risk of human contamination. As previously described for the 2-step multiplex protocol [7,
51], the primer pairs for the first and second step were divided into two sets, ODD and EVEN,
to avoid amplifying the overlapping fragments between adjacent products. The two primer
sets were used in separate 2-step multiplex PCRs, as previously described [7]. The first
amplification step was performed in a total volume of 20 µl. Each reaction contained a final
concentration of 1x PCR-buffer, 4 mM MgCl2, 250 µM of each dNTP, 150 nM of each primer
from one set and 2 U AmpliTaq® Gold DNA polymerase plus 5 µl of the DNA extract. PCRs
were initiated by exposure to 94°C for 9 min, followed by 25 cycles of 20 s at 94°C, 30 s at
52°C and 1 min at 72°C. At the end, a final 4-min extension at 72°C was performed. This
amplification was then diluted 40 fold and 5 µl of the dilution were used as a template in each
of the single amplification reactions. Reagent concentrations were as described above, except
that a single primer pair was used at a concentration of 1.5 µM for each primer, and only 0.5
U of DNA polymerase were used in each reaction. The PCR temperature profile was the same
as in the first amplification step. Amplification products of the correct size for the two extinct
bears were cloned using the TOPO TA cloning kit (Invitrogen), and a minimum of three
clones were sequenced on an ABI3730 capillary sequencer (Applied Biosystems). For the
modern samples, PCR products were either sequenced from both directions, or multiple
clones were sequenced to ensure sequence accuracy. Primers for fragments that gave no
product in the first amplification attempts were redesigned if the adjacent fragments showed
substitutions in the primer site. The resulting primers were then used to amplify the remaining
segments of the bear genomes. For the two extinct bear species, each position of the mtDNA
was amplified at least twice from independent primary amplifications to ensure the
authenticity of the sequence [13]. For the cave bear a nested primer design was chosen where
the primers in the singleplex amplification are shifted inwards compared to the primers used
in the multiplex step. This design ensures specificity of the singleplex PCR and reduces the
are amplified to high copy numbers [51]. All primer sequences used can be found in
Additional File 1. For the sequenced modern bears and the cave bear primer sets EVEN and
ODD are comprised of 20 primer pairs each. A single primer pair, EVEN21, spanning a repeat
region within the D-loop, was excluded from both sets and only used in singleplex PCRs. For
the Giant short faced-bear 81 primer pairs were designed in total and split into two sets; all
amplification attempts spanning the repeat region within the D-loop for the American giant
short-faced bear failed.
In Cambridge, amplifications were completed using the same PCR conditions as in Leipzig,
but with a reduced number of primer pairs. Both water controls and an extraction control
consisting of a mammoth DNA extract were negative for cave bear-specific products.
Eighteen amplification products, originating from independent primary PCRs, were
sequenced in both directions for 9 different fragments distributed throughout the whole
mtDNA. A total of 3,520 bp were amplified and sequenced. The consensus sequences for all
fragments were identical to the corresponding sequences produced in Leipzig.
For the American giant short-faced bear in total 395 bp of the mtDNA were replicated in two
fragments at the Australian Centre for Ancient DNA. Details can be found in Additional File
1.
Mitochondrial genome sequence alignment and annotation
The newly sequenced mtDNAs for the two extinct and five extant bear species, as well as the
four publicly available genomes (three bears and a harbor seal) were aligned in MUSCLE 3.6
using the default parameters [52]. The D-loop was removed for all analyses, as it is too
variable for interspecific comparisons and could partially not be determined from the
following order: the transcription process; the three codon positions on each strand, the
tRNAs on each strand and the rRNA genes. A few nucleotides were duplicated in the
partitioned dataset because of the overlap of some loci, and a small number of non coding
nucleotides were excluded. The annotation was completed using the program DOGMA [53]
and modified manually to avoid overlap of tRNA and protein-coding genes.
Phylogenetic analyses
The substitution model was selected using Akaike’s Information Criterion on all models
available in the baseml program of PAML 3.15 [54]. For both the partitioned and the
unpartitioned datasets, the GTR+Γ [55-57] was found to be the best-fit model. This model
was used in all subsequent analyses unless specified otherwise.
The phylogeny of the mtDNAs was reconstructed using a thorough maximum parsimony
(MP) search that is implemented in TNT [58], with 500 random-addition sequences and a
variety of tree space exploration techniques. We also employed maximum likelihood (ML) in
RAxML 2.2.3 [59], as well as a Bayesian inference (BI) of phylogeny in MrBayes 3.1.2 [60].
The GTR+Γ4 substitution model was used for both ML and BI analyses. Phylogenetic support
was provided with 1000 bootstrap pseudoreplicates in ML and 5,000 replicates of symmetric
resampling in MP. MrBayes was run twice for 3 million generations with a burn-in of 2,500
steps. For details, see Additional File 1.
Incongruence between individual partitions was evaluated in an MP framework employing
variations of Bremer support measures, as implemented in Automated Simultaneous Analysis
of Phylogenies [61], as well as with the ILD test [62]. Agreement or disagreement between
negative hidden branch support (HBS) values, respectively [63]. See Additional File 1 for
further details.
Contrasting alternative phylogenetic hypotheses
We collected 10 alternative topologies on the phylogenetic relationships of bears from the
available literature (see Additional File 1, Figure S2) and compared them in an ML
framework using the approximately unbiased test (AU) [64] in CONSEL [65], along with a
comparison of homoplasy indices and tree lengths.
Estimation of divergence times
Dating of the divergence events within bears was done using a molecular clock approach and
several fossil calibration points. The minimum for the divergence of bears and sealswas set to
33.9 Ma, based on the fossil species Parictis montanus [66] and Parictis parvus [67] both
dated to 38–33.9 Ma, and the first well-described members on the bear lineage. As a second
calibration point, the minimum age for the oldest described Ursus fossils, U. minimus and U.
ruscinensis, at 4.2 Ma [47] was used, and the maximum for the youngest fossils from the
genus Ursavus, U. depereti and U. ehrenbergi,, which gave rise to the Ursus lineage [11], at
7.1 Ma [47].
The above mentioned calibration points were used as priors to obtain the posterior distribution
of the estimated divergence times. Evolutionary rate constancy according to a molecular clock
for all bear mtDNAs, including the harbor seal outgroup, was tested using a likelihood ratio
test (LRT) in baseml [68]. The assumption of a molecular clock at the 1% level under a
GTR+Γ model for the whole mtDNA alignment excluding the D-loop for the partitioned (–
2δL = 14.3, p = 0.112) and unpartitioned (–2δL = 18.0, p = 0.036) dataset could not be
We estimated divergence times using two Bayesian approaches implemented in the programs
mcmctree [54] and BEAST 1.4.4 [69] . Mcmctree was run using the HKY85+Γ8 substitution
model [57, 70], the most parameter-rich model available in this program. A total of 105
generations were sampled every 5 steps after discarding 104 initial steps as burn-in. The more
parameter-rich model GTR+Γ4 was used in BEAST with the following priors: Yule speciation
prior on the tree, siteModel.alpha (initial = 0.2, exponential prior with mean 1.0 and 95% CI
of 0.05129–2.996), clock.rate (initial = 0.015, uniform prior of 0–10), root.height of ursine
bear clade (uniform prior of 7.1–4.2 Ma based on the basal ursine bear radiation fossil data).
Thirty million Markov chain Monte Carlo (MCMC) steps were sampled every 1,000
generations. Convergence was assessed in Tracer v1.3 [71] after excluding the first 5 million
samples as burn-in. All effective sample size values exceeded 20,000, suggesting a sufficient
run length. The strict clock was implemented in all divergence time estimations, as suggested
by the LRT.
Authors’ contributions
JK, TU, AN, AWB, SJB, PHD, HS and MS were responsible for the experimental work. JK,
ASM and SOK performed the sequence and evolutionary analyses. GR and PM obtained the
ancient bear specimens and arranged the dating. LS contributed paleontological information
on the bear fossil record. SJO provided extant bear DNA. AC, SP, JK, MSlatkin and MH
conceived ideas for this project. JK, ASM, SOK and MH wrote the manuscript. All authors
Acknowledgements
SB and AC were supported by the ARC, and gratefully acknowledge the assistance of the
Canadian Museum of Nature, and D. Harington for the sample of the Arctodus specimen. We
thank S. Giesser for help with the species distribution map design. JK, TU, AN, MS, AWB,
SP and MH thank the Max Planck Society for financial support. SOK was supported by an
AMNH Conservation Genetics Research Fellowship. ASM and MSlatkin were supported by
References
1. Fulton TL, Strobeck C: Molecular phylogeny of the Arctoidea (Carnivora): effect
of missing data on supertree and supermatrix analyses of multiple gene data sets.
Mol Phylogenet Evol 2006, 41:165-181.
2. Talbot SL, Shields GF: A phylogeny of the bears (Ursidae) inferred from complete
sequences of three mitochondrial genes. Mol Phylogenet Evol 1996, 5:567-575. 3. Waits LP, Sullivan J, O'Brien SJ, Ward RH: Rapid radiation events in the family
Ursidae indicated by likelihood phylogenetic estimation from multiple fragments of mtDNA. Mol Phylogenet Evol 1999, 13:82-92.
4. Yu L, Li YW, Ryder OA, Zhang YP: Analysis of complete mitochondrial genome
sequences increases phylogenetic resolution of bears (Ursidae), a mammalian family that experienced rapid speciation. BMC Evol Biol 2007, 7:198.
5. McKenna MC, Bell SK: Classification of Mammals above the Species Level. New York: Columbia University Press; 1997.
6. Cummings MP, Otto SP, Wakeley J: Sampling properties of DNA sequence data in
phylogenetic analysis. Mol Biol Evol 1995, 12:814-822.
7. Krause J, Dear PH, Pollack JL, Slatkin M, Spriggs H, Barnes I, Lister AM, Ebersberger I, Paabo S, Hofreiter M: Multiplex amplification of the mammoth mitochondrial genome and the evolution of Elephantidae. Nature 2006, 439:724-727.
8. Rogaev EI, Moliaka YK, Malyarchuk BA, Kondrashov FA, Derenko MV, Chumakov
I, Grigorenko AP: Complete mitochondrial genome and phylogeny of Pleistocene mammoth Mammuthus primigenius. PLoS Biol 2006, 4:e73.
9. Rohland N, Malaspinas AS, Pollack JL, Slatkin M, Matheus P, Hofreiter M:
Proboscidean mitogenomics: chronology and mode of elephant evolution using mastodon as outgroup. PLoS Biol 2007, 5:e207.
10. Delisle I, Strobeck C: Conserved primers for rapid sequencing of the complete mitochondrial genome from carnivores, applied to three species of bears. Mol Biol Evol 2002, 19:357-361.
11. Kurten B: The Cave Bear Story, life and death of a vanished animal. New York:
Columbia University Press; 1976.
12. Hunt RMJ: Ursidae. In: Evolution of Tertiary Mammals of North America. Volume 1.
Edited by Janis CM, Scott KM, Jacobs LL. Cambridge: Cambridge University Press; 1998: 174−195.
13. Hofreiter M, Jaenicke V, Serre D, Haeseler Av A, Pääbo S: DNA sequences from multiple amplifications reveal artifacts induced by cytosine deamination in ancient DNA. Nucleic Acids Res 2001, 29:4793-4799.
14. Delisle I, Strobeck C: A phylogeny of the Caniformia (order Carnivora) based on
12 complete protein-coding mitochondrial genes. Mol Phylogenet Evol 2005, 37:192-201.
15. Nash WG, O'Brien SJ: A comparative chromosome banding analysis of the
Ursidae and their relationship to other carnivores. Cytogenet Cell Genet 1987, 45:206-212.
16. O'Brien SJ, Nash WG, Wildt DE, Bush ME, Benveniste RE: A molecular solution to
the riddle of the giant panda's phylogeny. Nature 1985, 317:140-144.
17. Yu L, Li QW, Ryder OA, Zhang YP: Phylogenetic relationships within mammalian
18. O'Huigin C, Satta Y, Takahata N, Klein J: Contribution of homoplasy and of ancestral polymorphism to the evolution of genes in anthropoid primates. Mol Biol Evol 2002, 19:1501-1513.
19. Arnason U, Gullberg A, Janke A, Kullberg M: Mitogenomic analyses of caniform relationships. Mol Phylogenet Evol 2007, 45:863-874.
20. Shields GF, Adams D, Garner G, Labelle M, Pietsch J, Ramsay M, Schwartz C, Titus
K, Williamson S: Phylogeography of mitochondrial DNA variation in brown bears and polar bears. Mol Phylogenet Evol 2000, 15:319-326.
21. Talbot SL, Shields GF: Phylogeography of brown bears (Ursus arctos) of Alaska and paraphyly within the Ursidae. Mol Phylogenet Evol 1996, 5:477-494.
22. Yang Z, Rannala B: Bayesian estimation of species divergence times under a molecular clock using multiple fossil calibrations with soft bounds. Mol Biol Evol
2006, 23:212-226.
23. Cooper A, Lalueza-Fox C, Anderson S, Rambaut A, Austin J, Ward R: Complete mitochondrial genome sequences of two extinct moas clarify ratite evolution.
Nature 2001, 409:704-707.
24. Stiller M, Green RE, Ronan M, Simons JF, Du L, He W, Egholm M, Rothberg JM, Keates SG, Ovodov ND, Antipina EE, Baryshnikov GF, Kuzmin YV, Vasilevski AA, Wuenschell GE, Termini J, Hofreiter M, Jaenicke-Despres V, Paabo S: Patterns of nucleotide misincorporations during enzymatic amplification and direct large-scale sequencing of ancient DNA. Proc Natl Acad Sci U S A 2006, 103:13578-13584.
25. Briggs AW, Stenzel U, Johnson PL, Green RE, Kelso J, Prufer K, Meyer M, Krause J,
Ronan MT, Lachmann M, Paabo S: Patterns of damage in genomic DNA sequences from a Neandertal. Proc Natl Acad Sci U S A 2007, 104:14616-14621.
26. Brotherton P, Endicott P, Sanchez JJ, Beaumont M, Barnett R, Austin J, Cooper A: Novel high-resolution characterization of ancient DNA reveals C > U-type base modification events as the sole cause of post mortem miscoding lesions. Nucleic Acids Res 2007, 35:5717-5728.
27. Kurten B, Anderson E: Pleistocene Mammals of North America. New York: Columbia
University Press; 1980.
28. Hall ER: The Mammals of North America. 2nd Edition. New York: Ronald Press; 1981.
29. Nowak RM: Walker's Mammals of the World. Volume 2. 5th Edition. Baltimore: Johns
Hopkins University Press; 1991.
30. Thenius E: Zur systematischen und phylogenetischen Stellung des Bambusbaeren:
Ailuropoda melanoleuca. Z Saugetierk 1979, 44:286-305.
31. Jin C, Ciochon RL, Dong W, Hunt RM, Jr., Liu J, Jaeger M, Zhu Q: The first skull of the earliest giant panda. Proc Natl Acad Sci U S A 2007, 104:10932-10937.
32. Johnson WE, Eizirik E, Pecon-Slattery J, Murphy WJ, Antunes A, Teeling E, O'Brien
SJ: The late Miocene radiation of modern Felidae: a genetic assessment. Science
2006, 311:73-77.
33. Koepfli KP, Gompper ME, Eizirik E, Ho CC, Linden L, Maldonado JE, Wayne RK:
Phylogeny of the Procyonidae (Mammalia: Carnivora): molecules, morphology and the Great American Interchange. Mol Phylogenet Evol 2007, 43:1076-1095. 34. Fuchs J, Ohlson JI, Ericson PGP, Pasquet E: Synchronous intercontinental splits
between assemblages of woodpeckers suggested by molecular data. Zool Scripta
2007, 36:11-25.
35. Van Valkenburgh B: Major patterns in the history of carnivorous mammals.
AnnuRevEarthPlanetSci 1999, 27:463-493.
37. Hsü KJ, Montadert L, Bernoulli D, Cita MB, Erickson A, Garrison RE, Kidd RB, Mélières F, Müller C, Wright RH: History of the Mediterranean salinity crisis.
Nature 1977, 267:399-403
38. Fortelius M, Eronen J, Liu L, Pushkina D, Tesakov A, Vislobokova I, Zhang Z: Late
Miocene and Pliocene large land mammals and climatic changes in Eurasia.
Palaeogeogr Palaeoclimatol Palaeoecol 2006, 238.
39. Janis CM: Tertiary mammal evolution in the context of changing climates,
vegetation and tectonic events. Annu Rev Ecol Syst 1993, 24:467-500.
40. Cerling TE, Ehleringer JR, Harris JM: Carbon dioxide starvation, the development
of C4 ecosystems, and mammalian evolution. Philos Trans R Soc Lond B Biol Sci
1998, 353:159-170; discussion 170-151.
41. Gustafson PE: The vertebrate faunas of the Pliocene Ringold Formation, south-central Washington. Univ OR Mus Nat Hist Bull 1978, 23:1-62.
42. Kumar S, Filipski A, Swarna V, Walker A, Hedges SB: Placing confidence limits on
the molecular age of the human-chimpanzee divergence. Proc Natl Acad Sci U S A
2005, 102:18842-18847.
43. Potts R: Environmental hypotheses of hominin evolution. Am J Phys Anthropol
1998, Suppl 27:93-136.
44. Loreille O, Orlando L, Patou-Mathis M, Philippe M, Taberlet P, Hanni C: Ancient DNA analysis reveals divergence of the cave bear, Ursus spelaeus, and brown bear, Ursus arctos, lineages. Curr Biol 2001, 11:200-203.
45. Taberlet P, Bouvet J: Mitochondrial DNA polymorphism, phylogeography, and
conservation genetics of the brown bear Ursus arctos in Europe. Proc R Soc Lond B Biol Sci 1994, 255:195-200.
46. Vigilant L, Stoneking M, Harpending H, Hawkes K, Wilson AC: African populations
and the evolution of human mitochondrial DNA. Science 1991, 253:1503-1507.
47. Neogene of the Old World - Database of Fossil Mammals (NOW).
[http://www.helsinki.fi/science/now]
48. Jansen E, Fronval T, Rack F, Channel JET: Pliocene–Pleistocene ice rafting history
and cyclicity in the Nordic Seas during the last 3.5 Myr. Paleoceanography 2000, 15:709–721.
49. Hofreiter M, Rabeder G, Jaenicke-Despres V, Withalm G, Nagel D, Paunovic M, Jambresic G, Pääbo S: Evidence for reproductive isolation between cave bear populations. Curr Biol 2004, 14:40-43.
50. Andrews RM, Kubacka I, Chinnery PF, Lightowlers RN, Turnbull DM, Howell N: Reanalysis and revision of the Cambridge reference sequence for human mitochondrial DNA. Nat Genet 1999, 23:147.
51. Rompler H, Dear PH, Krause J, Meyer M, Rohland N, Schoneberg T, Spriggs H, Stiller M, Hofreiter M: Multiplex amplification of ancient DNA. Nat Protoc 2006, 1:720-728.
52. Edgar RC: MUSCLE: multiple sequence alignment with high accuracy and high
throughput. Nucleic Acids Res 2004, 32:1792-1797.
53. Wyman SK, Jansen RK, Boore JL: Automatic annotation of organellar genomes with DOGMA. Bioinformatics 2004, 20:3252-3255.
54. Yang Z: PAML: a program package for phylogenetic analysis by maximum
likelihood. Comput Appl Biosci 1997, 13:555-556.
55. Lanave C, Preparata G, Saccone C, Serio G: A new method for calculating evolutionary substitution rates. J Mol Evol 1984, 20:86-93.
57. Yang Z: Maximum-likelihood estimation of phylogeny from DNA sequences when substitution rates differ over sites. Mol Biol Evol 1993, 10:1396-1401.
58. Goloboff P, Farris J, Nixon K: TNT, a free program for phylogenetic analysis.
Cladistics 2008, 24:1-13.
59. Stamatakis A: RAxML-VI-HPC: maximum likelihood-based phylogenetic
analyses with thousands of taxa and mixed models. Bioinformatics 2006, 22:2688-2690.
60. Ronquist F, Huelsenbeck JP: MRBAYES 3: Bayesian phylogenetic inference under
mixed models. Bioinformatics 2003, 19:1572-1574.
61. Sarkar IN, Egan MG, Coruzzi G, Lee EK, DeSalle R: Automated simultaneous analysis phylogenetics (ASAP): an enabling tool for phylogenomics. BMC Bioinformatics 2008, 9:103.
62. Farris JS, Källersjö M, Kluge AG, Bult C: Testing significance of incongruence.
Cladistics 1994, 10:315-319.
63. Gatesy J, O'Grady P, Baker RH: Corroboration among data sets in simultaneous analysis: hidden support for phylogenetic relationships among higher level artiodactyl taxa. Cladistics 1999, 15:271-313.
64. Shimodaira H: An approximately unbiased test of phylogenetic tree selection. Syst
Biol 2002, 51:492-508.
65. Shimodaira H, Hasegawa M: CONSEL: for assessing the confidence of
phylogenetic tree selection. Bioinformatics 2001, 17:1246-1247.
66. Clark J, Guensburg TE: Arctoid genetic characters as related to the genus Parictis.
Fieldiana: Geology 1972, 26:1-76.
67. Clark J, Beerbower JR, Kietze KK: Oligocene sedimentation, stratigraphy,
paleoecology, and paleoclimatology in the Big Badlands of South Dakota.
Fieldiana Geol 1967, 5:1-158.
68. Felsenstein J: Evolutionary trees from DNA sequences: a maximum likelihood approach. J Mol Evol 1981, 17:368-376.
69. Drummond AJ, Rambaut A: BEAST: Bayesian evolutionary analysis by sampling
trees. BMC Evol Biol 2007, 7:214.
70. Hasegawa M, Kishino H, Yano T: Dating of the human-ape splitting by a
molecular clock of mitochondrial DNA. J Mol Evol 1985160-174.
71. Rambaut A, Drummond AJ: Tracer v1.3. Available from:
[http://tree.bio.ed.ac.uk/software/tracer] 2004.
72. Eisenberg JF: The Mammalian Radiations. Chicago: University of Chicago Press 1981.
73. Ewer RF: The Carnivora. Ithaca: Cornell University Press; 1973.
74. Corbet GB, Hill JE: A World List of Mammalian Species.London: Oxford University
Press; 1991.
75. Zhang YP, Ryder OA: Phylogenetic relationships of bears (the Ursidae) inferred from mitochondrial DNA sequences. Mol Phylogenet Evol 1994, 3:351-359.
76. Thenius E: Carnivores: phylogeny. In: Grizmek’s encyclopedia of mammals. Volume
3. Edited by Grizmek B. New York: McGraw Hill; 1990:370-464.
77. Wozencraft WC: Order Carnivora. In: Mammal Species of the World: A taxonomic
Figure legends
Figure 1– Maximum clade probability tree displayed as a chronogram from the
BEAST analysis of the unpartitioned mitochondrial genome alignment.
All lineages evolved according to a strict clock and the GTR+Γ4 substitution model. Numbers
above the nodes indicate phylogenetic support measures. Node bars illustrate the width of the
95% highest posterior density. Numbers in bold indicate the posterior mean estimates of
divergence times.
Figure 2 – Temporal ranges of extant and fossil bears.
Extinct genera and species are denoted with a cross (†). Species used in this study are written
in bold. Horizontal dark grey bars indicate temporal range based on fossil evidence.
Horizontal light grey bars show width of the 95% credibility interval for the molecular
divergence time (see also Figure 1). The vertical grey bar illustrates the range of the posterior
mean estimate of divergence times for all extant ursine bears (expect polar and brown bear) as
well as American giant short-faced bear and spectacled bear. The dark grey box illustrates a
Tables
Table 1– Taxonomic designations for the bears.
Common name Eisenberg [72] Ewer [73];
Corbet & Hill [74]
Zhang & Ryder [75]
Thenius [76]; Wozencraft [77]
Hall [28]; Nowak [29]; Yu [4], this study
giant panda Ailuropoda melanoleuca A. melanoleuca A. melanoleuca A. melanoleuca A. melanoleuca
spectacled bear Tremarctos ornatus T. ornatus T. ornatus T. ornatus T. ornatus
Asian black bear Selenarctos thibethanus S. thibethanus S. thibethanus Ursus thibethanus U. thibethanus
sloth bear Melursus ursinus M. ursinus M. ursinus M. ursinus Ursus ursinus
sun bear Helarctos malayanus H. malayanus H. malayanus H. malayanus Ursus malayanus
polar bear Thalarctos maritimus T. maritimus Ursus maritimus U. maritimus U. maritimus
American black bear Ursus americanus Euarctos americanus E. americanus U. americanus U .americanus
[image:28.595.70.381.421.564.2]brown bear Ursus arctos U. arctos U. arctos U. arctos U. arctos
Table 2– Node support values for the mitogenomic phylogeny of the bears.
Node Unpartitioned Partitioned
MP ML Bayesian ML Bayesian
t3 100 100 1.00 100 1.00
t4 100 100 1.00 100 1.00
t5 85 93 1.00 93 1.00
t6 100 100 1.00 100 1.00
t7 100 100 1.00 100 1.00
t8 76 94 1.00 97 1.00
t9 99 97 1.00 94 1.00
t10 100 100 1.00 100 1.00
Unpartitioned and partitioned phylogenetic analyses in maximum parsimony (MP), maximum
likelihood (ML) and Bayesian inference of phylogeny. In partitioned analyses every partition
was allowed to evolve under a separate unlinked GTR+Γ substitution model and distinct base
Table 3– Posterior estimates of divergence times.
Unpartitioned Partitioned
Node
BEAST mcmctree mcmctree
mean 95% HPD mean 95% HPD mean 95% HPD
t1 35.69 26.55–46.51 36.59 30.71–42.63 36.49 31.20–47.40 t2 19.09 14.38–24.79 22.05 18.37–25.57 17.88 15.13–23.23
t3 12.86 9.77–16.58 15.57 12.93–17.99 12.36 10.44–15.97
t4 5.39 4.20–6.86 6.31 5.23–7.14 4.88 4.17–6.37 t5 5.05 3.90–6.48 5.80 4.81–6.64 4.55 3.85–5.99 t6 2.75 2.10–3.57 3.11 2.55–3.63 2.41 2.01–3.23
t7 0.88 0.66–1.17 0.97 0.78–1.16 0.75 0.61–1.00 t8 4.58 3.51–5.89 5.31 4.39–6.11 4.11 3.44–5.38
t9 4.08 3.11–5.27 4.69 3.86–5.43 3.66 3.07–4.84
t10 5.66 4.26–7.34 6.98 5.73–8.18 5.33 4.43–7.00
rate 1.199 0.896–1.50 1.07 0.92–1.28 AF AF
κ
– – 35.72 33.01–38.63 AF AFα
0.155 0.146–0.163 0.20 0.19–0.21 AF AFThe two mcmctree columns correspond to the unpartitioned and partitioned analyses. The
divergence time estimates are in millions of years before present. HPD, highest posterior
density; rate, evolutionary rate (×10-8 substitutions/site/year);
κ
, transition–transversionparameter of the HKY model;
α
, shape parameter of the rate heterogeneity Γ-distribution. AF,see Additional File 1.
Additonal files
Additional file 1 Format: DOC
sloth bear (U. ursinus)
American giant short-faced bear )
(Arctodus simus
spectacled bear (T. ornatus)
Tremarctos floridanus Arctodus pristinus Arctotherium angustidens Arctotherium vetustum Arctotherium tarijense Arctotherium bonariense T remarctinae NA short-face bears SA short-face bears spectacled bears Arctotherium wingei
giant panda (A. melanoleuca)
Ursus minimus
brown bear (U. arctos)
polar bear (U. maritimus)
Asian black bear (U. thibetanus) American
black bear (U. americanus)
sun bear (U. malayanus) cave bear (U. spelaeus)
Ursus deningeri
cave bears
Ursus prearctos
pandas
harbor seal
black bears
Plionarctos (2 spp.)
Ailuropoda microta Ailuropoda baconi Ailuropoda wulingshanensis Ursus boecki Ursus ruscinensis Ursus mediterraneus Ursinae Ursidae Ailuropodinae
Global expansion of C4 biomas Major temperature drop and increasing seasonality
Faunal turnover
Ursavus (4 spp.)
Agriotherium (3 spp.)
Indarctos (8 spp.)
Ursus etruscus
modern Ursinae bears
Cephalogale geoffroyi Phoberocyon (3 spp.)
Plithocyon (3 spp.)
Parictis (other 6 spp.)
Allocyon loganensis Kolponomos (2 spp.)
Amphicinodontinae
Hemicyoninae
[image:31.720.63.705.11.594.2]Additional files provided with this submission:
Additional file 1: additional file 1_ proofs_bears.doc, 1336K