Self-regulated learning pro
fi
les in college students: Their relationship to
achievement, personality, and the effectiveness of an intervention to
foster self-regulated learning
Laura Dörrenbächer
⁎
, Franziska Perels
Department of Educational Sciences, Saarland University, 66123 Saarbrücken, Germany
a b s t r a c t
a r t i c l e i n f o
Article history: Received 2 March 2016
Received in revised form 6 September 2016 Accepted 29 September 2016
Available online xxxx
Self-regulated learning (SRL) is highly relevant for postsecondary academic success. Nevertheless, individual dif-ferences in SRL are found and can influence SRL training results. Conducting latent profile analyses withn= 337 college students, we found four SRL profiles that differed quantitatively and with regard to motivational subcom-ponents. Achievement was significantly higher for students with high SRL and high motivation. Moreover, the profiles differed with regard to personality as more skilled self-regulators showed lower test anxiety, lower neu-roticism, and higher values in extraversion, conscientiousness, agreeableness, and openness to experiences. Using a sample ofn= 55 students who participated in an eight-week SRL training, we investigated differential effects of the SRL profiles. Students with moderate and motivated SRL profiles benefited from the intervention, whereas students with low and high SRL profiles did not. The results speak in favor of developing adaptive train-ing programs dependtrain-ing on SRL profiles.
© 2016 Elsevier Inc. All rights reserved. Keywords:
Differential effects Self-regulated learning Training
Personality Latent profile analysis
1. Introduction
College learning is characterized by many autonomous learning sit-uations and therefore represents an unfamiliar learning environment for most students. The increasing prevalence of student burnout (Lin
& Huang, 2013) and the phenomenon of college dropout highlight the
important role of skills to handle such autonomous learning environ-ments. Self-regulated learning (hereinafter SRL), which is comprised of“self-generated thoughts, feelings and actions that are planned and cyclically adapted to the attainment of personal goals”(Zimmerman,
2000, p. 14), supports students in optimizing their learning processes.
SRL therefore has a positive impact on learning results (e.g.,Kitsantas, 2002) and well-being (Park, Edmondson, & Lee, 2012). Nevertheless, college students oftentimes show a deficit in knowledge and use of SRL strategies (Peverly, Brobst, Graham, & Shaw, 2003), which is why they have special need for support. Conducting trainings that directly teach SRL strategies has proved useful for fostering this skill in college students (e.g.,Dörrenbächer & Perels, 2016; Fabriz, Dignath-van Ewijk, Poarch, & Büttner, 2014).
Moreover, there is increasing evidence that individual differences in SRL exist (Barnard-Brak, Lan, & Osland Paton, 2010) and that they are related to achievement (Kitsantas, Winsler, & Huie, 2008) and personal-ity factors (Bidjerano & Dai, 2007). Because SRL research mostly has
adopted a variable-centered approach and therefore has neglected per-son-centered questions (Lapka, Wagner, Schober, Gradinger, & Spiel, 2011), the present study investigates the existence of SRL profiles in col-lege students. Within a person-centered framework (Niemivirta, 2002), we will analyze how these profiles relate to achievement and personal-ity differences. As an expansion of this correlational research question, we follow the aptitude-treatment-interaction approach (Snow, Corno, & Jackson, 1996) and investigate how these profiles influence the effec-tiveness of an SRL training program. Thus, the present study adds to research because it illuminates relationships of SRL profiles with indi-vidual factors and their impact on interventions to foster this highly rel-evant construct.
1.1. SRL and its relevance for college students
Self-regulated learning incorporates processes during which learners engage in thoughts, emotions, and actions that support achiev-ing personal learnachiev-ing goals (Zimmerman, 2011). Adopting a social-cog-nitive process view, SRL is defined as cyclical and dynamic. Therefore, the adaptation of learners' activities in response to changing personal, behavioral, and environmental factors during goal attainment is central
(Bandura, 1986).Zimmerman's (2000)social-cognitive model of SRL
includes three cyclical phases of forethought, performance, and refl ec-tion, which are linked through feedback loops and therefore emphasize the interaction of personal, environmental, and behavioral aspects
(Bandura, 1986). The forethought phase encompasses task analysis
that includes goal setting, time, and strategic planning. To initiate the
⁎ Corresponding author.
E-mail addresses:[email protected](L. Dörrenbächer), [email protected](F. Perels).
http://dx.doi.org/10.1016/j.lindif.2016.09.015 1041-6080/© 2016 Elsevier Inc. All rights reserved.
Contents lists available atScienceDirect
Learning and Individual Differences
actual learning activity, self-motivational thoughts, such as intrinsic mo-tivation, goal orientation, and self-efficacy, are necessary. The perfor-mance phase is comprised of volitional control processes to overcome procrastination tendencies and focus attention on the learning task. This is supported by the application of organization and elaboration learning strategies that increase understanding of learning materials. Ad-ditionally, self-observation is a critical component of the performance phase because it supports monitoring proceedings and helps detect mis-guided behavior. The cycle of self-regulation continues with the
self-re-flection phase, during which the preceding behavior is evaluated by causal attributions that can explain (non-)achievement of a goal. Adap-tive self-reactions support future behavioral optimization (for detailed description of the subcomponents, seeZimmerman, 2000). Because feedback loops are included in Zimmerman's model (Zimmerman, 2000), each learning action influences subsequent learning actions and helps the student improve goal attainment processes. In general, it can be said that SRL is comprised of cognitive, metacognitive, motivational, and volitional components (Dörrenbächer & Perels, 2015).
The self-directed acquisition of knowledge and its use and actualiza-tion in an adaptive way (Bronson, 2000) help students overcome diffi -culties in autonomous learning environments such as college. The relevance of SRL is underscored by results indicating a positive relation-ship between SRL strategy usage and academic achievement (see
Section 1.2). Because this relationship is found in different educational
groups (e.g.,Dignath, Büttner, & Langfeldt, 2008; Kitsantas et al., 2008), SRL is oftentimes regarded as a crucial component of lifelong learning (Lüftenegger et al., 2012). Several studies focusing on college students highlight the relevance of SRL for this group (Nandagopal & Ericsson, 2012; Tynjälä, Salminen, Sutela, Nuutinen, & Pitkänen, 2005). Accordingly, emotional correlates such as lower test anxiety (Kesici, Baloğlu, & Deniz, 2011) and reduced perceived stress (Häfner, Stock, &
Oberst, 2015) underscore the importance of SRL for successful
postsec-ondary education (Bembenutty, 2011b). Nevertheless, college students oftentimes show a deficiency in the knowledge and use of SRL strategies (Peverly et al., 2003) and see no need to self-regulate learning processes because they tend to overestimate their knowledge. Because this con-stellation is likely to result in underachievement (Dunlosky & Rawson, 2012), they have a special need for support. Trainings that impart knowledge on SRL strategies and support college students in practicing these strategies can improve SRL skills and academic achievement
(Masui & De Corte, 2005), and can show long-lasting effects (Bail,
Zhang, & Tachiyama, 2008). Although SRL is of general importance for
college students' learning, several authors have called for the investiga-tion of individual differences in SRL with regard to constructs such as personality (e.g.,Zeidner, Boekaerts, & Pintrich, 2000, seeSection 1.3). Following this person-centered approach (Niemivirta, 2002), it is more-over important to consider how such individual differences influence the efficiency of interventions to foster SRL (Snow et al., 1996). There-fore, the present study investigates whether there are distinct profiles of SRL skills in college students and how these relate to achievement and personality characteristics. Moreover, we will investigate how these profiles impact an SRL training and which subgroups benefit the most from the intervention.
1.2. SRL and achievement
There is ample evidence that SRL and achievement level are positive-ly related (e.g.,Broadbent & Poon, 2015; Zimmerman & Martinez-Pons,
1986).Kitsantas (2002)found that high achieving college students used
more SRL strategies before, during, and after test taking compared to lower achieving students. Moreover, the former group used more strat-egies that are different from each other, and high achieving students vary in the frequency of strategy use, depending on different semester phases (Nandagopal & Ericsson, 2012). Concordantly, low achieving students seem to lack metacognitive abilities because they tend to over-estimate their knowledge (Cohen, 2012; Koriat & Bjork, 2006). This is in
line with thefinding that they do not use preceding results to optimize their learning behavior (Hacker, Bol, Horgan, & Rakow, 2000). Concerning academic achievement, several studies have already adopted a person-centered approach.Liu et al. (2014)analyzed stu-dents' Motivated Strategies for Learning Questionnaire (MSLQ; Pintrich, Smith, Garcia, & McKeachie, 1991) results to identify profiles of more or less self-regulated learners and found two adaptive and two maladaptive clusters. Using grades as an external achievement marker, they found that students belonging to the adaptive clusters ob-tained higher grades compared to those of the maladaptive cluster.
Valle et al. (2008)yielded similar results,finding that clustering
stu-dents into low, middle, or high self-regulated learners was predictive of their academic achievement.Barnard-Brak et al. (2010)also advocat-ed for examination of SRL profiles in students. Investigating a sample of college students, they identifiedfive profiles of SRL skills that differed not only quantitatively, but also in profile strengths and weaknesses. Moreover, the students of different profiles significantly differed in their academic achievement in that students with higher SRL skills and more adaptive SRL skill combinations showed higher achievement. Because these studies identified different numbers of SRL clusters (three, four, andfive), it remains unclear how many SRL profiles exist in college students. Therefore, we aim to clarify this question by an as-sessment of SRL that is grounded on Zimmerman's SRL model
(Zimmerman, 2000). Conducting latent profile analyses and
investigat-ing relatinvestigat-ing differences in academic achievement should provide new insights into the number and characteristics of college students' SRL profiles.
1.3. SRL and personality
As with achievement, there seems to be a relationship of SRL to sev-eral personality traits. Personality traits are individual differences that are stable across time and situations and that explain a person's patterns of cognitions, behavior, and emotions (Hogan, Hogan, & Roberts, 1996). Personality research has put forward afive-factor personality structure and has demonstrated its validity empirically (McCrae & Costa, 1987). The Big Five include the traits of extraversion, agreeableness, conscien-tiousness, neuroticism, and openness to experience.Bidjerano and Dai
(2007)reviewed relationships between Big Five traits and variables
that are important for learning. Whereas conscientiousness is positively related to motivation, effort, persistence, SRL (Chamorro-Premuzic &
Furnham, 2003; Eilam, Zeidner, & Aharon, 2009), and analytic learning
(Geisler-Brenstein, Schmeck, & Hetherington, 1996), openness to expe-riences is linked to elaborative (Slaats, van der Sanden, & Lodewijks, 1997) and constructive learning (Busato, Prins, Elshout, & Hamaker, 1999). In their own study, the authors found that conscientiousness and openness to experiences were linked to metacognitive and elabora-tive learning strategies and to higher frequencies of using time manage-ment and effort regulation strategies (Bidjerano & Dai, 2007). Therefore, conscientiousness and openness to experiences accompany effective learning styles that encompass SRL skills and are thus positively related to academic achievement. Thefinding that SRL mediates the relation-ship between conscientiousness and achievement indicates the construct's relevance for turning preexisting abilities into success
(Eilam et al., 2009). Concerning agreeableness, thefindings are
some-what ambiguous because it relates to effort and SRL (Eilam et al., 2009) as well as to surface learning, which is a less effective learning ap-proach (Slaats et al., 1997). Although extraversion could support effec-tive learning because social behaviors such as help seeking are likely to be promoted, extraverted students seem to have less reflective prob-lem-solving skills (Matthews, 1997). For neuroticism,Bidjerano and Dai
(2007)concluded that overall effects of being emotionally unstable on
learning are negative and that it is negatively related to academic outcomes.
physiological, and behavioral responses that accompany concern about possible negative consequences or failure on an exam or similar evalu-ative situation”(Zeidner, 1998, p. 17). Several studies have shown that test anxiety has a negative influence on achievement (Bonaccio &
Reeve, 2010; Hembree, 1988) and that this relationship is found for
col-lege students as well (Chapell et al., 2005). Although test anxiety is not part of the Big Five personality traits, it has a strong relationship to the personality factor of neuroticism and thus seems to be conceptually re-lated to this emotional instability trait (Chamorro-Premuzic, Ahmetoglu, & Furnham, 2008). With regard to SRL skills, several results indicate a negative relationship between test anxiety and SRL
(Bembenutty, McKeachie, Karabenick, & Lin, 1998; Kesici et al., 2011;
Pekrun, Goetz, Titz, & Perry, 2002). In line with that, Artino and
Stephens (2009)found that students with adaptive
motivational-emo-tional profiles have higher SRL skills. Accordingly, the relationship be-tween learning strategies and academic achievement is higher for less anxious students (Warr & Downing, 2000). Altogether, we conclude that test anxiety is a disadvantageous precondition for learning and should be integrated within a personality framework when investigat-ing SRL differences.
Although personality traits and learning skills seem to be connected, to date, no study has investigated personality differences within a theo-retically based SRL framework. Therefore, the present study tackles this question by investigating whether distinct SRL profiles go along with specific personality characteristics. Based on previous research, it can be hypothesized that higher SRL skills should be attended by higher conscientiousness, higher openness to experiences and less neuroticism and test anxiety. With regard to agreeableness and extraversion, previ-ous research remains unclear, so we had to conduct explorative analyses.
1.4. Differential effects when fostering SRL
Adopting a person-centered approach (Bergman, Magnusson, & El
Khouri, 2003), it can be hypothesized that individual differences in
SRL exist and that these preconditions influence the effectiveness of in-terventions to foster SRL. AsSnow (1992)specified, aptitudes represent conditions that can influence development and therefore can interact with the effects of instructional methods. Concordantly, effects of given aptitudes in the presence of interventions are called aptitude-treatment interactions (ATI). Research with an ATI focus should investi-gate“whether the effects of different instructional methods are infl u-enced by the cognitive or personality characteristics of the learner” (Borg & Gall, 1989, p. 700). It is of high importance to examine whether a specific learning environment is only effective for specific types of learners or if it can be used ubiquitously (Masui & De Corte, 2005).
Moreover, it is necessary to investigate the effects of treatment group heterogeneity because misinterpretations of training effective-ness could be caused by individual difference factors influencing the in-tervention (Lapka, Wagner, Schober, Gradinger, & Spiel, 2011). The evaluation of differential effectiveness for homogeneous subgroups conducting type analysis can help researchers gain new insight into in-tervention success.
In general, very few studies have investigated differential effects of SRL training programs.Lapka et al. (2011)examined differential effects of an online SRL intervention and found that only students with specific motivational profiles (competence-oriented students and students with motivational deficits) benefited from the treatment.González-Pienda,
Fernández, Bernardo, Núñez, and Rosário (2014)have analyzed effects
of SRL training with regard to pre-training SRL levels and found that only students with low baseline levels benefited. Such a compensation effect can be explained by assuming that students with low SRL skills can practice and automatize the newly learned strategies during train-ing, whereas students with high SRL have little potential to improve. Nevertheless, low SRL studentsfirst have to internalize the strategies why transfer to problem-solving would occur later in development
(Hager & Hasselhorn, 2000). Alternatively, it can be hypothesized that students who already possess some SRL skills but are disorganized in strategy usage are likely to benefit more from interventions compared to minimal self-regulators because they operate from a baseline that can be used as a starting point in interventions (Barnard-Brak et al., 2010). A contrary hypothesis is that students with high SRL baseline levels especially would benefit from an intervention because they can control their cognitions more effectively and therefore could learn and apply the strategies more easily (Alexander, Carr, & Schwanenflugel, 1995). Such an effect would indicate the presence of the Matthew effect (Walberg & Tsai, 1983), defined as an advantage in developmental gains for students who started with higher competencies (Niklas, Segerer,
Schmiedeler, & Schneider, 2012). Because little previous research has
investigated the effectiveness of an SRL training, the present study therefore is thefirst to analyze such differential effects of SRL profiles within a group of college students. Thefindings can generate new in-sights into how individuals can be grouped to obtain optimal training results and increase the effectiveness of SRL interventions (Liu et al., 2014) or how interventions can be conceptualized adaptable to individ-ual needs. Besides this increase in overall effectiveness for different groups of students, ATI research helps detect potential“mathemathanic effects”(Lohman, 1986, p. 192), described as deterioration during train-ing because of a misfit between preconditions and instructional design. Because it is possible that structured interventions may have detrimen-tal effects on highly self-regulated students (Feuerstein, 1980), the in-vestigation of differential effects within training programs to prevent negative effects seems promising.
1.5. Purpose of the present study
As the precedent sections clarified, the variable-centered approach is the predominant research strategy within the SRL framework and the evaluation of SRL interventions. This approach focuses on the ques-tions of how SRL can be improved and which components or strategies are most important for learning. Although these questions are of high concern, a person-centered approach (Niemivirta, 2002) can uncover important insights for developing adaptive and individualized training programs (Schmitz, 2001). As shown above, this research strategy is rel-atively rare in thefield of SRL. To approach this shortcoming, the present study had two aims: Thefirst aim was to investigate the presence of in-dividual differences in SRL and of distinct SRL profiles and to analyze their relation to achievement and personality. Investigating the relation of SRL profiles with academic achievement was used primarily as crite-rion validation for the profiles because there is ample evidence that higher SRL skills relate to higher academic achievement. In contrast, the examination of SRL profiles with regard to personality factors has not been done before and thus adds to research on individual differ-ences in SRL. Knowledge on relations between students' personality and their learning strategy skills can support educators in conceptualiz-ing optimal learnconceptualiz-ing environments (Bidjerano & Dai, 2007). To pursue these aims, we conducted latent profile analyses to cluster individuals into homogenous SRL subgroups and investigated differences in achievement and personality based on these subgroups. Because previ-ous research has found three tofive SRL profiles, our analyses were more exploratory with regard to the number of profile clusters. Never-theless, it was hypothesized that higher self-reported SRL skills come along with higher academic achievement and that students who show higher perceptions of the extent to which they engage in SRL processes are more conscientious, open, and less neurotic and test anxious. Concerning extraversion and agreeableness, we had no distinct hypoth-esis because previous research results are ambiguous. Nevertheless, these two personality traits seem to be rather positive for learning.
seeSection 2.1.2). Repeated measurement analyses were used to detect differential changes in students' perceptions of their SRL strategy use based on the profile membership. With regard tofindings from prior studies, we hypothesized that students with low pre-training SRL levels will especially benefit from the training (González-Pienda et al., 2014). The study adds to research because it follows the rarely focused-upon person-centered approach and helps identify subgroups of college stu-dents who benefit from training as well as subgroups that are in need of special interventions.
2. Methods
2.1. Sample and procedure
The University Ethics Committee approved conducting the study and participation was voluntary. All participants signed and informed consent form and data were anonymized by the assignment of individ-ualized codes.
2.1.1. First aim: Profiles of SRL
To conduct latent profile analyses on SRL and investigate differences between profiles with regard to achievement and personality, question-naires were administered ton= 337 college students (MAge= 23.48,
SD= 4.08, 71% female) of different subjects of study (pre-service teachers of different subjects [69.0%], psychology [14.5%], languages and cultural studies [9.0%], economics and law [3.9%], natural sciences [2.7%], other/not specified [0.9%]) in thefirst week of the semester. They had attended university forM= 7.3 semesters (SD= 4.1) Partic-ipantsfilled out SRL and personality questionnaires and answered ques-tions concerning current GPA and GPA of university entrance diploma during regular courses and obtained study credit for participation or had the chance to win a shopping voucher. Because we used this sample to conduct latent profile analyses, it is named thecluster sample.
2.1.2. Second aim: Differential training effects
To analyze individual effects of the SRL profiles with regard to an SRL intervention,n= 69 college students participated in an SRL training program (see below). Asn= 55 participants (MAge= 21.96,SD= 3.69, 76% female) completed both pretest and posttest, our analyses will focus on this subsample. They had attended university forM= 3.8 semesters (SD= 3.6) and voluntarily applied for the training to im-prove their SRL skills. Because this course was content-independent, students of allfields of study could participate (psychology [74.0%], lan-guages and cultural studies [9.3%], natural sciences [9.3%], other/not specified [7.4%]). Participantsfilled out SRL questionnaires in thefirst training session before any SRL contents were imparted (T1), as well as in the last training session eight weeks later (T2). To analyze the sta-bility of training effects, questionnaires were administered a third time (T3) eight weeks after the training ended. We obtained data ofn= 42 participants for the three measurement occasions. Dropout analyses showed that the subsamples ofn= 55 andn= 42 participants did not differ from the original sample ofn= 69 participants concerning age, gender, semester, GPA of university entrance diploma, and pre-training SRL. Only with regard to current GPA of subject of study, partic-ipants that completed posttest and follow-up test scored significant lower than participants that took part only in pretest. This speaks in favor of the relevance of our training for low-achieving students. Be-cause we used this sample to investigate differential training effects, it is named thetraining sample.
The SRL training was comprised of eight weekly sessions of about 90 min each. Those sessions were conducted by a skilled trainer (Ph.D. student in educational sciences) and co-trainer (undergraduate in psy-chology). A schedule for each session helped ensure standardized im-plementation by concretizing the timing as well as the teaching methods and exercises. All sessions were similar in structure: The train-er gave theoretical input, which was followed by single or group
exercises with standardized work sheets. These exercises deepened the SRL strategies and fostered their transfer into individual learning processes. Activating teaching methods were applied to encourage par-ticipants' motivation (Silberman, 1996). To expand their understanding, participants received a booklet with background information on the strategies acquired at the end of each session. A sheet with open-ended questions to stimulate reflection of session content was given as homework. The training followed an SRL process as described in the social-cognitive theory ofZimmerman (2000)and therefore com-prised sessions concerning components of the forethought, perfor-mance, and reflection phases of SRL.
General effectiveness of the training was confirmed in a quasi-ex-perimental control-group evaluation study (Dörrenbächer & Perels, 2016; see also for extended training description). This study used a 2 × 2 × 2 design with the factors training (yes/no), learning diary (yes/no), time (pretest/posttest) and investigated a propensity-score matched sample of 173 college students. One group of students took part in the abovementioned SRL training, one groupfilled out learning diaries daily, one group took part in the training andfilled out learning diaries and one group received no SRL intervention. Pre-post and pro-cess measures of SRL showed that students in the training group and students in the combination group significantly improved their SRL skills and that this increase was stable for eight weeks. Although the in-crease was higher for students of the combined group (d= 0.68), change in SRL was relevant for the students of the training group as well (d= 0.49). Students of the learning diary group and the control group showed no change in their SRL values. Because this was an inves-tigation of the training's general effectiveness, the present study ana-lyzes whether students with specific SRL profiles show differential training effects. For the second aim of the present study, we used the data of the participants that received the SRL training but no learning diary.
2.2. Instruments
2.2.1. Grade point average (GPA)
Students' achievement levels were assessed by two indicators: At the one hand, students self-reported their current GPA of their subject of study (ranging from 1 =excellentto 4 =poor). At the other hand, they self-reported GPA of their university entrance diploma (ranging from 1 =excellentto 4 =poor). The German university entrance diplo-ma results of national, curricular-based school exams that are compara-ble across different schools and regions. Because all college students have to pass this exam in the same class level, a comparable educational level is ensured among German college students. GPA of university en-trance diploma is very central in the German educational system be-cause it is used for applicant selection at many universities and has a strong relationship with later university achievement (Wedler, Troche,
& Rammsayer, 2008). Because it allows for achievement comparisons
between students of allfields of study (Müller-Benedict & Tsarouha, 2011), we investigated it in addition to current GPA of subject of study. Both achievement indicators showed a correlation ofr= 0.21 (pb0.001). This indicates that school and college achievement show a relationship but that these indicators cannot be equated.
2.2.2. Personality questionnaire
Personality was assessed using the short version of the Big Five In-ventory (BFI-K;Rammstedt & John, 2005). Each of thefive personality dimensions was registered by four items on a 4-point Likert-type scale that ranged from 1 (not true at all) to 4 (totally true). Because reli-ability analyses showed low values for the agreeableness scale when using four items (αcluster sample= 0.57,αtraining sample= 0.54), we
ex-cluded one item from further analyses to improve reliability to a small extent (αcluster sample= 0.57,αtraining sample= 0.61). Internal
(αcluster sample= 0.83,αtraining sample= 0.84), conscientiousness (αcluster
sample= 0.73,αtraining sample= 0.76), neuroticism (αcluster sample= 0.81, αtraining sample= 0.77). Openness to experiences showed unsatisfactory
reliability for the training sample with no improvement possible (αcluster sample= 0.65,αtraining sample= 0.45). Because we aimed to
eval-uate the influence of learning-relevant personality factors, we included test anxiety as a further personality dimension. Using the Test Anxiety Inventory (Spielberger, 1980), we could register both emotionality and worry components of test anxiety through 9 items on a 4-point Likert-type scale that ranged from 1 (not true at all) to 4 (totally true). The scale showed high internal consistency for both the cluster and the training sample ofα= 0.92.
Using confirmatory factor analysis (CFA) with the cluster sample, we tested our proposed model with extraversion, openness to experiences, conscientiousness, agreeableness, neuroticism, and test anxiety asfi rst-order factors. Neuroticism and test anxiety were modeled as indicators of a second-order factor“negative personality for learning”, whereas ex-traversion, openness to experiences, conscientiousness, and agreeable-ness were modeled as a second-order factor“positive personality for learning”. Overall learning personality was conceptualized as a third-order factor. The model yielded acceptablefit indices based on the guidelines ofKline (2005):χ2
(341) = 751.91,pb0.001,χ2
/df = 2.2, CFI = 0.909, RSMEA = 0.054 [0.049–0.060], SRMR = 0.067.
2.2.3. SRL inventory
To assess students' perceptions of the extent to which they engage in SRL processes, we developed a 45-item questionnaire that covered the three phases of an SRL cycle as described in Zimmerman's model
(Zimmerman, 2000). The questionnaire contained several subscales to
depict relevant components of each phase. We adapted items from pre-existing instruments (seeTable 1) or developed new items to cover the relevant scales (these items had been tested in a pilot study withn= 30 college students and showed acceptable internal consisten-cy values, 0.65≤α≤0.91). The 4-point Likert-type scale ranged from 1 (not true at all) to 4 (totally true). Procrastination had to be recoded for analyses because it was originally reverse coded. Internal consistencies for the sample were acceptable for all subscales and the three measure-ment points (seeTable 1). The overall SRL score (mean of all items) was used for training evaluation and showed high internal consistencies for all three measurement points. Using confirmatory factor analysis (CFA) with the cluster sample, we investigated the latent structure of the
measure. The hypothesized model with the subscales asfirst-order fac-tors, the three phases of forethought, performance, and reflection as second-order factors, and overall SRL as a third-order factor yielded ac-ceptable fit indices following Kline (2005): χ2 (919) = 1622.98, pb0.001,χ2/df = 1.76, CFI = 0.903, RSMEA = 0.043 [0.040–0.047],
SRMR = 0.070. Correlations of overall SRL with current GPA (r =−0.23, pb 0.001) and GPA of university entrance diploma (r=−0.31,pb0.001) were interpreted as afirst hint for the measures' criterion validity (low values represent high achievement in the Ger-man educational system, seeTable 2).
2.3. Data analysis
Ourfirst aim was to analyze individual differences in SRL with regard to achievement level and personality. To group individuals into homog-enous classes with regard to SRL level, we conducted latent profile anal-yses (LPA;Vermunt & Magidson, 2002) on the cluster sample consisting ofn= 337 students using the SRL subscales as indicator variables. LPA is a clustering method that can be used with continuous variables and that helps extract latent classes that explain relationships of indicator vari-ables. Depending on their responses, participants who answer in a sim-ilar way are grouped into homogenous profiles with the aim to maximize the dissimilarity between participants of different profiles. Because we did not know how many classes to expect, we conducted an exploratory analysis by investigating models from 1 to 7 classes. To obtain stable solutions, the variances were constrained to be equal across clusters. Additionally, the indicators were constrained to be unre-lated to one another both within and across clusters.
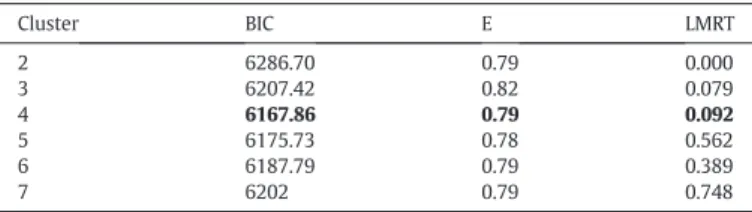
Using the robust maximum-likelihood estimation approach (MLR), MPlus7 (Muthén & Muthén, 2012) provides several modelfit criteria that help decide which latent profile modelfits the data best. Following
Marsh, Lüdtke, Trautwein, and Morin (2009), we used the BIC (Bayesian
Information Criterion), entropy (E, measure of classification certainty), and the Lo-Mendell-Rubin test (LMRT) for model selection. Lower BIC values indicate better modelfit, whereas higher entropy indicates a more reliable clustering of individuals into subgroups. A significantp -value for the LMRT indicates that the estimated model withk-classes
fits the data better than the model withk−1 classes. Sizes of latent
pro-files were used as a further selection criterion because too small num-bers of individuals within each class are hard to interpret and not very ecological. Because“it is useful to explore solutions with varying
Table 1
Scales, item examples, and reliabilities of the SRL questionnaire.
Phase Subscale: item example (number of items) Source
Cronbach's alpha t1a t1b t2b t3c Forethought Goal setting: e.g.,“Before taking a test, I think about which grade I′ll try to achieve.”(4) Schmidt (2009) 0.76 0.80 0.77 0.82
Time planning: e.g.,“I write a time schedule before I start learning.”(6) MSLQ (Pintrich et al., 1991; Schmidt, 2009)
0.89 0.82 0.59 0.85
Self-efficacy: e.g.,“I′m able tofind a solution for every problem.”(5) Jerusalem and Schwarzer (1981) 0.78 0.70 0.83 0.78
Intrinsic motivation: e.g.,“I enjoy learning.”(3) self-developed 0.71 0.66 0.64 0.71
Goal orientation: e.g.,“I prefer tasks that are interesting, even if they're difficult to solve.”(2) MSLQ (Pintrich et al., 1991) 0.77 0.81 0.89 0.81 Performance Attention focusing: e.g.,“During learning, I work very focused.”(5) Leidinger and Perels (2012);
self-developed
0.89 0.84 0.82 0.91
Elaborative learning strategies: e.g.,“I critically question things I learn.”(3) MSLQ (Pintrich et al., 1991) 0.72 0.56 0.83 0.86 Self-monitoring: e.g.,“I pay attention to not miss my goal when I′m learning.”(4) MSLQ (Pintrich et al., 1991) 0.67 0.75 0.75 0.68 Procrastination: e.g.,“I postponefinishing work, even if it's important.”(6) Procrastination scale (Tuckman,
1991)
0.89 0.86 0.87 0.89
Reflection Self-evaluation: e.g.,“After learning, I check if I′ve reached my goals.”(4) self-developed 0.78 0.83 0.75 0.83 Adaptive self-reaction: e.g.,“After receiving achievement feedback, I ponder what I′ve done good
and what can be improved.”(3)
MSLQ (Pintrich et al., 1991) 0.68 0.64 0.71 0.74
Overall SRL (45) 0.92 0.91 0.87 0.88
Note. a
Cluster sample, 329≤n≤335. b
Training sample, 47≤n≤55. c
Table 2
Means, standard deviations and correlations of the used variables for the cluster sample.
1 2 3 4 5 6 7 8 9 10 11 12 13 14 15 16 17 18 19 20
1. GPAD – 0.25⁎⁎ 0.17⁎⁎ 0.01 −0.26⁎⁎ 0.03 0.00 −0.05 −0.30⁎⁎ −0.18⁎⁎ −0.08 −0.19⁎⁎ −0.16⁎⁎ −0.26⁎⁎ −0.20⁎⁎ −0.17⁎⁎ −0.18⁎⁎ −0.11 −0.18⁎⁎ −0.31⁎⁎ 2. GPAC – 0.13⁎ −0.01 −0.16⁎⁎ 0.02 0.06 −0.09 −0.30⁎⁎ −0.06 −0.13⁎ −0.19⁎ −0.14⁎ −0.20⁎⁎ −0.15⁎ −0.01 −0.15⁎ −0.04 −0.17⁎⁎ −0.23⁎⁎ 3. TA – −0.15⁎⁎ −0.12⁎ 0.64⁎⁎ −0.04 −0.04 −0.08 0.03 −0.49⁎⁎ −0.26⁎⁎ −0.27⁎⁎ −0.25⁎⁎ −0.14⁎ −0.07 −0.20⁎⁎ 0.09 −0.04 −0.25⁎⁎ 4. EX – 0.19⁎⁎ −0.25⁎⁎ 0.19⁎⁎ 0.20⁎⁎ 0.08 0.04 0.12⁎ 0.10 0.06 0.06 0.01 0.13⁎ 0.15⁎ 0.05 0.12⁎ 0.15⁎⁎ 5. CO – −0.08 0.13⁎ 0.08 0.35⁎⁎ 0.49⁎⁎ 0.15⁎⁎ 0.31⁎⁎ 0.09 0.50⁎⁎ 0.20⁎⁎ 0.52⁎⁎ 0.72⁎⁎ 0.28⁎⁎ 0.35⁎⁎ 0.69⁎⁎ 6. NE – −0.08 0.06 −0.05 0.01 −0.44⁎⁎ −0.15 −0.21⁎⁎ −0.22⁎⁎ 0.01 0.02 −0.12⁎ 0.07 −0.02 −0.17⁎⁎ 7. AG – 0.01 −0.03 0.11⁎ 0.00 0.16⁎⁎ 0.03 0.05 0.06 0.07 0.15⁎⁎ 0.14⁎⁎ 0.09 0.14⁎ 8. OP – 0.14⁎ −0.02 0.17⁎⁎ 0.17⁎⁎ 0.27⁎⁎ −0.03 0.31⁎⁎ 0.19⁎⁎ −0.01 0.17⁎⁎ 0.21⁎⁎ 0.17⁎⁎ 9. GS – 0.31⁎⁎ 0.25⁎⁎ 0.33⁎⁎ 0.17⁎⁎ 0.29⁎⁎ 0.26⁎⁎ 0.28⁎⁎ 0.29⁎⁎ 0.25⁎⁎ 0.33⁎⁎ 0.58⁎⁎ 10. TP – 0.04 0.09 −0.05 0.40⁎⁎ 0.14⁎ 0.45⁎⁎ 0.49⁎⁎ 0.34⁎⁎ 0.30⁎⁎ 0.68⁎⁎
11. SE – 0.26⁎⁎ 0.41⁎⁎ 0.15⁎⁎ 0.17⁎⁎ 0.13⁎ 0.10 −0.03 0.05 0.36⁎⁎
12. IM – 0.33⁎⁎ 0.38⁎⁎ 0.39⁎⁎ 0.24⁎⁎ 0.31⁎⁎ 0.17⁎⁎ 0.30⁎⁎ 0.53⁎⁎
13. GO – 0.10 0.40⁎⁎ 0.14⁎⁎ 0.04 −0.01 0.11⁎ 0.29⁎⁎
14. AF – 0.22⁎⁎ 0.37⁎⁎ 0.58⁎⁎ 0.20⁎⁎ 0.28⁎⁎ 0.69⁎⁎
15. LS – 0.39⁎⁎ 0.22⁎⁎ 0.29⁎⁎ 0.30⁎⁎ 0.50⁎⁎
16. SM – 0.47⁎⁎ 0.46⁎⁎ 0.45⁎⁎ 0.68⁎⁎
17. PR – 0.30⁎⁎ 0.28⁎⁎ 0.75⁎⁎
18. SE – 0.50⁎⁎ 0.53⁎⁎
19. SR – 0.56⁎⁎
20. SRL –
M 2.10 2.14 2.31 2.92 2.92 2.50 2.56 3.18 2.91 2.46 2.82 3.06 2.93 2.35 2.45 2.98 2.68 2.69 3.04 2.72
SD 0.60 0.53 0.78 0.67 0.57 0.71 0.62 0.52 0.61 0.72 0.54 0.56 0.62 0.63 0.60 0.45 0.73 0.58 0.51 0.36
Note.332≤n≤337 (pairwise deletion of missing values). GPAD = grade point average of university entrance diploma, GPAC = grade point average of college subject of study, TA = test anxiety, EX = extraversion, CO = conscientiousness, NE = neuroticism, AG = agreeableness, OP = openness to experiences, GS = goal setting, TP = time planning, SE = self-efficacy, IM = intrinsic motivation, GO = goal orientation, AF = attention focusing, LS = learning strategies, SM = self-monitoring, PR = procrastination, SE = self-evaluation, SR = self-reaction, SRL = overall self-regulated learning,M= mean,SD= standard deviation.
⁎ pb0.05. ⁎⁎ pb0.01.
23
4
L.
D
ör
re
nb
äc
he
r,
F.
Pe
re
ls
/
Le
ar
ni
ng
an
d
In
d
iv
id
ua
l
D
if
fe
ren
ce
s
51
(20
1
6)
2
2
9
–
number of groups and to select one that makes most sense in relation to theory, previous research, the nature of the groups, and interpretation of the results”(Marsh et al., 2009, p. 194), we considered these points in addition to goodness offit indices. Moreover, we verified the replica-tion of the best log-likelihood to avoid local maxima. The number of ini-tial stage random starts was set to 500, with 10 stages of optimizations. The maximum number of iterations was set to 20. MPlus uses the Full Information Maximum Likelihood algorithm to handle missing data. Using the MPlus SAVE-command, we were able to assign the classes to each individual of thecluster samplebased on his or her response on the SRL subscales (indicator variables), and we then saved that clas-sification in IBM SPSS Statistics. In a further step, we conducted separate ANOVAs to investigate differences in academic achievement and per-sonality using the class membership scores as independent variables. Differences in achievement were primarily examined as an external val-idation of the SRL profiles, whereas differences in personality represent-ed a central research question of our study.
Our second aim was to investigate differential training effects in de-pendence on the SRL profiles. Therefore, we used discriminant analyses to classify participants of thetraining sampleinto the classes that were found using LPA with the cluster sample. We then conducted repeated measurement analyses using overall SRL (mean of all item scores) as a dependent variable and the profile classification as an independent var-iable. For all analyses in SPSS, missing values were not replaced as miss-ings were completely at random (Little's MCAR test revealed no significant results for both the cluster and the training sample).
3. Results
3.1. First aim: Individual differences in SRL
3.1.1. Zero-order correlations
Table 2shows the descriptive statistics and zero-order correlations
of all variables used for latent profile analysis (SRL subscales) and the variables used to examine differences in achievement and personality within the cluster sample.
3.1.2. Latent profile analyses
To identify homogenous subgroups of students according to their SRL strategy usage, we conducted latent profile analyses (LPA) with the SRL subscales as indicator variables. These analyses were made using the cluster sample ofn= 337 students because a large sample size is beneficial for obtaining stable solutions (Wurpts & Geiser, 2014).Table 3shows thefit indices of the analyses for the 2–7 cluster group solutions. LPA for students' perceptions of their SRL strategy usage resulted in a four-cluster solution showing the lowest BIC value and good entropy. Although the LMRT resulted in an only marginally significantp-value, we decided on the four-group solution. AsMarsh
et al. (2009)recommend,“it is useful to explore solutions with varying
number of groups and to select one that makes most sense in relation to theory, previous research, the nature of the groups, and interpretation of the results”(Marsh et al., 2009, p. 194). We considered these points in addition to goodness of fit indices. Moreover, it had a good
interpretability with regard to SRL theory, and a four-group solution was already found byLiu et al. (2014).
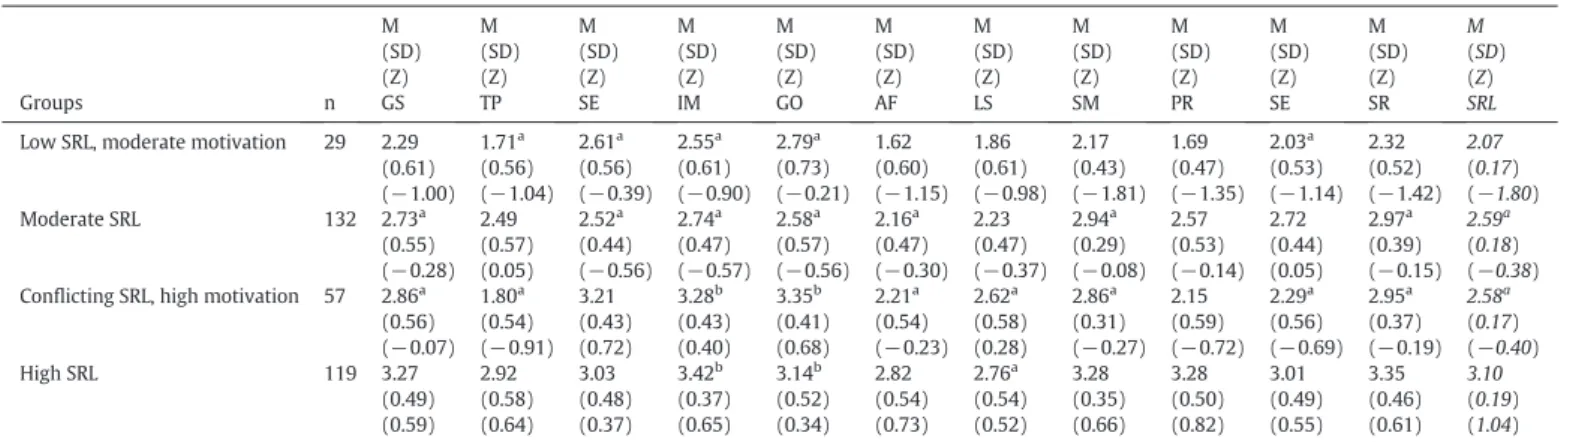
Table 4shows means and standard deviations of the SRL indicators
and overall SRL (mean of all items) for the four profile groups. It is obvi-ous from the means of the SRL subscales that thefirst group showed the lowest values on all subscales except for self-efficacy and goal orienta-tion. Because these values and the value for intrinsic motivation did not differ from the second profile that had average values, we named thefirst group thelow SRL with moderate motivationgroup. The second group showed moderate values on all subscales (moderate SRLgroup). The third group had moderate values on most subscales with the highest value in self-efficacy and high values in intrinsic motivation and goal orientation (no difference to the fourth group) in combination with low values on time planning, procrastination, and self-evaluation (no difference to thefirst group). Therefore, we named this group the
conflicting SRL with high motivationgroup. The fourth group had high values on all subscales (high SRLgroup). It can be concluded that the SRL profiles differed not only quantitatively but also show qualitative differences, especially with regard to motivational subscales. We con-ducted separate univariate analyses of variance with the SRL subscales as a dependent variable and profile groups as an independent variable. All omnibus tests revealed the expected significant differences between the four SRL profiles (allp-valuesb0.001). To compare the single profile groups, Scheffé post-hoc tests were conducted for all indicator variables and showed that almost all groups were different from each other (pb0.001), with the exceptions being illustrated inTable 4. It is obvious that groups 2 and 3 do not differ in their overall SRL but do differ with regard to the subscales. Therefore, LPA results provide new insights into the SRL structure of different learner types. To illustrate specific characteristics of the SRL profiles,Fig. 1shows a profile plot withz -scores for the SRL subscales and the four SRL groups.Z-scores were used to ease the interpretation of results and to gain insights on relative differences between the profiles. In line withLiu et al. (2014), we regard
z-scores above 0.5 and below−0.5 as extreme.
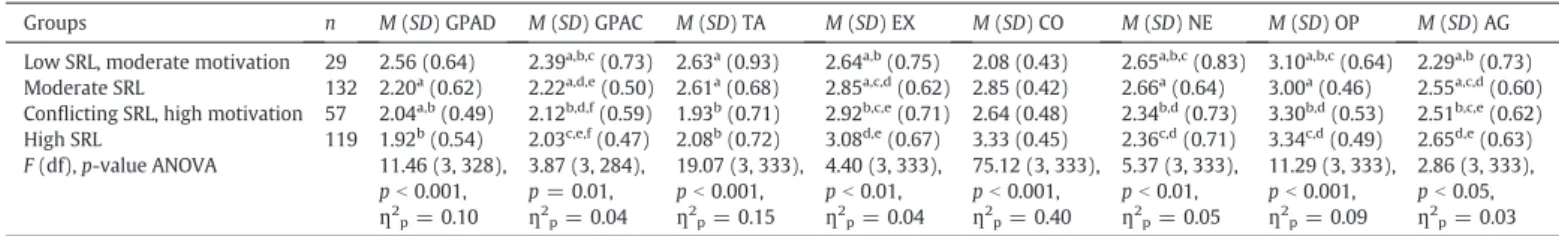
To investigate whether SRL profiles differ with regard to academic achievement and personality factors, we conducted several univariate analyses of variance with SRL profile group as independent variable and achievement and personality variables as dependent variables.
Table 5shows means and standard deviations of both achievement
markers and the personality subscales in dependence of the SRL profile group. Moreover, it shows theF-values and their significance and effect sizes for omnibus analyses of variance to compare the four SRL profiles with regard to achievement and personality variables. To compare the single profile groups with regard to the dependent variables, we con-ducted Scheffé post-hoc tests. Concerning GPA for university entrance diploma, comparisons were significant for all groups (pb0.05) expect for the comparison of group 2 with group 3 and of group 3 with group 4. With regard to GPA of college subject of study, all comparisons had
p-valuesN0.05 as to why only the overall difference was significant. For test anxiety, all comparisons were significant (pb0.05) except for the comparison of group 1 with group 2 and group 3 with group 4. Concerning extraversion and agreeableness, only the comparisons of group 1 with group 4 reached significance (pb0.05), whereas all com-parisons were significant (pb0.05) for conscientiousness. With regard to neuroticism and openness to experience, only comparisons of group 2 with group 3 and group 2 with group 4 reached significance (pb0.05).
3.2. Second aim: Differential training effects
3.2.1. Classifying participants into profiles
To conduct analyses concerning differential training effects, partici-pants of the training sample were classified into profile groups using discriminant analysis. Based on the results of latent profile analyses with the cluster sample, discriminant analysis uses profile group mem-berships to generate a classification function. This algorithm then could Table 3
Fit statistics for latent profile analyses.
Cluster BIC E LMRT
2 6286.70 0.79 0.000
3 6207.42 0.82 0.079
4 6167.86 0.79 0.092
5 6175.73 0.78 0.562
6 6187.79 0.79 0.389
7 6202 0.79 0.748
be applied to the individual subscale scores of participants of the train-ing sample classifytrain-ing them into the four SRL profiles.Table 6shows means and standard deviations of the SRL indicators and overall SRL (mean of all items for the three measurement points) for the four profile groups within the training sample. Conducting a MANOVA with SRL in-dicator variables as dependent variables, and sample (cluster/training) and profile group (low/moderate/conflicting/high) as independent var-iables, we found no significant interaction of sample × profile group in-dicating that patterns of the profile groups are similar for both samples. Univariate analyses revealed a significant interaction of sample × profile group for intrinsic motivation (F(3, 383) = 2.78,pb0.05) as the low SRL with moderate motivation group has higher intrinsic motivation values in the training sample than in the cluster sample.
We analyzed the distribution of cluster groups concerning cluster versus training samples and found a differences in frequency,χ2
(3) = 11.76,pb0.01 resulting of the fact that the training sample had higher proportions of the low SRL group, the moderate SRL group, and the conflicting SRL group than the cluster sample, whereas fewer partic-ipants belonged to the high SRL group. This is reasonable as particpartic-ipants voluntarily decided to take part in our training and therefore are likely to be aware of their low to moderate SRL skills. Correlational pattern be-tween interesting variables were similar to that of the cluster sample
(Table 2). Concerning achievement, we found no significant differences
between cluster groups. This probably resulted of the fact that the train-ing sample mainly comprised psychology students that have a very low achievement variance due to restricted admission to psychology studies (cluster group means for university entrance diploma between 1.84 and 2.11). With regard to personality factors, we found significant omnibus effects for the dependent variables of conscientiousness (F(3, 51) = 4.14,pb0.05), openness to experiences (F(3, 51) = 3.12,pb0.05), and neuroticism (F(3, 51) = 2.80, p b 0.05) with the direction confirming the results of the cluster sample. For extraversion and agree-ableness, there were no significant differences between the cluster groups.
3.2.2. Analyzing differential training effects
After having classified participants of the training sample into profile groups using discriminant analysis, we investigated differential training effects based on SRL profiles. We conducted our analyses on the partic-ipants that took part both in pretest and posttest (n= 55) and stability tests were conducted using the sample ofn= 42 participants thatfilled out the questionnaires on all three measurement points. We ran repeat-ed measurement ANOVA with overall SRL (mean of all items scores) as a dependent variable (pretest/posttest) and profile groups as indepen-dent variable to detect interaction effects of cluster groups with time. Kolmogorov-Smirnov-tests for overall SRL (T1, T2, and T3) of all four Table 4
Means and standard deviations for indicator variables of the SRL profiles and for overall SRL within the cluster sample.
Groups n M (SD) (Z) GS M (SD) (Z) TP M (SD) (Z) SE M (SD) (Z) IM M (SD) (Z) GO M (SD) (Z) AF M (SD) (Z) LS M (SD) (Z) SM M (SD) (Z) PR M (SD) (Z) SE M (SD) (Z) SR M (SD) (Z) SRL
Low SRL, moderate motivation 29 2.29 (0.61) (−1.00) 1.71a (0.56) (−1.04) 2.61a (0.56) (−0.39) 2.55a (0.61) (−0.90) 2.79a (0.73) (−0.21) 1.62 (0.60) (−1.15) 1.86 (0.61) (−0.98) 2.17 (0.43) (−1.81) 1.69 (0.47) (−1.35) 2.03a (0.53) (−1.14) 2.32 (0.52) (−1.42) 2.07 (0.17) (−1.80)
Moderate SRL 132 2.73a
(0.55) (−0.28) 2.49 (0.57) (0.05) 2.52a (0.44) (−0.56) 2.74a (0.47) (−0.57) 2.58a (0.57) (−0.56) 2.16a (0.47) (−0.30) 2.23 (0.47) (−0.37) 2.94a (0.29) (−0.08) 2.57 (0.53) (−0.14) 2.72 (0.44) (0.05) 2.97a (0.39) (−0.15) 2.59a (0.18) (−0.38) Conflicting SRL, high motivation 57 2.86a
(0.56) (−0.07) 1.80a (0.54) (−0.91) 3.21 (0.43) (0.72) 3.28b (0.43) (0.40) 3.35b (0.41) (0.68) 2.21a (0.54) (−0.23) 2.62a (0.58) (0.28) 2.86a (0.31) (−0.27) 2.15 (0.59) (−0.72) 2.29a (0.56) (−0.69) 2.95a (0.37) (−0.19) 2.58a (0.17) (−0.40)
High SRL 119 3.27
(0.49) (0.59) 2.92 (0.58) (0.64) 3.03 (0.48) (0.37) 3.42b (0.37) (0.65) 3.14b (0.52) (0.34) 2.82 (0.54) (0.73) 2.76a (0.54) (0.52) 3.28 (0.35) (0.66) 3.28 (0.50) (0.82) 3.01 (0.49) (0.55) 3.35 (0.46) (0.61) 3.10 (0.19) (1.04) Note. M= mean,SD= standard deviation, GS = goal setting, TP = time planning, SE = self-efficacy, IM = intrinsic motivation, GO = goal orientation, AF = attention focusing, LS = learning strategies, SM = self-monitoring, PR = procrastination, SE = self-evaluation, SR = self-reaction, SRL = overall self-regulated learning.
a,bSame letters indicate that this pairwise comparison was not significant (pN 0.05).
Fig. 1.Profiles of SRL for group 1 (low SRL with moderate motivation), group 2 (moderate SRL), group 3 (conflicting SRL with high motivation), and group 4 (high SRL) usingz-standardized values. Procrastination was recoded for analyses.
groups showed no significant deviation from normal distributions why we could conduct ANOVA andt-tests despite the small sample size. Conducting a 2 × 4 (Time × SRL profile) repeated measurement ANOVA, we found a significant interaction,F(3, 51) = 5.06,pb0.01,
ƞp2= 0.23, indicating differential effects with regard to SRL profiles.
Fig. 2illustrates how the SRL profile groups changed from T1 to T2.
To compare effect sizes of different profile groups, we subsequently performed severalt-tests for matched samples and used Cohen'sd
values as a measure to evaluate changes within cluster groups (T1− T2). Stability of effects was investigated witht-tests comparing T2 and T3. Because we wanted to control for alpha-error accumulation, we used Bonferroni-adjustedp-values depending on the number of com-parisons (0.05/3 = 0.017, 0.01/3 = 0.003; 0.001/3 = 0.0003). Due to this alpha-level correction, there was only a marginal significant in-crease in the low SRL with moderate motivation group from T1 to T2,
t(8) =−2.36,p= 0.05, but a significant increase in the moderate SRL group,t(23) =−3.78,pb0.003,d= 0.77. Concerning the conflicting SRL with high motivation group, there was a highly significant increase from T1 to T2,t(11) =−5.01,pb0.0003,d= 1.42. With regard to the high SRL group, there was a non-significant decrease from T1 to T2,
t(9) = 0.95,p= 0.37. These results were found to be stable because there was no change for any of the groups from T2 to T3 (low SRL with moderate motivation group:t(5) =−1.30,p= 0.25; moderate SRL group:t(19) = 1.05,p= 0.31; moderate SRL with high motivation group:t(6) =−0.69,p= 0.52; high SRL:t(8) = 0.72,p= 0.49).
4. Discussion
Following a person-centered approach, the present study had two purposes: On the one hand, we investigated profiles in SRL and analyzed their relationship with achievement level and personality. Conducting latent profile analyses with a sample of college students, we found four SRL profiles that differed not only quantitatively but also qualita-tively especially with regard to motivational SRL components. Achieve-ment levels differed in dependence on SRL profiles, with more skilled and motivated profiles showing higher achievement levels. With regard to personality, students of the more skilled profiles reported lower test
anxiety, lower neuroticism, and higher values in extraversion, conscien-tiousness, agreeableness, and openness to experiences. On the other hand, we analyzed how these SRL profiles influence the effectiveness of an SRL training. We found that only participants with moderate SRL skills and participants with rather low SRL skills but high motivation showed increases in SRL at the posttest, and this result pattern was found to be stable for follow-up test.
4.1. First aim: Profiles of SRL
Using the subscales of the SRL inventory as clustering variables, la-tent profile analyses resulted in four profiles that differed quantitatively (overall SRL scores of the groups increased from low to high) but also qualitatively with regard to SRL subcomponents. Because the second group showed moderate SRL values on all subscales and students of the fourth group had high values on all subscales, these both profiles were relatively easy to interpret as moderate SRL group and high SRL group. In contrast, thefirst and the third profile groups had some qual-itative peculiarities: Thefirst profile showed overall low SRL values with moderate values in motivational subscales (self-efficacy, intrinsic moti-vation, and goal orientation), so we named it the low SRL with moderate motivation group. Similarly, the third group was characterized by its high values in motivational subscales, whereas scores for time planning, procrastination (reverse coded), and self-evaluation were low and the remaining scores were moderate. Therefore, we named this profile the conflicting SRL with high motivation group.
It is striking that analyses revealed no profile with very low motiva-tional values and that thefirst profile is the smallest group in the cluster sample although low motivation seems to be a problem at universities. Considering research concerning metacognitive abilities, it could be as-sumed that low self-regulated students tend to overestimate their com-petences which in turn can lead to underachievement (Dunlosky &
Rawson, 2012). Although low GPA values could be an indicator for
such an overestimation of students in the low SRL with moderate moti-vation group, they seem to be aware of missing competences in time planning, attention focusing, and learning strategies. AsLiu et al.
(2014)also found four SRL profiles with the lowest skilled profile
Table 5
Means and standard deviations for achievement and personality variables depending on SRL profile within the cluster sample.
Groups n M(SD) GPAD M(SD) GPAC M(SD) TA M(SD) EX M(SD) CO M(SD) NE M(SD) OP M(SD) AG
Low SRL, moderate motivation 29 2.56 (0.64) 2.39a,b,c
(0.73) 2.63a
(0.93) 2.64a,b
(0.75) 2.08 (0.43) 2.65a,b,c
(0.83) 3.10a,b,c
(0.64) 2.29a,b (0.73)
Moderate SRL 132 2.20a
(0.62) 2.22a,d,e
(0.50) 2.61a
(0.68) 2.85a,c,d
(0.62) 2.85 (0.42) 2.66a
(0.64) 3.00a
(0.46) 2.55a,c,d (0.60) Conflicting SRL, high motivation 57 2.04a,b
(0.49) 2.12b,d,f
(0.59) 1.93b
(0.71) 2.92b,c,e
(0.71) 2.64 (0.48) 2.34b,d
(0.73) 3.30b,d
(0.53) 2.51b,c,e (0.62) High SRL 119 1.92b(0.54) 2.03c,e,f(0.47) 2.08b(0.72) 3.08d,e(0.67) 3.33 (0.45) 2.36c,d(0.71) 3.34c,d(0.49) 2.65d,e(0.63) F(df),p-value ANOVA 11.46 (3, 328),
pb0.001,
ƞ2 p= 0.10
3.87 (3, 284), p= 0.01,
ƞ2 p= 0.04
19.07 (3, 333), pb0.001,
ƞ2 p= 0.15
4.40 (3, 333), pb0.01,
ƞ2 p= 0.04
75.12 (3, 333), pb0.001,
ƞ2 p= 0.40
5.37 (3, 333), pb0.01,
ƞ2 p= 0.05
11.29 (3, 333), pb0.001,
ƞ2 p= 0.09
2.86 (3, 333), pb0.05,
ƞ2 p= 0.03 Note. M= mean,SD= standard deviation, GPAD = grade point average of university entrance diploma, GPAC = grade point average of college subject of study, TA = test anxiety, EX = extraversion, CO = conscientiousness, NE = neuroticism, OP = openness to experiences, AG = agreeableness.
a,b,c,d,e,f
Same letters indicate that this pairwise comparison was not significant (pN0.05).
Table 6
Means and standard deviations for indicator variables of the SRL profiles within the training group.
Groups n M(SD) GS M(SD) TP M(SD) SE M(SD) IM M(SD) GO M(SD) AF M(SD) LS M(SD) SM M(SD) PR M(SD) SE M(SD) SR M(SD) SRL t1 M(SD) SRL t2 M(SD) SRL t3a Low SRL, moderate motivation 9 2.28
(1.09) 1.67 (0.50) 2.42 (0.49) 2.96 (0.79) 2.89 (0.60) 1.44 (0.41) 2.22 (0.47) 1.89 (0.47) 1.70 (0.43) 2.08 (0.54) 2.30 (0.56) 2.06 (0.15) 2.30 (0.33) 2.45 (0.41)
Moderate SRL 24 2.74
(0.46) 2.39 (0.44) 2.43 (0.37) 2.94 (0.39) 2.67 (0.48) 2.14 (0.37) 2.19 (0.52) 2.86 (0.26) 2.70 (0.63) 2.70 (0.45) 2.94 (0.34) 2.58 (0.17) 2.69 (0.18) 2.62 (0.17) Conflicting SRL, high motivation 12 2.65
(0.55) 1.74 (0.31) 3.03 (0.33) 3.14 (0.46) 3.29 (0.62) 1.93 (0.37) 2.72 (0.34) 2.81 (0.24) 2.13 (0.47) 2.21 (0.77) 2.97 (0.39) 2.49 (0.14) 2.69 (0.17) 2.76 (0.25)
High SRL 10 3.35
(0.47) 2.95 (0.25) 2.88 (0.41) 3.57 (0.39) 3.30 (0.42) 2.64 (0.45) 2.40 (0.60) 3.30 (0.39) 2.98 (0.63) 3.13 (0.57) 3.20 (0.36) 3.03 (0.11) 2.98 (0.18) 2.98 (0.28) Note. M= mean,SD= standard deviation, GS = goal setting, TP = time planning, SE = self-efficacy, IM = intrinsic motivation, GO = goal orientation, AF = attention focusing, LS = learning strategies, SM = self-monitoring, PR = procrastination, SE = self-evaluation, SR = self-reaction, SRL = self-regulated learning.
a
showing medium values for motivation it could be moreover assumed that absolutely non-motivated students potentially exist seldom. This is justifiable as college students are a highly selective sample of learners that freely choose their subjects of study.
Using achievement differences as criterion validation for the profiles, analyses revealed that the low SRL with moderate motivation group and the moderate SRL group scored significantly lower in GPA of university entrance diploma than the high SRL group, whereas the conflicting SRL with high motivation group did not differ significantly from the high SRL group. This leads to the assumption that especially motivational subcomponents of SRL are necessary to be a successful learner
(Richardson, Abraham, & Bond, 2012). With regard to GPA of subject
of study, only the overall ANOVA showed significant results, but de-scriptive statistics indicate that GPA scores increase along with the qual-ity of the SRL profile. As high achievers indicated significantly more SRL strategy usage, this result aligns with former studies (e.g.,Liu et al., 2014; Nandagopal & Ericsson, 2012; Valle et al., 2008).
Taking into account achievement and personality differences as well as thez-standardized scores of indicator variables for profile interpreta-tion, it can be assumed that the low SRL with moderate motivation group and the moderate SRL group are rather maladaptive (z-values throughout below zero), whereas the high SRL group is adaptive for learning (z-values above zero). Although the conflicting SRL with high motivation group showsz-values below and above zero, we assume this cluster to be adaptive regarding their motivational skills, their achievement and their personality.
As several authors point out that a person-centered approach has rarely been used in SRL research (e.g.,Bidjerano & Dai, 2007), we inves-tigated how the SRL profiles are related to several personality factors. We found that students of the adaptive clusters showed significantly lower values in test anxiety than the maladaptive clusters, whereas both adaptive and both maladaptive clusters did not differ from each other. With regard to extraversion and agreeableness, only the compar-ison of the both extreme groups was significant, with students of the high SRL group showing significant higher values. Concerning openness to experiences and neuroticism, the comparisons of the moderate SRL group with the both adaptive clusters were significant, with students of the moderate SRL group showing the lowest values on openness to experiences and the highest values on neuroticism (but in both cases, these were not significantly different from the values of the low SRL with moderate motivation group). With regard to conscientiousness, all four profiles differed significantly from each other, with a continuous increase in conscientiousness in dependence of SRL competence.
Altogether, it seems that the high SRL group shows the best-adjusted personality structure, because students with this profile have low test anxiety and low neuroticism combined with high openness to experi-ences, high extraversion, high agreeableness, and high conscientious-ness. Furthermore, the conflicting SRL with high motivation group also shows adaptive personality characteristics. Previous research that has investigated personality with regard to learning styles is in accordance
to our findings (Bidjerano & Dai, 2007; Chamorro-Premuzic &
Furnham, 2003). The strong correlation of conscientiousness and SRL
(r= 0.69) in our cluster sample is striking and underscores the hypoth-esis that conscientiousness encompasses SRL attributes and therefore is a highly related construct (Eilam et al., 2009). Conscientiousness more-over is a strong predictor for academic achievement even more-over a period of 10–20 years (Shiner & Masten, 2002). It can further be hypothesized that students of the low maladaptive clusters experience problems concerning university life because neuroticism and test anxiety can re-sult in negative affect and impaired well-being.
4.2. Second aim: Differential training effects
As the investigation of average changes concerning a treatment group covers individual differences and does not take into account sam-ple heterogeneity, several authors have asked for subgroup analysis in program evaluation (e.g.,Peck, 2005). Aptitudes and individual vari-ables can influence whether instructional designs have positive effects
(McInerney, McInerney, & Marsh, 1997). Therefore, it is necessary to
take them into account when evaluating intervention programs to avoid misinterpretations (Lapka et al., 2011).
Investigating SRL training effectiveness in dependence on the four SRL profiles, we found that only participants of the moderate SRL profile and the conflicting SRL with high motivation profiles showed increases in SRL at the posttest, whereas students of the low SRL with moderate motivation showed an increase that was not significant and students of the high SRL group showed a nonsignificant decrease. The result pat-tern was found to be stable for follow-up test, as no group changed sig-nificantly from T2 to T3. This is partly in line with findings from
González-Pienda et al. (2014), who found that only students with low
SRL baseline levels could benefit from their training, and hints at a com-pensation effect (Klauer, 1993). Because the low SRL with moderate motivation group could not significantly increase their SRL, ourfindings indicate that an SRL basis is necessary for development in training.
Moreover, the conflicting SRL with high motivation group showed a higher effect size than the moderate SRL group. It can be hypothesized that this group provides a superior basis for interventions compared to low SRL groups because its members already possess some SRL skills (Barnard-Brak et al., 2010). Additionally, it can be assumed that motiva-tional subcomponents play a crucial role in training. If basis skills are available but students are not motivated to optimize them, training can-not be as effective. Participants of the conflicting SRL with high motiva-tion group are characterized by high values on self-efficacy, intrinsic motivation, and goal orientation. Self-efficacy is described as belief in one's own abilities to overcome obstacles (Bandura, 1986), and it has been shown that this motivational belief is a very strong predictor for academic achievement (Honicke & Broadbent, 2016; Richardson et al., 2012). Self-efficacy paired with high intrinsic motivation and goal ori-entation (i.e., willingness to develop one's own abilities with regard to achievement) seems to represent an optimal precondition for training. Moreover, students of the conflicting SRL with high motivation group si-multaneously showed several deficiencies in SRL (time planning, pro-crastination, self-evaluation). This indicates that they had a high potential to develop during training and were motivated to overcome these problems. Combined with moderate values concerning the re-maining SRL components, these can be used as a basis for development. It seems justifiable to assume that this group should benefit the most from training.
As students of the low SRL with moderate motivation group could not increase their SRL significantly, we hypothesize that these students may need more intensive instructional support to develop their skills
(Kalyuga, 2007) because they have deficiencies in all SRL
subcompo-nents and lack strong motivational beliefs. Students of the high SRL group could possibly benefit more from independent problem-solving (Fyfe, Rittle-Johnson, & DeCaro, 2012; Kalyuga & Sweller, 2004). In ac-cordance to that,Mcmanus (2000)assumed that high SRL students Fig. 2.Differential training effects in dependence on SRL profile group. Scale from 1 [not
true at all] to 4 [totally true].