Performance of Spanish/English Bilingual Children
on a Spanish-Language Neuropsychological
Battery: Preliminary Normative Data
Mo´nica Rosselli
1,*, Alfredo Ardila
2, M. Gina Navarrete
3, Esmeralda Matute
4 1Department of Psychology, Florida Atlantic University, Davie, FL, USA
2
Department of Communication Sciences and Disorders, Florida International University, Miami, FL, USA
3
Colorado Neuropsychological and Behavioral Center, Denver, CO, USA
4
Institute of Neuroscience, University of Guadalajara, Guadalajara, Jalisco, Mexico
*Corresponding author at: Mo´nica Rosselli, PhD, Department of Psychology, Florida Atlantic University, 2912 College Avenue, Davie, FL 33314, USA. E-mail address:[email protected] (M. Rosselli).
Accepted 2 February 2010
Abstract
Despite a population of close to 40 million Hispanics/Latinos in the USA who have at least some level of Spanish/English bilingualism, there are few neuropsychological tests and norms available for this group, especially when assessing Spanish/English bilingual children. The purpose of the present research was to provide preliminary normative data for a bilingual population on a comprehensive neuropsychological battery developed for Spanish-speaking children (Evaluacio´n Neuropsicolo´gica Infantil). Norms by age are presented on the performance of 108 Spanish/English bilingual children (ages 5 – 14 years) and are expected to be useful when testing other Spanish/English bilingual children in the USA.
Keywords:Neuropsychological battery; Spanish norms; Bilingual children; ENI
Introduction
Cognitive and academic testing of bilingual individuals represents a major challenge in neuropsychology, due not only to the relative absence of norms for such populations (Valde´s & Figueroa, 1994), but also to the great heterogeneity of this group (Ardila, 2007). Performance on neuropsychological tests by bilingual children and adults will differ depending on various factors related to language acquisition and usage. These include the degree of mastery of the first and second language, the age when language was acquired, sequence of acquisition of the two languages, patterns of language use, and the language used during the acquisition of formal academic skills.Kester and Pen˜a (2002)have suggested that the instruments currently available are not appropriate for testing bilingual individuals because they do not account for the unique aspects of bilingual language acquisition and use.
In the 2004 census (United States Census Bureau, 2004), 49,632,925 people, 18.7% of the population) reported that they spoke a language other than English at home. Spanish speakers represent about 75% of this group (37.5 million people), and this percentage continues to grow with the increasing number of immigrants. Indeed, considering the large number of undocumented immigrants who come to the USA from Mexico and other Latin American countries, the real number of Spanish speakers in the USA is likely larger than reported in the Census.
Centeno and Obler (2001)have made compelling arguments supporting the notion of increasing rates of Spanish/English bilingualism in the USA. They pointed out that despite its minority presence compared with monolingualism in English, bilin-gualism will continue to increase because of the constant influx of Spanish speakers, growing institutional support in the media, and the high degree of loyalty among Hispanics to their mother tongue. Thus, it is no surprise that a high percentage of
Archives of Clinical Neuropsychology 25 (2010) 218 – 235
#The Author 2010. Published by Oxford University Press. All rights reserved. For permissions, please e-mail: [email protected].
doi:10.1093/arclin/acq012 Advance Access publication on 14 March 2010
at Florida International University on April 30, 2010
http://acn.oxfordjournals.org
Hispanic/Latino children are bilingual. Moreover, many of these children frequently communicate using an inter-language (or Spanish dialect) commonly known as “Spanglish,” which developed from their long-term contact with both Spanish and English (Ardila, 2002,2005).
In this multicultural American society, neuropsychologists are challenged to provide culturally competent diagnostic tools for the growing number of Hispanic/Latino children (Perez-Arce & Puente, 1996). This need notwithstanding, few neuropsy-chological, cognitive, or language tests have been developed for Spanish-speaking children. The Bateria Woodcock Psicoeducativa en Espan˜ol (Woodcock, 1982), the Bateria Woodcock-Mun˜oz: Pruebas de Aprovechamiento-Revisada and
Pruebas de Habilidad Cognitiva-Revisida (Woodcock & Mun˜oz-Sandoval, 1996a, 1996b), and the Spanish WISC-IV (Wechsler, 2004) are among the few Spanish cognitive test batteries available to assess these children.
Although language is one of the crucial domains that needs to be assessed in bilingual children, few attempts have been made to norm language tests with Spanish/English bilingual youth. Two recent tests with such norms are the Expressive One-word Picture Vocabulary Test—Spanish Bilingual Edition (Brownell, 2001), and the Receptive One-word Picture Vocabulary Test—Spanish Bilingual Edition (Brownell, 2001). For children under 7 years of age, the Preschool Language Scale, Fourth Edition Spanish (Zimmerman, Steiner, & Pond, 2002), is designed to assess language expression and comprehension.
Standardized neuropsychological assessments based on normative data from exclusively English-speaking children should not be used to evaluate bilingual individuals (DiSibio & Whalen, 2000), since there is compelling evidence that bilinguals score differently from monolinguals on some cognitive measures (Garratt & Kelly, 2008; Gasquoine, Croyle, Cavazos-Gonzalez, & Sandoval, 2007;Rivera Mindt et al., 2008;Sattler & Altes, 1984).Roberts, Garcia, Desrochers, and Hernandez (2002)concluded that the norms collected from monolingual English speakers should not be applied to bilingual individuals, even those who are proficient in English.
Efforts have been made to develop tests that target bilingual populations through the evaluation of both languages. For example, the English/Spanish Bilingual Verbal Ability Tests (Cummins, Mun˜oz-Sandoval, Alvarado, & Ruef, 1998) estimates a bilingual child or adult’s verbal ability by measuring the linguistic knowledge common to both languages, as well as the linguistic knowledge unique to each language.
Administering the appropriate tools and using the “best available norms” are ethical obligations for psychologists and neu-ropsychologists, yet few cognitive tests have been developed and little normative data have been gathered for Spanish/ English-speaking children. As a result, clinicians often have no choice but to test Spanish/English-speaking children using translated versions of available tests and/or apply existing norms that are insensitive and unspecific (Kester & Pen˜a, 2002;
Lamberty, 2002;Lamberty, Courtney, & Heilbronner, 2003). Thus, the predictive validities of these tests are compromised when given to Spanish/English-speaking children (Wong, Strickland, Fletcher-Janzen, Ardila, & Reynolds 2000).
It should be noted that using “the best available measures and norms” does not necessarily mean testing the child in her/his native language. Frequently, because of exposure to English at school, performance in English may be better than the perform-ance in their native language. This is most salient when most or all formal education takes place in English. In such cases, testing in English might actually provide a fairer indication of the bilingual’s ability. A group of South African researchers has attempted to address this problem by creating norms specifically for bilinguals for whom English is not the native language, but is the language being taught at school. These norms are created for tests that are traditionally administered in English instead of developing new tests or attempting to gather normative data using tests translated from English into an African first language (Shuttleworth-Edwards et al., 2004;Shuttleworth-Jordan, 1996).
Moreover, when choosing the test for use in a bilingual population, it is also important to consider the characteristics of the bilingual situation including not only language but also culture and context; thus, the Spanish/English-speaking children living in the USA have incorporated Hispanic elements into their way of life, including different patterns of beliefs and values when compared with English monolingual youngsters living in the USA. After taking these three elements—language, culture, and context—into account in terms of testing the Spanish/English bilingual children in this study, three possibilities were con-sidered: (a) selecting a test designed to be administered to a population in a Spanish-speaking country and developing norms from that procedure for a bilingual group whose native language is Spanish; (b) using a test in English designed to be applied to children living in the USA and then developing norms for native Spanish speakers who are being schooled in English; and (c) administering both types of test in both languages and then developing norms for Spanish and English speak-ers. Given that the ENI (Evaluacio´n Neuropsicolo´gica Infantil) is a test battery developed in Spanish for Latin American chil-dren with similar language backgrounds and some common cultural elements shared with the bilingual chilchil-dren in the current study, we considered (a) to be the best option. In other bilingual contexts, a different option could be more useful; for example, the approach used in South Africa (i.e., creating specific norms for bilinguals for whom English is not the native language, but the one used at school) seems appropriate in that context because the number of African languages and dialects spoken there is significant (11); thus, developing tests for each one of those languages and dialects hardly seems to be a realistic solution. For
M. Rosselli et al. / Archives of Clinical Neuropsychology 25 (2010) 218–235 219
at Florida International University on April 30, 2010
http://acn.oxfordjournals.org
these reasons, the nature of these two bilingual situations is significantly different: Although in South Africa children speak languages that are native to that country, in the USA, Spanish is an immigrant language. Thus, in our case, we were dealing with a single language and a single type of bilingualism. Furthermore, in this globalized world, our bilingual children are compelled to be in contact with both cultures and, in some cases, may even change their country of residence. Consequently, this study opted to use a battery of tests in Spanish, the primary language of the sample group tested, and to provide norms for such Spanish-speaking groups. The results of this study do not allow us to determine whether administering the English translation of the ENI would produce better results for the bilingual children who participated; an issue that should be addressed in future research.
In summary, it is generally agreed that bilingualism is a relevant variable in the neuropsychological assessment of Hispanic/ Latino children in the USA. There is a growing need for instrumentation and normative data for this population because fre-quently these children are bilingual to some degree. The purpose of the present research was to analyze the performance of 108 Spanish/English bilingual children (ages 5 – 14 years) on the ENI—Child Neuropsychological Assessment (Matute, Rosselli, Ardila, & Ostrosky, 2007; Matute, Rosselli, Ardila, & Morales, 2004; Rosselli et al., 2004) and obtain normative data. These data are expected to be helpful to clinicians working with this young population in the USA. Specifically, results from this study can be generalized to Spanish/English bilingual children who have acquired Spanish first and have used both languages in different social contexts (e.g., Spanish at home and English at school).
The ENI is a new, comprehensive neuropsychological battery developed specifically for Spanish-speaking children. It pro-vides assessment of several cognitive domains including constructional abilities, memory, perceptual abilities, oral language, metalinguistic awareness, spatial skills, attention, concept formation, and executive functions. The ENI includes items that are relevant to Spanish-speaking communities. Normative data were collected from 800 monolingual Spanish-speaking children in Mexico and Colombia, aged 5 – 16 years. This neuropsychological battery has been used to study diverse Spanish-speaking clinical populations, including individuals affected by developmental dyscalculia (Rosselli, Matute, Pinto, & Ardila, 2006), dyslexia (Medrano, Matute, & Zarabozo, 2007), congenital disorders (Inozemtseva, Matute, & Jua´rez, 2008), and children born to mothers with gestational diabetes (Bolan˜os, Ramı´rez, & Matute, 2007). However, the original standardization sample was based exclusively on monolingual participants, leaving open the question of whether the norms established would also be applicable to bilingual individuals. Considering the number of Spanish/English bilingual children in the USA and the documented effects that bilingualism exercises on cognitive test performance, it was considered important to obtain normative data for this test battery from a bilingual population to allow a more valid and ample clinical application of the original Spanish version of the test.
Materials and Methods
Participants
One hundred and eight, 5 – 14-year-old, children were selected from Miami Dade, Florida (28 boys and 27 girls) and Denver, Colorado (27 boys and 26 girls). Participants were selected from several elementary and middle schools, both public and private. All participants were identified by their teachers as children that were meeting their developmental milestones and had no indi-cation of a learning disability. The teachers also rated the children’s language skills with respect to comprehension, fluency, vocabulary, pronunciation, and grammar using the Student Oral Language Observation Matrix (SOLOM Teacher Observation, developed by the San Jose Unified School District in California, 1987). The children’s parents completed a ques-tionnaire on demographics, family background, history of bilingualism (adapted fromRosselli et al., 2000), and developmental problems (adapted fromMatute et al., 2007). All questionnaires and consent forms were written in both Spanish and English. The average level of education for the mothers and fathers was 12.44 years (SD¼3.83) and 11.37 years (SD¼4.41), respectively.
The following inclusion criteria were applied:
(a) Hispanic/Latino children were between the ages of 5 and 14. For this study, Hispanic/Latino children were defined as those individuals residing in the USA who traced their family background to a Spanish-speaking country, identified themselves as Hispanic or Latino, and are Spanish/English bilinguals (Marin & Marin, 1991). In our sample, the parents of the children were all immigrants from a Latin American country: 44 from Mexico, 19 from Cuba, 16 from Colombia, 10 from Puerto Rico, 6 from Peru, 6 from Venezuela, 5 from Ecuador, 1 from Guatemala, and 1 from Nicaragua.
(b) Standard scores of 7 or above on Block Design and Vocabulary subtests from the Spanish version of the Wechsler Intelligence Scale for Children-IV (WISC-IV;Wechsler, 2004). The Block Design subtest was chosen since it is 220 M. Rosselli et al. / Archives of Clinical Neuropsychology 25 (2010) 218–235
at Florida International University on April 30, 2010
http://acn.oxfordjournals.org
commonly regarded as the best predictor of nonverbal intelligence (Matarazzo, 1972). The Spanish vocabulary subtest was administered as a measure of basic Spanish lexicon.
(c) Children with a negative history of neurological disorders (epilepsy, neurosurgery, closed head trauma with loss of consciousness or post-traumatic amnesia, or any other significant neurological antecedents) or a psychiatric con-dition were excluded based on a structured telephone interview with the child’s parent or legal guardian.
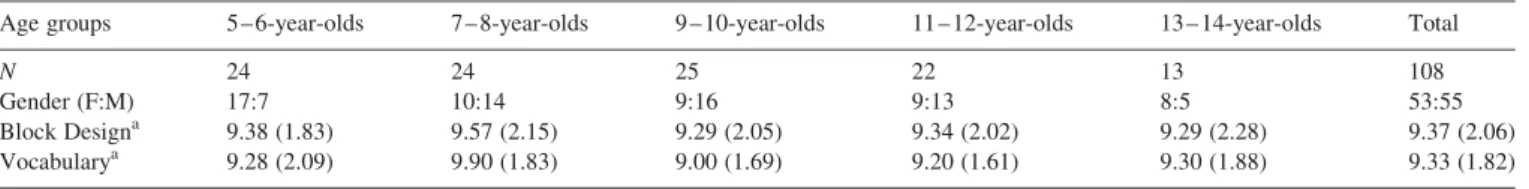
Table1presents the distribution of the sample.
To determine the child’s language history and degree of bilingualism, the parents of each participant completed a question-naire in which they rated the percentage of time that the child used Spanish and English: (a) at home with family; (b) at school with friends; and (c) in general. Parents were also asked to indicate the percentage of time that the child spent reading and watching television in the two languages. Data on the parents’ demographics and language background were also collected. In this sample, there was a rough equivalence of children born in Latin America (53%) and the USA (47%). Regardless of the country of origin, the primary language spoken in the home was Spanish. With the exception of 12 children, who were reported to have learned Spanish and English simultaneously, the native language was Spanish (L1) and the second language was English (L2). To the question—“How much of the time do you currently use Spanish at home?”—94 participants (87%) reported Spanish as the language they used more than 60% of the time; 8 (7.4%) reported using Spanish at home from 20% to 40% of the time; and 6 (5.5%) used Spanish only 20% of the time. Time spent using English at home was as follows: 61 of participants (56%) reported using English less than 20% of the time; 16 (15%) used it between 20% and 40% of the time; 15 (14%) between 40% and 60%; and 16 (15%) between 60% and 80% of the time.
At the time of testing, all participants were attending English-language schools. The mean time of exposure to English at an American school was variable, but all participants had received formal education in English in the USA for several years (mean¼4.03; SD¼2.25). Eighty-six (80%) participants reported using Spanish at school less than 60% of the time, with more than half of them (53, or 49%) indicating no use at all, whereas 22 (20%) reported using Spanish at school between 60% and 80% of the time. With regard to English usage at school, 90 (83%) participants reported using English more than 60% of the time, whereas 18 (17%) used English between 20% and 60% of the time. It is clear from these responses that the bilingual sample in this study was exposed to both languages, though in different environments: The use of Spanish was concentrated in the home, whereas English was spoken mostly at school. However, children were also exposed to English in the home through other means. Ninety-two participants (85%) reported watching TV in English more than half of the time, and 68 of the bilingual children (63%) reported that they almost never watched TV in Spanish. With respect to language preference, 42% of the children preferred Spanish, 27% preferred English, and 31% had no preference. Thus, it seems reasonable to conclude that the bilingual sample of this study was actively exposed to both languages at the moment of data collection, though the majority chose Spanish as their preferred language.
Instruments
Each child was assessed using the following tests:
(1)The Block Design subtest from the Spanish version of the WISC-IV (Wechsler, 2004). This is a core perceptual reasoning subtest that measures visual perceptual organization and non-verbal reasoning. It involves concept formation from abstract visual stimuli, which requires good visual perception, simultaneous processing, visual-motor coordination and the ability to separate a whole figure into parts. While viewing a model or picture, the participant uses blocks to recreate a design within a specified time limit. Testing is discontinued after three consecutive incorrect responses.
(2) The Vocabulary subtest from the Spanish version of the WISC-IV (Wechsler, 2004). This is an untimed core verbal comprehension subtest that measures the child’s knowledge of words, overall fund of knowledge, and degree of language development. It is also considered to be a measure of verbal concept formation, learning ability and long-term memory.
Table 1. Characteristics of the sample
Age groups 5 – 6-year-olds 7 – 8-year-olds 9 – 10-year-olds 11 – 12-year-olds 13 – 14-year-olds Total
N 24 24 25 22 13 108
Gender (F:M) 17:7 10:14 9:16 9:13 8:5 53:55
Block Designa 9.38 (1.83) 9.57 (2.15) 9.29 (2.05) 9.34 (2.02) 9.29 (2.28) 9.37 (2.06)
Vocabularya 9.28 (2.09) 9.90 (1.83) 9.00 (1.69) 9.20 (1.61) 9.30 (1.88) 9.33 (1.82)
a
Scaled Scores, mean (SD).
M. Rosselli et al. / Archives of Clinical Neuropsychology 25 (2010) 218–235 221
at Florida International University on April 30, 2010
http://acn.oxfordjournals.org
In accordance with the Spanish guidelines for administering the WISC-IV, the subtests were presented in Spanish, though the child’s responses were accepted in either that language or in English.
(3) The following domains from the ENI (Matute et al., 2007) were analyzed.
Constructional abilities. To assess visuospatial processing, it includes four subtests: Stick construction, copying figures, copying a complex figure, and drawing a human figure. These tasks require the child to reproduce stick constructions from a model, to copy several simple models and one complex two-dimensional geometric design, and to draw a human figure. To test the external validity of the copying subtests of this domain,Matute and colleagues (2007)used the WISC-R Object Assembly and Block Design and found significant correlations. The Cronbach’s Alpha Test for this domain in this study was .82.
Verbal memory coding. To assess the ability to learn new verbal information involving word and story learning, the subtests require the immediate recall of a list of 12 words presented four times and the free recall of a passage presented only once. Significant correlations between the scores on these subtests and those of the Woodcock – Munoz Memory for Names (.46) and Memory for Sentences (.42) subtests have been reported (Matute et al., 2007). The Cronbach’s Alpha Test for the items included in this domain in the sample studied was .93.
Visual memory coding. To assess the ability to learn new nonverbal information, this procedure involves one subtest that requires the immediate recall of 12 geometrical figures presented over four trials. Scores on this subtest have been shown to correlate significantly (.60) with scores on the Woodcock – Munoz visual auditory learning test (Matute et al., 2007). The Cronbach’s Alpha Test for this domain in the population studied was .95.
Delayed verbal recall. To evaluate the ability to recall previously learned verbal information, it includes the delayed recall of words (free recall, cue recall, and recognition) and the delayed recall of a story. External validity for these subtests has been reported by Matute and colleagues (2007) using the delayed memory subtests from the Woodcock – Munoz battery. The Cronbach’s Alpha Test for this domain was .88.
Delayed visual recall. To evaluate the ability to recall previously learned non-verbal information, it includes delayed free and cue recall and the recall of the recognition of geometrical figures.Matute and colleagues (2007)have shown that scores on these subtests correlate significantly with scores on the Delayed Recall-Visual Auditory Learning Test (.75) from the Woodcock – Munoz battery. The Cronbach’s Alpha Test for this domain was .91.
Visual perception. To test the ability to identify visual stimuli, this includes the recognition of superimposed figures and blurry images of objects, visual closure (identification of incomplete drawings), object integration (integration of the parts that make up an object), and recognition of facial emotional expressions. The Cronbach’s Alpha Test for this domain in the population studied was .83.
Auditory perception. To evaluate the capacity to identify verbal and non-verbal auditory stimuli by including subtests related to discrimination between two musical notes, recognition of environmental sounds, and perception of the difference between simple phonological contrasts. The Cronbach’s Alpha Test for the items included in this domain was .73.
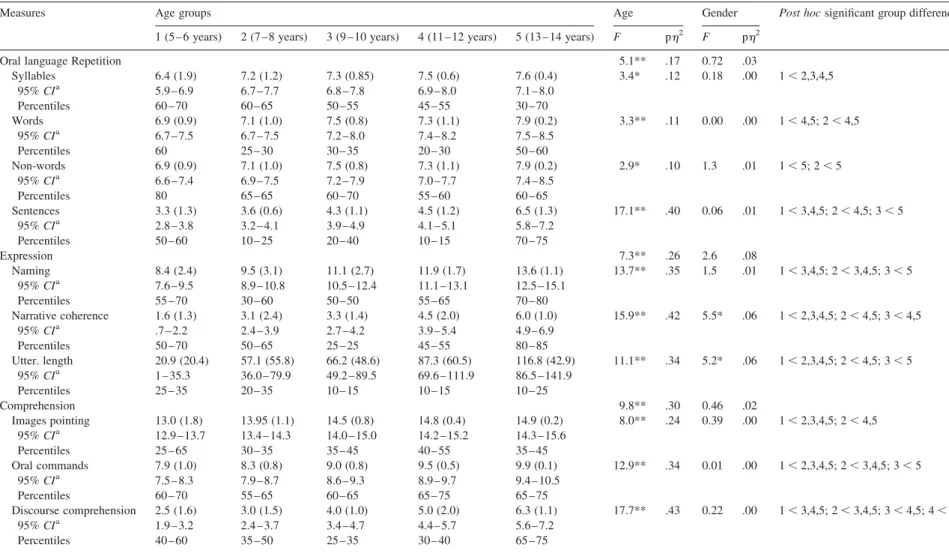
Oral language. This item evaluates the ability to produce spontaneous speech, name common objects, repeat verbal infor-mation, and comprehend commands. It includes three subsections: Language repetition (of syllables, words, non-words, and sentences), language expression (naming objects, narrative coherence, and narrative length measured by the number of words generated when repeating a story), and language comprehension (image pointing, oral commands, and discourse comprehen-sion). The Cronbach’s Alpha Test in this study for the language repetition subtests was .77, for language expression .68, and for language comprehension .80.
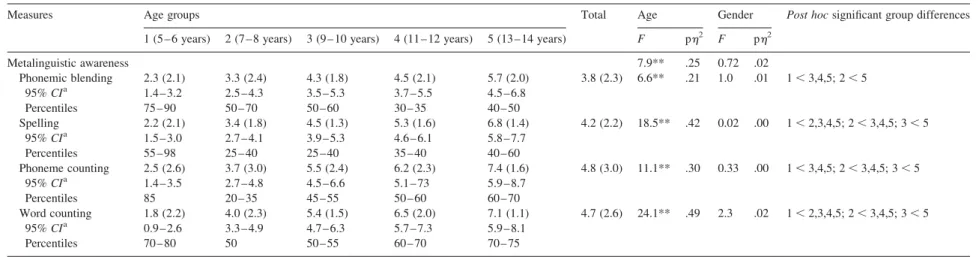
Metalinguistic awareness. To assess the ability to process the units of language by counting or blending phonemes in words and counting words in sentences. This domain includes phonemic blending within a word, spelling, phoneme counting within a word, and word counting within a sentence. The Cronbach’s Alpha Test for this domain was .87.
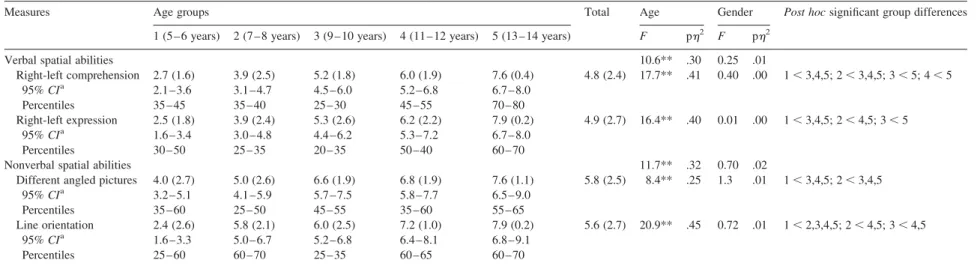
Verbal spatial abilities. This includes tasks that test the ability to express and comprehend verbal spatial terms such as right and left. The child is required to perform right – left orientation commands using a map and to describe the right – left orien-tation of actions performed by the examiner on the same map. The Cronbach’s Alpha Test for this domain was .92.
Nonverbal spatial skills. To assess visuospatial processing, it includes line orientation (the selection of lines from an array that correspond to a target) and different angle pictures (matching a target drawing of an object with the same object seen from different angles). The Cronbach’s Alpha Test for this domain was .69.
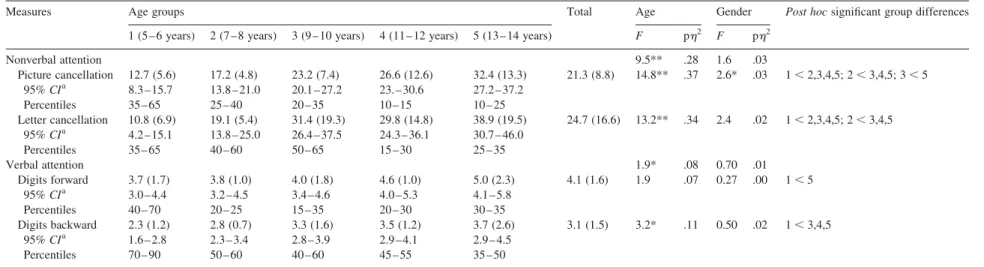
Verbal attention. To assess auditory attention while performing an immediate memory recall task, including digits forward and digits backward. The Cronbach’s Alpha Test for this domain was .79.
Visual attention. Designed to assess sustained visual attention, this includes two cancellation tasks. First—drawing cancellation— the child is asked to cross out the largest rabbits in arrays of figures of two different sizes. The second is a letter cancellation task that requires the child to cross out the letter X only if it is preceded by an A in an array of six different letters. The Cronbach’s Alpha Test for this domain was .83.
222 M. Rosselli et al. / Archives of Clinical Neuropsychology 25 (2010) 218–235
at Florida International University on April 30, 2010
http://acn.oxfordjournals.org
Concept formation and reasoning. To assess abstract abilities and conceptualization, it includes the subtests similarities (establish communalities between pairs of words), matrixes (visual pattern matching), and arithmetical problem tests (word problems). The Cronbach’s Alpha Test for this domain was .82.
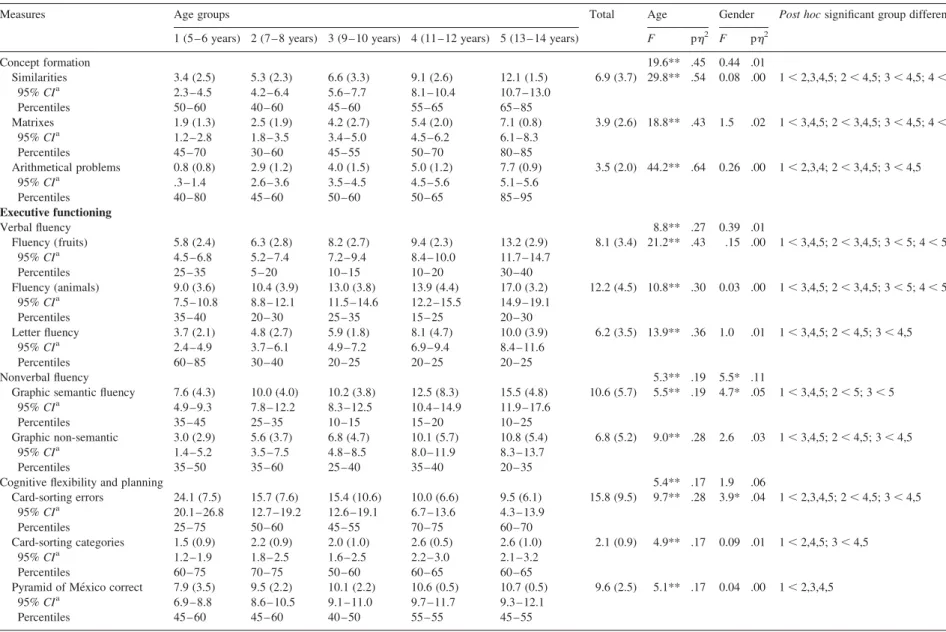
Executive functioning. This was assessed on the basis of three verbal and two graphic fluency tasks, a cognitive flexibility task and a planning task. The verbal fluency tasks include two semantic fluency exercises, in which the child must recall the names of fruits and animals in 1 min, and one letter fluency task (to recall words that start with the letter M in 1 min). The Cronbach’s Alpha Test for the verbal fluency tests was .85. The graphic fluency subtests were used to assess nonverbal execu-tive functioning. It includes a nonverbal semantic task (drawing meaningful figures) and a nonverbal non-semantic task (drawing geometric figures using four lines to connect five dots) within a time limit (3 min), each in a 57 square matrix. The Cronbach’s Alpha Test for the nonverbal fluency tests was .77. The cognitive flexibility test was used to evaluate concept formation, the ability to switch, and planning strategies. It includes a card-sorting task that requires the assembly of three categories (color, form, and number) based on feedback from the examiner. The last test included in the executive functioning domain was the planning test call the pyramid of Mexico, which requires the construction of designated square towers using the lowest possible number of moves (Matute et al., 2008). The Cronbach’s Alpha Test for the cognitive flexibility and planning tasks was .66.
Procedure
Several elementary and middle schools from each of the target U.S. counties (Miami-Dade, Denver) were contacted. Letters written in both languages with information on the study were mailed to the children’s parents. Those who agreed to participate (and signed the consent form) were interviewed using a structured guide. All children agreed to participate voluntarily after the appropriate consent form was signed by a parent or legal guardian. Children who met the inclusion criteria and agreed to par-ticipate were tested in two sessions, each of approximately 90 min duration. Each child received a small gift (e.g., a card or small toy) for participating in the study. Testing was conducted in Spanish by native Spanish speakers. All testers were research assistants and graduate students in psychology and were specially trained to administer and score the ENI. In all cases, training was performed by one of the authors of this paper in accordance with the ENI manual (Matute et al., 2007). Every test was scored twice with an average inter-rater reliability of .96. Some children included English words in the WISC-IV Spanish Vocabulary subtest and the Naming subtest of the ENI. Answers given in English were accepted.
Statistical Analyses
To analyze the influence of participants’ age on each cognitive domain, 19 multivariate covariance analyses (MANCOVA) were used, one for each of the cognitive domains, with the exception of language, for which separate analyses of covariance (ANCOVAs) were performed for language repetition, expression, and comprehension. Owing to the unbalanced distribution of gender across the age groups, this factor was included as a covariant in all comparisons. All the dependent measures (subtests) incorporated in each domain were included as the multivariate factor. The five age groups (5 – 6, 7 – 8, 9 – 10, 11 – 12, and 13 – 14) were the between-subject factors. After obtaining the Hotelling’s multivariate T-tests, independent covariate analyses (ANCOVAs) were used to analyze the age effects for the dependent measures of each cognitive domain. Additional two-way ANOVAs were performed for those subtests in which gender was a significant covariate in order to check for inter-actions between gender and age. The effect sizes were assessed using partial eta2(ph2) for overall group differences.Post hoc
analyses using Tukey’s HSD test were carried out to compare the mean differences between age groups for each subtest. This test was employed to reduce the possibility of finding significant differences by chance due to multiple comparisons.
Results
Tables2–9present the scores obtained in the different subtests by the bilingual participants from different age groups using gender as a covariant. An age effect was significant for all cognitive domains and all subtests, with scores increasing across the different age ranges. However, the size effects varied across cognitive tasks with no such effect in the large range (Cumming & Finch, 2001). Medium-size effects (.5 – .7) were observed for copying a complex figure, visual learning, the two recognition memory tasks and superimposed figures, similarities, and arithmetical word problems. Small-size effects (.2 – .4) were seen for blurry images, visual closure, and object integration, perception of environmental sounds, repetition of sentences, all oral expression and comprehension language subtests, metalinguistic tasks, verbal and nonverbal spatial abilities, nonverbal attention subtests, matrixes, verbal fluency, graphic non-semantic fluency, and card-sorting errors. Very small-size effects (between .1 and .2) were observed for facial expressions, musical notes discrimination, repetition of syllables, words and
non-M. Rosselli et al. / Archives of Clinical Neuropsychology 25 (2010) 218–235 223
at Florida International University on April 30, 2010
http://acn.oxfordjournals.org
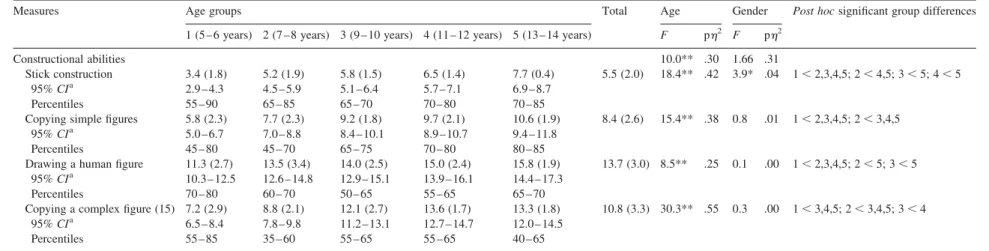
Table 2. Mean test scores and standard deviations (in parenthesis) for the age groups in the different constructional abilities subtests
Measures Age groups Total Age Gender Post hocsignificant group differences
1 (5 – 6 years) 2 (7 – 8 years) 3 (9 – 10 years) 4 (11 – 12 years) 5 (13 – 14 years) F ph2 F ph2
Constructional abilities 10.0** .30 1.66 .31
Stick construction 3.4 (1.8) 5.2 (1.9) 5.8 (1.5) 6.5 (1.4) 7.7 (0.4) 5.5 (2.0) 18.4** .42 3.9* .04 1,2,3,4,5; 2,4,5; 3,5; 4,5
95%CIa 2.9 – 4.3 4.5– 5.9 5.1 – 6.4 5.7 – 7.1 6.9 – 8.7
Percentiles 55 – 90 65 – 85 65 – 70 70 – 80 70 – 85
Copying simple figures 5.8 (2.3) 7.7 (2.3) 9.2 (1.8) 9.7 (2.1) 10.6 (1.9) 8.4 (2.6) 15.4** .38 0.8 .01 1,2,3,4,5; 2,3,4,5
95%CIa 5.0 – 6.7 7.0– 8.8 8.4 – 10.1 8.9 – 10.7 9.4 – 11.8
Percentiles 45 – 80 45 – 70 65 – 75 70 – 80 80 – 85
Drawing a human figure 11.3 (2.7) 13.5 (3.4) 14.0 (2.5) 15.0 (2.4) 15.8 (1.9) 13.7 (3.0) 8.5** .25 0.1 .00 1,2,3,4,5; 2,5; 3,5 95%CIa 10.3 – 12.5 12.6 – 14.8 12.9 – 15.1 13.9 – 16.1 14.4 – 17.3
Percentiles 70 – 80 60 – 70 50 – 65 55 – 65 65 – 70
Copying a complex figure (15) 7.2 (2.9) 8.8 (2.1) 12.1 (2.7) 13.6 (1.7) 13.3 (1.8) 10.8 (3.3) 30.3** .55 0.3 .00 1,3,4,5; 2,3,4,5; 3,4
95%CIa 6.5 – 8.4 7.8– 9.8 11.2 – 13.1 12.7 – 14.7 12.0 – 14.5
Percentiles 55 – 85 35 – 60 55 – 65 55 – 65 40 – 65
Notes:ENI¼Evaluacio´n Neuropsicolo´gica Infantil; MANCOVA¼multivariate analysis of covariance; ANCOVA¼analysis of covariance. MANCOVA and ANCOVAFs and the partial eta square (ph)2for age are presented using gender as covariate.Post hocanalyses (Tukey’s test) compared the group means. The percentiles indicate the standard scores of mean values according to the ENI norms for each age group.
aConfidence interval lower and upper bound.
*p,.01. **p,.001.
224
M.
Ro
sselli
et
al.
/
Ar
chiv
es
of
Clinical
Neur
opsych
ology
25
(2010)
218–235
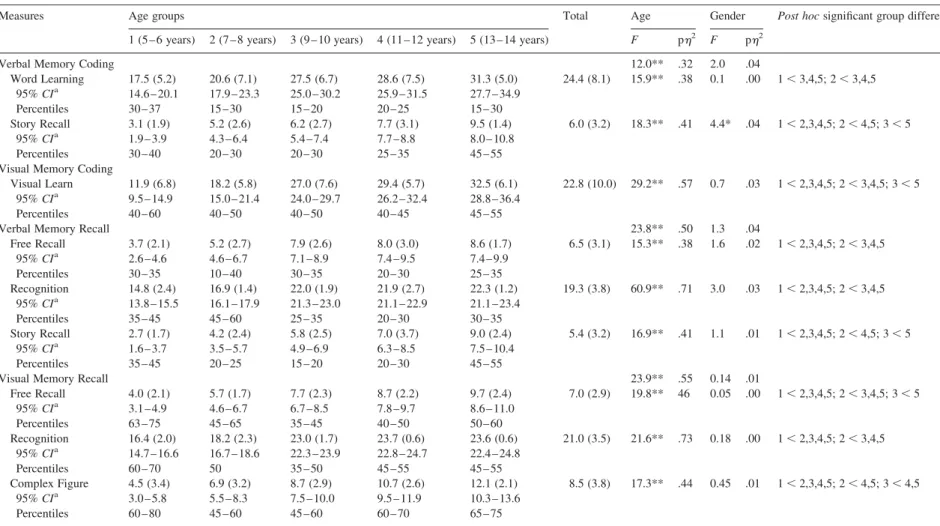
Table 3. Mean test scores and standard deviations (in parenthesis) for the age groups in the different verbal and nonverbal memory tests
Measures Age groups Total Age Gender Post hocsignificant group differences
1 (5 – 6 years) 2 (7 – 8 years) 3 (9 – 10 years) 4 (11 – 12 years) 5 (13 – 14 years) F ph2 F ph2
Verbal Memory Coding 12.0** .32 2.0 .04
Word Learning 17.5 (5.2) 20.6 (7.1) 27.5 (6.7) 28.6 (7.5) 31.3 (5.0) 24.4 (8.1) 15.9** .38 0.1 .00 1,3,4,5; 2,3,4,5 95%CIa 14.6 – 20.1 17.9 – 23.3 25.0 – 30.2 25.9 – 31.5 27.7 – 34.9
Percentiles 30 – 37 15 – 30 15 – 20 20 – 25 15 – 30
Story Recall 3.1 (1.9) 5.2 (2.6) 6.2 (2.7) 7.7 (3.1) 9.5 (1.4) 6.0 (3.2) 18.3** .41 4.4* .04 1,2,3,4,5; 2,4,5; 3,5
95%CIa 1.9 – 3.9 4.3 – 6.4 5.4 – 7.4 7.7 – 8.8 8.0 – 10.8
Percentiles 30 – 40 20 – 30 20 – 30 25 – 35 45 – 55
Visual Memory Coding
Visual Learn 11.9 (6.8) 18.2 (5.8) 27.0 (7.6) 29.4 (5.7) 32.5 (6.1) 22.8 (10.0) 29.2** .57 0.7 .03 1,2,3,4,5; 2,3,4,5; 3,5 95%CIa 9.5 – 14.9 15.0 – 21.4 24.0 – 29.7 26.2 – 32.4 28.8 – 36.4
Percentiles 40 – 60 40 – 50 40 – 50 40 – 45 45 – 55
Verbal Memory Recall 23.8** .50 1.3 .04
Free Recall 3.7 (2.1) 5.2 (2.7) 7.9 (2.6) 8.0 (3.0) 8.6 (1.7) 6.5 (3.1) 15.3** .38 1.6 .02 1,2,3,4,5; 2,3,4,5
95%CIa 2.6 – 4.6 4.6 – 6.7 7.1 – 8.9 7.4 – 9.5 7.4 – 9.9
Percentiles 30 – 35 10 – 40 30 – 35 20 – 30 25 – 35
Recognition 14.8 (2.4) 16.9 (1.4) 22.0 (1.9) 21.9 (2.7) 22.3 (1.2) 19.3 (3.8) 60.9** .71 3.0 .03 1,2,3,4,5; 2,3,4,5 95%CIa 13.8 – 15.5 16.1 – 17.9 21.3 – 23.0 21.1 – 22.9 21.1 – 23.4
Percentiles 35 – 45 45 – 60 25 – 35 20 – 30 30 – 35
Story Recall 2.7 (1.7) 4.2 (2.4) 5.8 (2.5) 7.0 (3.7) 9.0 (2.4) 5.4 (3.2) 16.9** .41 1.1 .01 1,2,3,4,5; 2,4,5; 3,5
95%CIa 1.6 – 3.7 3.5 – 5.7 4.9 – 6.9 6.3 – 8.5 7.5 – 10.4
Percentiles 35 – 45 20 – 25 15 – 20 20 – 30 45 – 55
Visual Memory Recall 23.9** .55 0.14 .01
Free Recall 4.0 (2.1) 5.7 (1.7) 7.7 (2.3) 8.7 (2.2) 9.7 (2.4) 7.0 (2.9) 19.8** 46 0.05 .00 1,2,3,4,5; 2,3,4,5; 3,5
95%CIa 3.1 – 4.9 4.6 – 6.7 6.7 – 8.5 7.8 – 9.7 8.6 – 11.0
Percentiles 63 – 75 45 – 65 35 – 45 40 – 50 50 – 60
Recognition 16.4 (2.0) 18.2 (2.3) 23.0 (1.7) 23.7 (0.6) 23.6 (0.6) 21.0 (3.5) 21.6** .73 0.18 .00 1,2,3,4,5; 2,3,4,5 95%CIa 14.7 – 16.6 16.7 – 18.6 22.3 – 23.9 22.8 – 24.7 22.4 – 24.8
Percentiles 60 – 70 50 35 – 50 45 – 55 45 – 55
Complex Figure 4.5 (3.4) 6.9 (3.2) 8.7 (2.9) 10.7 (2.6) 12.1 (2.1) 8.5 (3.8) 17.3** .44 0.45 .01 1,2,3,4,5; 2,4,5; 3,4,5
95%CIa 3.0 – 5.8 5.5 – 8.3 7.5 – 10.0 9.5 – 11.9 10.3 – 13.6
Percentiles 60 – 80 45 – 60 45 – 60 60 – 70 65 – 75
Notes:ENI¼Evaluacio´n Neuropsicolo´gica Infantil; MANCOVA¼multivariate analysis of covariance; ANCOVA¼analysis of covariance. MANCOVA and ANCOVAFs and the partial eta square (ph)2forage are presented using gender as covariate.Post hocanalyses (Tukey’s test) compared the group means. The percentiles indicate the standard scores of mean values according to the ENI norms for each age group.
a
Confidence interval lower and upper bound. *p,.01.
**p,.001.
M.
Ro
sselli
et
al.
/
Ar
chiv
es
of
Clinical
Neur
opsych
ology
25
(2010)
218–235
225
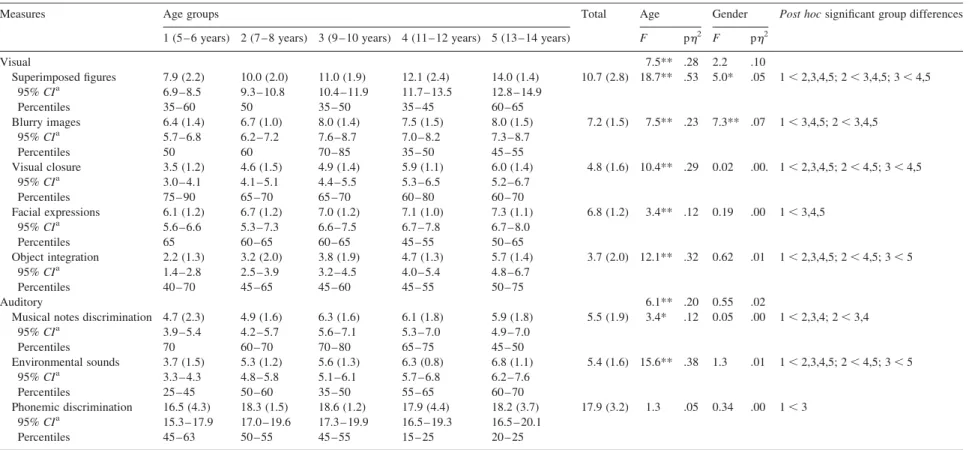
Table 4. Mean test scores and standard deviations (in parenthesis) for the age group in the different sensory-perception subtests
Measures Age groups Total Age Gender Post hocsignificant group differences
1 (5 – 6 years) 2 (7 – 8 years) 3 (9 – 10 years) 4 (11 – 12 years) 5 (13 – 14 years) F ph2 F ph2
Visual 7.5** .28 2.2 .10
Superimposed figures 7.9 (2.2) 10.0 (2.0) 11.0 (1.9) 12.1 (2.4) 14.0 (1.4) 10.7 (2.8) 18.7** .53 5.0* .05 1,2,3,4,5; 2,3,4,5; 3,4,5 95%CIa 6.9 – 8.5 9.3 – 10.8 10.4 – 11.9 11.7 – 13.5 12.8 – 14.9
Percentiles 35 – 60 50 35 – 50 35 – 45 60 – 65
Blurry images 6.4 (1.4) 6.7 (1.0) 8.0 (1.4) 7.5 (1.5) 8.0 (1.5) 7.2 (1.5) 7.5** .23 7.3** .07 1,3,4,5; 2,3,4,5
95%CIa 5.7 – 6.8 6.2 – 7.2 7.6 – 8.7 7.0 – 8.2 7.3 – 8.7
Percentiles 50 60 70 – 85 35 – 50 45 – 55
Visual closure 3.5 (1.2) 4.6 (1.5) 4.9 (1.4) 5.9 (1.1) 6.0 (1.4) 4.8 (1.6) 10.4** .29 0.02 .00. 1,2,3,4,5; 2,4,5; 3,4,5
95%CIa 3.0 – 4.1 4.1 – 5.1 4.4 – 5.5 5.3 – 6.5 5.2 – 6.7
Percentiles 75 – 90 65 – 70 65 – 70 60 – 80 60 – 70
Facial expressions 6.1 (1.2) 6.7 (1.2) 7.0 (1.2) 7.1 (1.0) 7.3 (1.1) 6.8 (1.2) 3.4** .12 0.19 .00 1,3,4,5
95%CIa 5.6 – 6.6 5.3 – 7.3 6.6 – 7.5 6.7 – 7.8 6.7 – 8.0
Percentiles 65 60 – 65 60 – 65 45 – 55 50 – 65
Object integration 2.2 (1.3) 3.2 (2.0) 3.8 (1.9) 4.7 (1.3) 5.7 (1.4) 3.7 (2.0) 12.1** .32 0.62 .01 1,2,3,4,5; 2,4,5; 3,5
95%CIa 1.4 – 2.8 2.5 – 3.9 3.2 – 4.5 4.0 – 5.4 4.8 – 6.7
Percentiles 40 – 70 45 – 65 45 – 60 45 – 55 50 – 75
Auditory 6.1** .20 0.55 .02
Musical notes discrimination 4.7 (2.3) 4.9 (1.6) 6.3 (1.6) 6.1 (1.8) 5.9 (1.8) 5.5 (1.9) 3.4* .12 0.05 .00 1,2,3,4; 2,3,4
95%CIa 3.9 – 5.4 4.2 – 5.7 5.6 – 7.1 5.3 – 7.0 4.9 – 7.0
Percentiles 70 60 – 70 70 – 80 65 – 75 45 – 50
Environmental sounds 3.7 (1.5) 5.3 (1.2) 5.6 (1.3) 6.3 (0.8) 6.8 (1.1) 5.4 (1.6) 15.6** .38 1.3 .01 1,2,3,4,5; 2,4,5; 3,5
95%CIa 3.3 – 4.3 4.8 – 5.8 5.1 – 6.1 5.7 – 6.8 6.2 – 7.6
Percentiles 25 – 45 50 – 60 35 – 50 55 – 65 60 – 70
Phonemic discrimination 16.5 (4.3) 18.3 (1.5) 18.6 (1.2) 17.9 (4.4) 18.2 (3.7) 17.9 (3.2) 1.3 .05 0.34 .00 1,3 95%CIa 15.3 – 17.9 17.0 – 19.6 17.3 – 19.9 16.5 – 19.3 16.5 – 20.1
Percentiles 45 – 63 50 – 55 45 – 55 15 – 25 20 – 25
Notes:ENI¼Evaluacio´n Neuropsicolo´gica Infantil; ANCOVA¼analysis of covariance. ANCOVAFs and the partial eta square (ph)2forage are presented using gender as covariate.Post hocanalyses (Tukey’s test) compared the group means. The percentiles indicate the standard scores of mean values according to the ENI norms for each age group.
aConfidence interval lower and upper bound.
*p,.01. **p,.001.
226
M.
Ro
sselli
et
al.
/
Ar
chiv
es
of
Clinical
Neur
opsych
ology
25
(2010)
218–235
Table 5. Mean test scores and standard deviations (in parenthesis) in the different oral language subtest for the bilingual
Measures Age groups Age Gender Post hocsignificant group differences
1 (5 – 6 years) 2 (7 – 8 years) 3 (9 – 10 years) 4 (11 – 12 years) 5 (13 – 14 years) F ph2 F ph2
Oral language Repetition 5.1** .17 0.72 .03
Syllables 6.4 (1.9) 7.2 (1.2) 7.3 (0.85) 7.5 (0.6) 7.6 (0.4) 3.4* .12 0.18 .00 1,2,3,4,5
95%CIa 5.9 – 6.9 6.7 – 7.7 6.8 – 7.8 6.9– 8.0 7.1 – 8.0
Percentiles 60 – 70 60 – 65 50 – 55 45 – 55 30 – 70
Words 6.9 (0.9) 7.1 (1.0) 7.5 (0.8) 7.3 (1.1) 7.9 (0.2) 3.3** .11 0.00 .00 1,4,5; 2,4,5
95%CIa 6.7 – 7.5 6.7 – 7.5 7.2 – 8.0 7.4– 8.2 7.5 – 8.5
Percentiles 60 25 – 30 30 – 35 20 – 30 50 – 60
Non-words 6.9 (0.9) 7.1 (1.0) 7.5 (0.8) 7.3 (1.1) 7.9 (0.2) 2.9* .10 1.3 .01 1,5; 2,5
95%CIa 6.6 – 7.4 6.9 – 7.5 7.2 – 7.9 7.0– 7.7 7.4 – 8.5
Percentiles 80 65 – 65 60 – 70 55 – 60 60 – 65
Sentences 3.3 (1.3) 3.6 (0.6) 4.3 (1.1) 4.5 (1.2) 6.5 (1.3) 17.1** .40 0.06 .01 1,3,4,5; 2,4,5; 3,5
95%CIa 2.8 – 3.8 3.2 – 4.1 3.9 – 4.9 4.1– 5.1 5.8 – 7.2
Percentiles 50 – 60 10 – 25 20 – 40 10 – 15 70 – 75
Expression 7.3** .26 2.6 .08
Naming 8.4 (2.4) 9.5 (3.1) 11.1 (2.7) 11.9 (1.7) 13.6 (1.1) 13.7** .35 1.5 .01 1,3,4,5; 2,3,4,5; 3,5
95%CIa 7.6 – 9.5 8.9 – 10.8 10.5 – 12.4 11.1 – 13.1 12.5 – 15.1
Percentiles 55 – 70 30 – 60 50 – 50 55 – 65 70 – 80
Narrative coherence 1.6 (1.3) 3.1 (2.4) 3.3 (1.4) 4.5 (2.0) 6.0 (1.0) 15.9** .42 5.5* .06 1,2,3,4,5; 2,4,5; 3,4,5
95%CIa .7 – 2.2 2.4 – 3.9 2.7 – 4.2 3.9– 5.4 4.9 – 6.9
Percentiles 50 – 70 50 – 65 25 – 25 45 – 55 80 – 85
Utter. length 20.9 (20.4) 57.1 (55.8) 66.2 (48.6) 87.3 (60.5) 116.8 (42.9) 11.1** .34 5.2* .06 1,2,3,4,5; 2,4,5; 3,5
95%CIa 1 – 35.3 36.0 – 79.9 49.2 – 89.5 69.6 – 111.9 86.5 – 141.9
Percentiles 25 – 35 20 – 35 10 – 15 10 – 15 10 – 25
Comprehension 9.8** .30 0.46 .02
Images pointing 13.0 (1.8) 13.95 (1.1) 14.5 (0.8) 14.8 (0.4) 14.9 (0.2) 8.0** .24 0.39 .00 1,2,3,4,5; 2,4,5 95%CIa 12.9 – 13.7 13.4 – 14.3 14.0 – 15.0 14.2 – 15.2 14.3 – 15.6
Percentiles 25 – 65 30 – 35 35 – 45 40 – 55 35 – 45
Oral commands 7.9 (1.0) 8.3 (0.8) 9.0 (0.8) 9.5 (0.5) 9.9 (0.1) 12.9** .34 0.01 .00 1,2,3,4,5; 2,3,4,5; 3,5
95%CIa 7.5 – 8.3 7.9 – 8.7 8.6 – 9.3 8.9– 9.7 9.4 – 10.5
Percentiles 60 – 70 55 – 65 60 – 65 65 – 75 65 – 75
Discourse comprehension 2.5 (1.6) 3.0 (1.5) 4.0 (1.0) 5.0 (2.0) 6.3 (1.1) 17.7** .43 0.22 .00 1,3,4,5; 2,3,4,5; 3,4,5; 4,5
95%CIa 1.9 – 3.2 2.4 – 3.7 3.4 – 4.7 4.4– 5.7 5.6 – 7.2
Percentiles 40 – 60 35 – 50 25 – 35 30 – 40 65 – 75
Notes:ENI¼Evaluacio´n Neuropsicolo´gica Infantil; MANCOVA¼multivariate analysis of covariance; ANCOVA¼analysis of covariance. MANCOVA and ANCOVAFs and the partial eta square (ph)2for age are presented using gender as covariate.Post hocanalyses (Tukey’s test) compared the group means. The percentiles indicate the standard scores of mean values according to the ENI norms for each age group.
a
Confidence interval lower and upper bound. *p,.01.
**p,.001.
M.
Ro
sselli
et
al.
/
Ar
chiv
es
of
Clinical
Neur
opsych
ology
25
(2010)
218–235
227
Table 6. Mean test scores and standard deviations (in parenthesis) for the age groups on the metalinguistic awareness tests
Measures Age groups Total Age Gender Post hocsignificant group differences
1 (5 – 6 years) 2 (7 – 8 years) 3 (9 – 10 years) 4 (11 – 12 years) 5 (13 – 14 years) F ph2
F ph2
Metalinguistic awareness 7.9** .25 0.72 .02
Phonemic blending 2.3 (2.1) 3.3 (2.4) 4.3 (1.8) 4.5 (2.1) 5.7 (2.0) 3.8 (2.3) 6.6** .21 1.0 .01 1,3,4,5; 2,5
95%CIa 1.4 – 3.2 2.5 – 4.3 3.5 – 5.3 3.7 – 5.5 4.5 – 6.8
Percentiles 75 – 90 50 – 70 50 – 60 30 – 35 40 – 50
Spelling 2.2 (2.1) 3.4 (1.8) 4.5 (1.3) 5.3 (1.6) 6.8 (1.4) 4.2 (2.2) 18.5** .42 0.02 .00 1,2,3,4,5; 2,3,4,5; 3,5
95%CIa 1.5 – 3.0 2.7 – 4.1 3.9 – 5.3 4.6 – 6.1 5.8 – 7.7
Percentiles 55 – 98 25 – 40 25 – 40 35 – 40 40 – 60
Phoneme counting 2.5 (2.6) 3.7 (3.0) 5.5 (2.4) 6.2 (2.3) 7.4 (1.6) 4.8 (3.0) 11.1** .30 0.33 .00 1,3,4,5; 2,3,4,5; 3,5
95%CIa 1.4 – 3.5 2.7 – 4.8 4.5 – 6.6 5.1 – 73 5.9 – 8.7
Percentiles 85 20 – 35 45 – 55 50 – 60 60 – 70
Word counting 1.8 (2.2) 4.0 (2.3) 5.4 (1.5) 6.5 (2.0) 7.1 (1.1) 4.7 (2.6) 24.1** .49 2.3 .02 1,2,3,4,5; 2,3,4,5; 3,5
95%CIa 0.9 – 2.6 3.3 – 4.9 4.7 – 6.3 5.7 – 7.3 5.9 – 8.1
Percentiles 70 – 80 50 50 – 55 60 – 70 70 – 75
Notes:ENI¼Evaluacio´n Neuropsicolo´gica Infantil; MANCOVA¼multivariate analysis of covariance; ANCOVA¼analysis of covariance. MANCOVA and ANCOVAFs and the partial eta square (ph)2for age are presented using gender as covariate.Post hocanalyses (Tukey’s test) compared the group means. The percentiles indicate the standard scores of mean values according to the ENI norms for each age group.p,.01.
a
Confidence interval lower and upper bound. **p,.001.
228
M.
Ro
sselli
et
al.
/
Ar
chiv
es
of
Clinical
Neur
opsych
ology
25
(2010)
218–235
Table 7. Means and standard deviations (in parenthesis) for the age groups in the different visuospatial tests
Measures Age groups Total Age Gender Post hocsignificant group differences
1 (5 – 6 years) 2 (7 – 8 years) 3 (9 – 10 years) 4 (11 – 12 years) 5 (13 – 14 years) F ph2 F ph2
Verbal spatial abilities 10.6** .30 0.25 .01
Right-left comprehension 2.7 (1.6) 3.9 (2.5) 5.2 (1.8) 6.0 (1.9) 7.6 (0.4) 4.8 (2.4) 17.7** .41 0.40 .00 1,3,4,5; 2,3,4,5; 3,5; 4,5 95%CIa
2.1 – 3.6 3.1 – 4.7 4.5 – 6.0 5.2 – 6.8 6.7 – 8.0
Percentiles 35 – 45 35 – 40 25 – 30 45 – 55 70 – 80
Right-left expression 2.5 (1.8) 3.9 (2.4) 5.3 (2.6) 6.2 (2.2) 7.9 (0.2) 4.9 (2.7) 16.4** .40 0.01 .00 1,3,4,5; 2,4,5; 3,5
95%CIa 1.6 – 3.4 3.0 – 4.8 4.4 – 6.2 5.3 – 7.2 6.7 – 8.0
Percentiles 30 – 50 25 – 35 20 – 35 50 – 40 60 – 70
Nonverbal spatial abilities 11.7** .32 0.70 .02
Different angled pictures 4.0 (2.7) 5.0 (2.6) 6.6 (1.9) 6.8 (1.9) 7.6 (1.1) 5.8 (2.5) 8.4** .25 1.3 .01 1,3,4,5; 2,3,4,5
95%CIa 3.2 – 5.1 4.1 – 5.9 5.7 – 7.5 5.8 – 7.7 6.5 – 9.0
Percentiles 35 – 60 25 – 50 45 – 55 35 – 60 55 – 65
Line orientation 2.4 (2.6) 5.8 (2.1) 6.0 (2.5) 7.2 (1.0) 7.9 (0.2) 5.6 (2.7) 20.9** .45 0.72 .01 1,2,3,4,5; 2,4,5; 3,4,5 95%CIa
1.6 – 3.3 5.0 – 6.7 5.2 – 6.8 6.4 – 8.1 6.8 – 9.1
Percentiles 25 – 60 60 – 70 25 – 35 60 – 65 60 – 70
Notes:ENI¼Evaluacio´n Neuropsicolo´gica Infantil; MANCOVA¼multivariate analysis of covariance; ANCOVA¼analysis of covariance. MANCOVA and ANCOVAFs and the partial eta square (ph)2for age are presented using gender as covariate.Post hocanalyses (Tukey’s test) compared the group means. The percentiles indicate the standard scores of mean values according to the ENI norms for each age group.
a
Confidence interval lower and upper bound. *p,.01.
**p,.001.
M.
Ro
sselli
et
al.
/
Ar
chiv
es
of
Clinical
Neur
opsych
ology
25
(2010)
218–235
229
Table 8. Means and standard deviations (in parenthesis) for the age groups in attention tests
Measures Age groups Total Age Gender Post hocsignificant group differences
1 (5 – 6 years) 2 (7 – 8 years) 3 (9 – 10 years) 4 (11 – 12 years) 5 (13 – 14 years) F ph2
F ph2
Nonverbal attention 9.5** .28 1.6 .03
Picture cancellation 12.7 (5.6) 17.2 (4.8) 23.2 (7.4) 26.6 (12.6) 32.4 (13.3) 21.3 (8.8) 14.8** .37 2.6* .03 1,2,3,4,5; 2,3,4,5; 3,5 95%CIa 8.3 – 15.7 13.8 – 21.0 20.1 – 27.2 23. – 30.6 27.2 – 37.2
Percentiles 35 – 65 25 – 40 20 – 35 10 – 15 10 – 25
Letter cancellation 10.8 (6.9) 19.1 (5.4) 31.4 (19.3) 29.8 (14.8) 38.9 (19.5) 24.7 (16.6) 13.2** .34 2.4 .02 1,2,3,4,5; 2,3,4,5 95%CIa 4.2 – 15.1 13.8 – 25.0 26.4 – 37.5 24.3 – 36.1 30.7 – 46.0
Percentiles 35 – 65 40 – 60 50 – 65 15 – 30 25 – 35
Verbal attention 1.9* .08 0.70 .01
Digits forward 3.7 (1.7) 3.8 (1.0) 4.0 (1.8) 4.6 (1.0) 5.0 (2.3) 4.1 (1.6) 1.9 .07 0.27 .00 1,5
95%CIa 3.0 – 4.4 3.2 – 4.5 3.4 – 4.6 4.0 – 5.3 4.1 – 5.8
Percentiles 40 – 70 20 – 25 15 – 35 20 – 30 30 – 35
Digits backward 2.3 (1.2) 2.8 (0.7) 3.3 (1.6) 3.5 (1.2) 3.7 (2.6) 3.1 (1.5) 3.2* .11 0.50 .02 1,3,4,5
95%CIa 1.6 – 2.8 2.3 – 3.4 2.8 – 3.9 2.9 – 4.1 2.9 – 4.5
Percentiles 70 – 90 50 – 60 40 – 60 45 – 55 35 – 50
Notes:ENI¼Evaluacio´n Neuropsicolo´gica Infantil; MANCOVA¼multivariate analysis of covariance; ANCOVA¼analysis of covariance. MANCOVA and ANCOVAFs and the partial eta square (ph)2for age are presented using gender as covariate.Post hocanalyses (Tukey’s test) compared the group means. The percentiles indicate the standard scores of mean values according to the ENI norms for each age group.
a
Confidence interval lower and upper bound. *p,.01.
**p,.001.
230
M.
Ro
sselli
et
al.
/
Ar
chiv
es
of
Clinical
Neur
opsych
ology
25
(2010)
218–235
Table 9. Means and standard deviations (in parenthesis) for the bilingual group in the concept formation and executive function tests
Measures Age groups Total Age Gender Post hocsignificant group differences
1 (5 – 6 years) 2 (7 – 8 years) 3 (9 – 10 years) 4 (11 – 12 years) 5 (13 – 14 years) F ph2 F ph2
Concept formation 19.6** .45 0.44 .01
Similarities 3.4 (2.5) 5.3 (2.3) 6.6 (3.3) 9.1 (2.6) 12.1 (1.5) 6.9 (3.7) 29.8** .54 0.08 .00 1,2,3,4,5; 2,4,5; 3,4,5; 4,5
95%CIa 2.3 – 4.5 4.2 – 6.4 5.6 – 7.7 8.1 – 10.4 10.7 – 13.0
Percentiles 50 – 60 40 – 60 45 – 60 55 – 65 65 – 85
Matrixes 1.9 (1.3) 2.5 (1.9) 4.2 (2.7) 5.4 (2.0) 7.1 (0.8) 3.9 (2.6) 18.8** .43 1.5 .02 1,3,4,5; 2,3,4,5; 3,4,5; 4,5
95%CIa 1.2 – 2.8 1.8 – 3.5 3.4 – 5.0 4.5 – 6.2 6.1 – 8.3
Percentiles 45 – 70 30 – 60 45 – 55 50 – 70 80 – 85
Arithmetical problems 0.8 (0.8) 2.9 (1.2) 4.0 (1.5) 5.0 (1.2) 7.7 (0.9) 3.5 (2.0) 44.2** .64 0.26 .00 1,2,3,4; 2,3,4,5; 3,4,5
95%CIa .3 – 1.4 2.6 – 3.6 3.5 – 4.5 4.5 – 5.6 5.1 – 5.6
Percentiles 40 – 80 45 – 60 50 – 60 50 – 65 85 – 95
Executive functioning
Verbal fluency 8.8** .27 0.39 .01
Fluency (fruits) 5.8 (2.4) 6.3 (2.8) 8.2 (2.7) 9.4 (2.3) 13.2 (2.9) 8.1 (3.4) 21.2** .43 .15 .00 1,3,4,5; 2,3,4,5; 3,5; 4,5
95%CIa 4.5 – 6.8 5.2 – 7.4 7.2 – 9.4 8.4 – 10.0 11.7 – 14.7
Percentiles 25 – 35 5 – 20 10 – 15 10 – 20 30 – 40
Fluency (animals) 9.0 (3.6) 10.4 (3.9) 13.0 (3.8) 13.9 (4.4) 17.0 (3.2) 12.2 (4.5) 10.8** .30 0.03 .00 1,3,4,5; 2,3,4,5; 3,5; 4,5 95%CIa 7.5 – 10.8 8.8 – 12.1 11.5 – 14.6 12.2 – 15.5 14.9 – 19.1
Percentiles 35 – 40 20 – 30 25 – 35 15 – 25 20 – 30
Letter fluency 3.7 (2.1) 4.8 (2.7) 5.9 (1.8) 8.1 (4.7) 10.0 (3.9) 6.2 (3.5) 13.9** .36 1.0 .01 1,3,4,5; 2,4,5; 3,4,5 95%CIa
2.4 – 4.9 3.7 – 6.1 4.9 – 7.2 6.9 – 9.4 8.4 – 11.6
Percentiles 60 – 85 30 – 40 20 – 25 20 – 25 20 – 25
Nonverbal fluency 5.3** .19 5.5* .11
Graphic semantic fluency 7.6 (4.3) 10.0 (4.0) 10.2 (3.8) 12.5 (8.3) 15.5 (4.8) 10.6 (5.7) 5.5** .19 4.7* .05 1,3,4,5; 2,5; 3,5
95%CIa 4.9 – 9.3 7.8 – 12.2 8.3 – 12.5 10.4 – 14.9 11.9 – 17.6
Percentiles 35 – 45 25 – 35 10 – 15 15 – 20 10 – 25
Graphic non-semantic 3.0 (2.9) 5.6 (3.7) 6.8 (4.7) 10.1 (5.7) 10.8 (5.4) 6.8 (5.2) 9.0** .28 2.6 .03 1,3,4,5; 2,4,5; 3,4,5
95%CIa 1.4 – 5.2 3.5 – 7.5 4.8 – 8.5 8.0 – 11.9 8.3 – 13.7
Percentiles 35 – 50 35 – 60 25 – 40 35 – 40 20 – 35
Cognitive flexibility and planning 5.4** .17 1.9 .06
Card-sorting errors 24.1 (7.5) 15.7 (7.6) 15.4 (10.6) 10.0 (6.6) 9.5 (6.1) 15.8 (9.5) 9.7** .28 3.9* .04 1,2,3,4,5; 2,4,5; 3,4,5 95%CIa 20.1 – 26.8 12.7 – 19.2 12.6 – 19.1 6.7 – 13.6 4.3 – 13.9
Percentiles 25 – 75 50 – 60 45 – 55 70 – 75 60 – 70
Card-sorting categories 1.5 (0.9) 2.2 (0.9) 2.0 (1.0) 2.6 (0.5) 2.6 (1.0) 2.1 (0.9) 4.9** .17 0.09 .01 1,2,4,5; 3,4,5
95%CIa 1.2 – 1.9 1.8 – 2.5 1.6 – 2.5 2.2 – 3.0 2.1 – 3.2
Percentiles 60 – 75 70 – 75 50 – 60 60 – 65 60 – 65
Pyramid of Me´xico correct 7.9 (3.5) 9.5 (2.2) 10.1 (2.2) 10.6 (0.5) 10.7 (0.5) 9.6 (2.5) 5.1** .17 0.04 .00 1,2,3,4,5
95%CIa 6.9 – 8.8 8.6 – 10.5 9.1 – 11.0 9.7 – 11.7 9.3 – 12.1
Percentiles 45 – 60 45 – 60 40 – 50 55 – 55 45 – 55
Notes:ENI¼Evaluacio´n Neuropsicolo´gica Infantil; MANCOVA¼multivariate analysis of covariance; ANCOVA¼analysis of covariance. MANCOVA and ANCOVA Fs and the partial eta square (ph)2forage are presented using gender as covariate.Post hocanalyses (Tukey’s test) compared the group means. The percentiles indicate the standard scores of mean values according to the ENI norms for each age group.
a
Confidence interval lower and upper bound. *p,.01.
**p,.001.
M.
Ro
sselli
et
al.
/
Ar
chiv
es
of
Clinical
Neur
opsych
ology
25
(2010)
218–235
231
words, digits backwards, graphic semantic fluency, card-sorting categories, and pyramid of Mexico. Finally, a size effect below .1 was found for digits forward.
Tables2–9also show the groups that differed significantly on thepost hocanalyses in each subtest. In general, these tests were sensitive to the change from years 5 – 6 to 7 – 8, 7 – 8 to 9 – 10, and 9 – 10 to 11 – 12. It is clear that score changes in the younger groups (5 – 10 years) were more evident than those among older children (11 – 14 years). In fact, only four subtests (discourse comprehension, right – left comprehension, similarities, and semantic fluency) were sensitive to developmental changes in the two older groups. This suggests some degree of a ceiling effect in those groups with respect to some of the other subtests. Ceiling effects also occurred for children older than 9 in the repetition of syllables, repetition of words, rep-etition of non-words, and images pointing, in which maximum scores were obtained between ages 5 and 8 with no further developmental changes. In addition, scores on the digits forward and digits backward tasks were significantly different between the 5 – 6 and 7 – 8 age groups, though no additional changes were seen above age 8.
In order to compare the scores of the bilingual sample in this study with those obtained by the Spanish monolingual nor-mative sample, the mean for each age group was converted into percentiles using the ENI manual. Since this manual contains age norms by individual year, but the age groups included in the present study included children of two ages (e.g., 5 and 6), two different percentile values were obtained for each mean. These percentiles are presented in Tables2–9.
Gender was a significant covariate in nine subtests: Stick construction, story recall, superimposed figures, blurry images, narrative coherence, utterance length, picture cancellation, graphic semantic fluency, and card-sorting errors. Post hoc
two-way ANOVAs using gender and age as independent variables were performed for these nine subtests. Gender proved not to be significant for stick construction,F(1,107)¼2.78,p¼.10, ph2¼.02; picture cancellation,F(1,107)¼2.39,p¼ 1.25, ph2¼.024; and card-sorting errors,F(1,107)¼2.42, p¼.12, ph2¼.025. However, the significant gender effect on story recall, F(1,107)¼4.34, p¼.040, ph2¼.04; superimposed figures, F(1,107)¼5.62, p¼.020, ph2¼.06; blurry images, F(1,107)¼5.50, p¼.021, ph2¼.08; narrative coherence, F(1,107)¼5.19, p¼.025, ph2¼.057, utterance length,F(1,107)¼7.31,p¼.008, ph2¼.080; and graphic semantic fluency,F(1,107)¼4.86,p¼.030, ph2¼.050, indicate that girls outperformed boys. A significant agegender interaction for story recall,F(4,104)¼2.58,p¼.042, ph2¼.095, showed that girls outperformed boys in the older age groups but not in the younger ones. No interactions were observed for superimposed figures, F(4,104)¼0.59, p¼.669, ph2¼.024; blurry images, F(4,104)¼1.97, p¼.10, ph2¼.075; Coherent narrative,F(4,104)¼1.65,p¼.16, ph2¼.071; utterance length,F(4,104)¼1.12,p¼.35, ph2¼.05; or graphic semantic fluency,F(4,104)¼2.29,p¼.065, ph2¼.090.
Discussion
This study analyzed the performance of a group of bilingual Spanish/English children on a series of cognitive tests and examined the effect of age after controlling for gender. Preliminary normative data are presented. Results showed a main age effect for all cognitive tests with performance showing improvement as age increased. However, effect sizes showed that the degree to which age influenced test scores varied from one subtest to another. For example, whereas age accounted for more than 50% of the score variance (seeph2values in Tables2–9) in copying a complex figure, visual learning, the two recognition and memory subtests, superimposed figures, similarities, and arithmetical word problems, it explained less than 20% of the variance in other subtests such as facial expressions, musical notes discrimination, repetition of syllables, words and non-words, digits forward and backwards, graphic semantic fluency, card-sorting categories, and pyramid of Mexico. In all of the other subtests, age explained between 20% and 42% of score variance.
These developmental changes in the ENI subtests confirm that there is a quite consistent increase in scores across most measures from the younger to older age groups that are of small to medium significance and may well be useful as normative data in clinical settings (Rosselli et al., 2004). In most cases, group differences were found between children aged 5 – 6, 7—8, and 9 – 10, but these changes were not always seen in the older adjacent age groups. This suggests that most of the ENI subtests are more sensitive to age changes among 5 – 10-year-olds, and less sensitive to those that occur after age 10. Exceptions to this assertion were seen in stick construction, discourse comprehension, right – left comprehension, similarities, and verbal fluency, where mean group differences were seen across all age groups, including children aged 11 – 12 and 13 – 14.
Many of the mean test scores of the bilingual children in this study were comparable to those obtained by Latin American Spanish monolingual children in the normative sample of the ENI (seeMatute et al., 2007), usually falling within the 30 – 60th percentile range. The bilingual group excelled on most of the constructional abilities subtests, where they scored above the normative sample by reaching the 70th percentile in most age groups. Also, the bilingual group scored between the 15th/ 20th and 50th percentiles in most coding and recall verbal memory subtests, sentence repetition, utterance length, and verbal and nonverbal fluency tasks.
232 M. Rosselli et al. / Archives of Clinical Neuropsychology 25 (2010) 218–235
at Florida International University on April 30, 2010
http://acn.oxfordjournals.org
The high performance attained by the bilingual group on constructional tests is consistent with a recent study byGarratt and Kelly (2008) who reported that bilingual children outperformed their monolingual counterparts in a copying design task. Those authors suggested that this difference could be due to a greater reliance on visual information among bilingual children.
The low performance of the bilingual group in language subtests is consistent with previous findings (Garratt & Kelly, 2008) that have shown lower results in the language domain among bilinguals when compared with monolinguals. Our results are also understandable, considering not only that the participants in the current study were active bilinguals—hence, language inter-ference may have played a significant role (Ardila & Ramos, 2007)—but also that the “language of schooling” was English. It is also possible that the decrease in verbal proficiency found in the current study was associated with the lower frequency of Spanish use in the school setting as, in fact, more than half of the sample reported not using Spanish in school at all. There is evidence of a connection between frequency of use and lexical accessibility (for a review, see Rivera Mindt et al., 2008). Moreover, Spanish is used mostly in the family setting, thus Spanish vocabulary and grammar can be characterized as simple with a narrow variety of topics.
The children in this study were tested only in Spanish. Though they were allowed to use either English or Spanish during testing, and answers in English were accepted, the examiners spoke exclusively in Spanish during all procedures and all instructions were given in that language. The results of this study do not allow us to ascertain whether applying the English translation of the ENI would produce better results among bilingual children. Also, it is impossible to estimate just how greatly the results would have differed if the children had been assessed in both languages. Indeed, only by using both languages, can an accurate estimation of the bilinguals’ language abilities be reached (Paradis, 2004). Future research should address these two issues.
It is worth noting that scores obtained on both fluency tests—verbal and graphic—were below the 50th percentile in most age groups. Although it has been suggested that a diminished verbal fluency is a frequent effect of bilingualism, particularly when both primary and secondary languages are used actively (Rosselli et al., 2000,2002), this does not explain the present findings, which also indicate lower scores on nonverbal fluency tests (suggesting a more generalized decrease in fluency in bilingual individuals). Future research comparing the performance of bilingual children with that of monolinguals should be conducted to test this statement.
Gender had a significant influence on the effects of age on three nonverbal ENI subtests (superimposed figures, blurry images, and semantic graphic fluency), and three verbal measures (story recall, narrative coherence, and utterance length), with girls outperforming boys. These results are consistent with previous findings in the literature that have found women out-performing men on recall verbal memory tests (Anderson & Lajoie, 1996) and language tasks (e.g.,Caplan, Crawford, Hyde, & Richardson, 1997). Our results also agree with those of studies that have failed to encounter gender differences in verbal learn-ing and fluency tasks (Ruffieux et al., 2009). However, the gender effects reported elsewhere—girls outperforming boys in verbal fluency tasks and verbal learning (Geffen, Moar, O’Hanlon, Clark, & Geffen, 1990) and boys outperforming girls in visuospatial and arithmetic problems (Rosselli, Ardila, Matute, & Inozemtseva, 2009; Rosselli et al., 2004)—were not found in the current study. However, this lack of significance may be attributable to the small sample size. Moreover, the size effects for the influence of gender in the present study were very small, ranging from .04 to .08. Therefore, they probably have no substantial clinical significance. For this reason, it was decided not to split boys and girls in each age group for the normative data.
In summary, the results from this study show that the bilingual sample performed similarly to the ENI normative group in many subtests. Nevertheless, the outcomes also support the importance of considering bilingualism when using normative data for children living in the USA (Byrd, Arentoft, Scheiner, Westerveld, & Baron, 2008;Rivera Mindt et al., 2008). When the scores of the Spanish/English bilingual children were compared with the normative data from Spanish-speaking monolinguals, differences emerged in terms of their performance on verbal tests, with most scores falling below the 50th percentile. Moreover, performance differences were also apparent on some of the nonverbal tests. For example, bilinguals’ scored above the 60th percentile in constructional tests. Previous researchers have suggested that teaching in the second language may affect all learning, and not just that of verbal skills (Fleisch, 2007), a notion that seems to be in concert with our findings, but needs to be tested further through comparisons of bilinguals and monolinguals.
The current study has certain limitations that should be mentioned. First, the sample size was relatively small and stronger statistical power would have been achieved if it had been larger. However, despite its small size, the sample used in this study was language specific and participants were carefully screened and stratified by age. AsStrauss, Sherman, and Spreen (2006)
have suggested, sets of well-stratified normative data from specific populations may be preferable to those obtained from large but poorly stratified samples. Moreover, not infrequently well-stratified norming studies cited in neuropsychological assess-ment compendiums (Mitrushina, Boone, & D’Elia, 1999; Strauss et al., 2006) are in respect of relatively small sample numbers. A second potential shortcoming is that gender was not equally distributed across age groups, thus limiting the possi-bility of generalizing the results. Though we controlled for gender in all analyses, future research that uses larger samples that
M. Rosselli et al. / Archives of Clinical Neuropsychology 25 (2010) 218–235 233
at Florida International University on April 30, 2010
http://acn.oxfordjournals.org
are more balanced in terms of gender distribution would produce more definitive results. In addition, the geographical location of the participants was limited to Miami and Denver and hence does not necessarily represent the Spanish/English bilingual population of the USA as a whole. The degree of bilingualism varies widely in the Hispanic/Latino population in the USA; therefore, the relatively heterogamous sample in terms of the degree of bilingualism may be useful, as it reflects a significant characteristic of the Hispanic/Latino community in the USA. Despite the limitations of this work, current research provides a set of normative data that can be used by clinical neuropsychologists when testing Spanish/English bilingual children in the USA, especially those bilinguals who share the language characteristics of our sample.
Funding
This research was supported by a grant from the National Academy of Neuropsychology Grant Program.
Conflict of Interest
None declared.
Acknowledgements
Our gratitude to Luz Arcila, Omar Barrios, Andrea Godinas, Ingrid Jones, Patricia Molina, Maria Celeste Ramirez, Elizabeth Rodriguez, Martiza Torres-Maguire, and Crosby (Jennifer) Troha for their help with data collection.
References
Anderson, V., & Lajoie, G. (1996). Development of memory and learning skills in school-aged children: A neuropsychological perspective.Applied
Neuropsychology,3, 128 – 139.
Ardila, A. (2002). Spanish-English bilingualism in the United States of America. In F. Fabbro (Ed.),Advances in the neurolinguistics of bilingualism. Essays in
honor of Michel Paradis. (pp. 47 – 69). Udine, Italy: Forum.
Ardila, A. (2005). Spanglish: An anglicized Spanish dialect.Hispanic Journal of Behavioral Sciences,27, 60 – 81.
Ardila, A. (2007). Bilingualism in the contemporary world. In A. Ardila, & E. Ramos (Eds.),Speech and language disorders in bilinguals(pp. 1 – 20).
New York: Nova Science Publishers.
Ardila, A., & Ramos, E. (2007). Bilingualism and cognition: The good, the bad and the ugly of bilingualism. In A. Ardila, & E. Ramos (Eds.),Speech and
language disorders in bilinguals(pp. 213 – 234). New York: Nova Science Publishers.
Bolan˜os, M. L., Ramı´rez, M. L., & Matute, E. (2007). Caracterı´sticas neuropsicolo´gicas de nin˜os escolares nacidos de madres con diabetes gestacional
[Neuropsychological characteristics in children born to gestational diabetic mothers].Revista Neuropsicologı´a, Neuropsiquiatrı´a y Neurociencias, 7
(1 – 2), 107 – 123.
Brownell, R. (2001).Expressive One-Word Picture Vocabulary Test. Spanish-Bilingual Edition.Novato, CA: Academic Therapy Publication.
Byrd, D., Arentoft, A., Scheiner, D., Westerveld, M., & Baron, I. S. (2008). State of multicultural neuropsychological assessment in children: Current research
issues.Neuropsychology Review,18, 214 – 222.
Caplan, P. J., Crawford, M., Hyde, J. S., & Richardson, J. T. E. (1997).Gender differences in human cognition.New York: Oxford University Press.
Centeno, G. J., & Obler, L. K. (2001). Principles of Bilingualism. In M. O. Ponton, & J. L. Carrion (Eds.),Neuropsychology and the Hispanic patient
(pp. 75 – 86). Mahwah, NJ: Lawrence Erlbaum Associates.
Cumming, G., & Finch, S. (2001). A primer on the understanding, use and calculation of confidence intervals that are based on central and noncentral
distri-butions.Educational and Psychological Measurement,61, 530 – 572.
Cummins, J., Mun˜oz-Sandoval, A. F., Alvarado, C. G., & Ruef, M. L. (1998).The Bilingual Verbal Ability Tests.Itasca, IL: Riverside.
DiSibio, M., & Whalen, T. (2000). Using the WPPSI-R with bilingual children: Implications for practice.California School Psychologist,5, 5 – 17.
Fleisch, B. (2007).Language and learning. Primary education in crisis. Why South African schoolchildren underachieve in reading and mathematics
(pp. 98 – 119). South Africa: Juta.
Garratt, L. C., & Kelly, T. P. (2008). To what extent does bilingualism affect children’s performance on the NEPSY?Child Neuropsychology,14 (1), 71 – 81.
Gasquoine, P. G., Croyle, K. L., Cavazos-Gonzalez, C., & Sandoval, O. (2007). Language of administration and neuropsychological test performance in
neu-rologically intact Hispanic American bilingual adults.Archives of Clinical Neuropsychology,22, 991 – 1001.
Geffen, G., Moar, K. J., O’Hanlon, A. P., Clark, C. R., & Geffen, L. N. (1990). Performance measures of 16-86-year-old males and females on the auditory
verbal learning test.The Clinical Neuropsychologist,4, 45 – 63.
Inozemtseva, O., Matute, E., & Jua´rez, J. (2008). Learning disabilities spectrum and sexual dimorphic abilities in girls with congenital adrenal hyperplasia. Journal of Child Neurology,23 (8), 862 – 869.
Kester, E. S., & Pen˜a, E. D. (2002). Language ability assessment of Spanish/English bilinguals: Future directions.Practical Assessment, Research, and
Evaluation,8 (4). Retrieved February 24, 2010, from http://PAREonline.net/getvn.asp?v=8&n=4.
Lamberty, G. J. (2002). Traditions and trends in neuropsychological assessment. In R. Ferraro (Ed.),Minority and cross-cultural aspects of neuropsychological
assessment.Lisse: Swets Zeitlinger.
Lamberty, G. J., Courtney, J., & Heilbronner, R. L. (Eds.). (2003).The practice of clinical neuropsychology. Lisse: Swets Zeitlinger.
234 M. Rosselli et al. / Archives of Clinical Neuropsychology 25 (2010) 218–235
at Florida International University on April 30, 2010
http://acn.oxfordjournals.org