THE MANY FACES OF POVERTY
QUANTIFYING THE DEPRIVATION COSTS OF THE 2001-2002 CRISIS IN ARGENTINA
ADRIANA CONCONI AND ANDRÉS HAM
ABSTRACT
This paper presents empirical evidence on the deprivation costs of the 2001-2002 Argentinean crisis. The selected approach is multidimensional and focuses on four aspects of quality of life: labor, assets, education and income. These dimensions are constructed by multivariate data reduction techniques and then aggregated using the Bourguignon and Chakravarty’s axiomatic multidimensional poverty measure. The main findings indicate that the crisis had larger costs on well-being dimensions which are tied to the economic cycle, such as income and labor. Costs were mild on structural aspects of well-being, such as assets and education. A sensitivity analysis shows that these results are robust to different deprivation lines.
JEL Classification: D30, I32, O54
THE MANY FACES OF POVERTY
QUANTIFYING THE DEPRIVATION COSTS OF THE 2001-2002
CRISIS IN ARGENTINA1
ADRIANA CONCONI AND ANDRÉS HAM2
I. Introduction
Without a doubt, the most common connotation of deprivation is income poverty; where individuals are classified as poor if their income lies below a threshold which represents a minimum standard of living. However, even while income poverty is considered to be a fundamental part of measuring deprivation, it still omits important aspects of livelihood in other respects
(Gasparini et al., 2010). Hence, studies using income as a welfare proxy may
fall short when the desired objective is to analyze an extended notion of
well-being3, which would be the ideal framework for a comprehensive study of
deprivation.
This discussion becomes highly relevant in a region such as Latin America, where the evidence points to a worsening of distributional outcomes reflected
by higher levels of income poverty and inequality (Gasparini et al., 2009). In
this context, Argentina presents a salient case. Income inequality in Argentina
1
This paper has benefitted from fruitful discussions with Leonardo Gasparini, Guillermo Cruces and Marcelo Bérgolo. We would also like to thank two anonymous referees for their valuable comments. Previous versions of this paper were enriched by seminar and conference participants at UNLP, the AAEP Annual Meetings, the Network on Inequality and Poverty (NIP) Meeting and the Human Development and Capability Association (HDCA) Conference, for which we are most grateful. All remaining mistakes in this paper are entirely our own.
2
Center for Distributive, Labor and Social Studies (CEDLAS), National University of La Plata; and National Scientific and Technical Research Council (CONICET), Argentina. Address:
Centro de Estudios Distributivos, Laborales y Sociales, Facultad de Ciencias Económicas, Universidad Nacional de La Plata. Calle 6 entre 47 y 48, 5to. piso, oficina 516, La Plata (1900), Argentina. Telephone: +54-221-4229383. Web site: www.cedlas.org. Email: cedlas@depeco.econo.unlp.edu.ar. E-mails: aconconi@cedlas.org and aham@cedlas.org.
3
increased steadily during the 1990s and income poverty peaked after the deep crisis experienced during 2001-2002, leaving more than 50 percent of the population below the income poverty line (Gasparini and Cruces, 2008; Galiani, 2009).
However, it remains unclear whether the crisis affected only income deprivation or extended beyond this dimension. Existing evidence has shown that the crisis caused many individuals the loss of their jobs and their homes. Therefore, estimating an extended deprivation cost of the crisis arises as an interesting exercise for Argentina. The results from this analysis would provide new evidence on the response of well-being to aggregate crises, considering notions beyond income. Additionally, these results are relevant from a policy perspective, since they may help identify vulnerable population in each dimension. In light of the recent world financial crisis, it seems fit that an assessment should be carried out for key areas where intervention may be necessary to mitigate the costs from such shocks, especially on the chronic poor.
Since normative aspects of deprivation are widely agreed upon, it is measurement which encompasses the heart of this study. In particular, we seek to employ a multidimensional deprivation index in order to quantify the effect of the crisis on well-being dimensions beyond income. Therefore, we discuss a series of issues which are highly relevant in the theoretical literature on multidimensional deprivation measurement: First, there is no clear consensus on which dimensions are relevant for measuring deprivation. Second, it is uncertain whether each aspect of deprivation should be summarized into a single indicator or instead captured by several variables. Third, aggregation issues are also relevant since there is no conclusive evidence on which is the best indicator for measuring deprivation in multiple dimensions. Finally, the selection of thresholds for each dimension is not straightforward. These topics are currently active in the research agenda, to which this study seeks to contribute4.
To address these issues empirically, we suggest observing dimensions of structural and cyclical nature; and constructing dimensions using multivariate data reduction techniques which take into account several indicators. A derivation of the social valuation function consistent with our definition of
4
well-being indicates that aggregation using Bourguignon and Chakravarty’s (2003) multidimensional poverty measure fulfills a number of desired axioms, and is best for the approach employed here. Finally, thresholds are defined in a relative manner, since deprivation may be considered a relative state. To control potential biases from this (somewhat arbitrary) decision, the results are subject to a series of robustness tests which consider a number of different thresholds.
The results derived from this exercise provide several important contributions. Firstly, the study presents empirical evidence of the immediate effects of the Argentinean financial crisis with respect to key dimensions of well-being, thus covering an existing gap in the literature. Secondly, it operationalizes a simple identification and aggregation methodology for multidimensional poverty which –even though fairly limited– provides insight into the consequences of aggregate shocks on deprivation. Finally, it raises concerns on the debate between absolute and relative definitions of poverty, which is a current topic of interest in the deprivation literature (Tsui, 2002).
The rest of this study is organized as follows. The next section reviews the existing literature on the effects of the crisis in Argentina, focusing on several dimensions of well-being. Section 3 surveys the conceptual framework and defines the empirical strategy used to obtain the estimates in Section 4. Finally, the last section presents some concluding remarks based on our findings.
II. Literature Review
Argentina has been usually regarded as a country with low poverty rates in comparison to its neighbors. In fact, Gasparini, Gutierrez and Tornarolli (2007) show that until the late 1990s, Argentina had the second lowest proportion of income poor in all Latin America, only behind Uruguay. However, unequal growth, skill-biased technological change, trade and the impact of several crises drove these rates up and changed the nation’s rank
(currently 4th, behind Uruguay, Chile and Costa Rica)5.
The last important crisis took place less than ten years ago and remains one
of the worst economic meltdowns in the history of the country.6 As such, it has
5
Gasparini and Cruces (2008) provide a detailed study of the forces behind distributional changes in Argentina.
6
generated a large and still ongoing literature studying its causes and effects. The brief review presented here focuses on those studies which observe the impact of the crisis on income poverty and other important aspects of livelihood (e.g. employment and human and social capital). The section concludes by surveying studies which measure multidimensional deprivation in Argentina and encompass the crisis period.
A. The effect of the crisis on income poverty
The income poverty effect of the crisis has not been studied directly as a causal effect, but rather indirectly by observing the behavior of the poverty rate before and after it. Since greater poverty is generally tied to recession or unfavorable aggregate conditions, studies generally use the poverty headcount measure and its evolution to assess the income poverty cost of economic crises. However, other studies have also provided interesting evidence on issues such as income fluctuations and have even tried to estimate the poverty elasticity to growth.
For instance, Busso et al. (2004) and Gasparini and Cruces (2008) provide
thorough assessments of the changes in the income distribution, primarily with respect to inequality and poverty from household surveys. Figure 1 plots the poverty headcount for the Greater Buenos Aires region (GBA) and the
nationwide total for Argentina, which are taken from the latter study.7 This
depiction helps identify a number of peaks which coincide with aggregate crises of differing size (e.g. 1985, 1989, 1995, and 2001-2002). However, it is evident that the 2001-2002 crisis is the largest in terms of poverty growth. In fact, calculations show an increase in income poverty of 17 percentage points for the most recent crisis, placing more than half the population as income
deprived when comparing to the moderate poverty line8.
Fizbein et al. (2003) complement the results evident from national survey
data by analyzing a special survey designed by the World Bank to capture the
(2007). For the 2001-2002 crisis, see Cooney (2003), and Perry and Servén (2003).
7
See Gasparini and Cruces (2008) for a definition of the Greater Buenos Aires region and the procedure used for the national estimates.
8
effects of the crisis on several outcomes, including income. The findings from this unique data source indicate that approximately half of all households suffered a significant drop in nominal income, dragging a large quantity of households into poverty. Cruces (2005), uses panel data and also finds an important reduction in income and identifies greater variation in incomes after the crisis, implying higher volatility and increased vulnerability of
households.9 Cruces and Glüzmann (2009) find, not surprisingly, that income
deprivation is negatively related to economic growth when estimating the elasticity of poverty to GDP by using the 2001-2002 financial meltdown as a “worst-case” scenario.
In general, studies measuring the level of poverty conclude that income deprivation was severely affected by the financial crisis of 2001-2002. In comparison with previous crisis episodes, the income poverty cost of this aggregate shock was substantially higher, and the effects more profound. Even while the growth period directly after the crisis helped raise many out of poverty, its current levels are higher than during the early 1990s when Argentina was one of the least poor countries in the region.
B. Effects on other aspects of livelihood
Certainly, the deprivation cost of financial crises is not restricted to income poverty. Several other key dimensions of well-being may also find themselves affected by downturns in the economic cycle or other negative shocks, to which attention now shifts.
It would be common sense to assume that much of the decrease in income caused by the crisis is actually a reduction in earnings, which brings labor issues to the forefront of the debate. McKenzie (2004) tests this hypothesis by exploiting individual level panel data and observing the effect of the crisis on labor market outcomes. At aggregate level, increased labor supply and the low demand for labor quickly translated into high unemployment. Workers struggling to obtain a job turned towards the informal sector, settling for lower wages and precarious employment conditions. This informality effect was also exacerbated by one of the nation’s most important poverty alleviation
programs, the Plan Jefes y Jefas de Hogar (built to encourage employment and
9
serve as a cash assistance program10) as reported by Gasparini, Haimovich and Olivieri (2009). Thus, the crisis had an important effect on employment, mainly by generating high unemployment and encouraging informal reinsertion when jobs became available, implying a deterioration of the formal labor market.
Cruces and Glüzmann (2009) suggest that it is also important to focus on human capital and social indicators. The authors estimate elasticities of GDP growth on education and health outcomes using several methodologies and identification strategies. Among their results, they find that school enrollment seems to be pro-cyclical, evidenced by lowered incentives to remain in school during recessions, particularly for adolescents of working age. For primary school attendance, the authors find a negative effect, although it is quite small. This is not surprising since primary coverage is near to universal in Argentina.
Observing how social indicators respond to the economic cycle provides an idea as to how they might be affected in such a context as the 2001-2002 crisis in Argentina. As shown here, some previous work has analyzed a number of relevant dimensions of well-being, mainly labor outcomes and social
indicators.11 Yet, they do not assess deprivation in each of these dimensions.
This study seeks to cover this gap and, even while it may not contemplate all the dimensions of well-being, it will provide a more thorough assessment of the actual effects of the crisis on deprivation (henceforth interchangeably denoted as ill-being) than previous studies.
C. The assessment of the multiple dimensions of poverty
The trend in recent literature on poverty has focused on extending the one dimensional notion of poverty and considering other aspects in which an individual or household may be deprived. Nevertheless, there is still limited
empirical evidence for Latin America as a region and Argentina specifically.12
At the regional level, Battistón et al. (2009) implement several existing
measures of multidimensional deprivation using 6 dimensions for the same
10
See Cruces and Gasparini (2008) for a detailed description of this poverty alleviation program.
11
No studies assessing effects on household assets were found in the literature, a striking gap.
12
number of countries. Since their analysis seeks maximum comparability between all case studies, there are timeframe gaps in their data and a clear trade-off between specificity and comparability. For instance, their data for Argentina contemplates changes from 2000 to 2003, and overlooks the immediate consequences of the crisis. Overall, they find a general increase in deprivation for this defined period, but much lower than the increase in income poverty described beforehand. However, this three-year gap may hide (or bias) any estimates with respect to the effects of the crisis on multidimensional deprivation.
Among the studies specific to Argentina is López-Pablos (2009), who implements an anthropometric deprivation measure. The main drawback of this study is that it does not aggregate the results with other dimensions, focusing on that single aspect of well-being. Mussard and Pi Alperin (2008) also implement a multidimensional approach to poverty for Argentina, but with a different purpose. The authors observe inequalities in poverty by decomposition methods instead of trends and behavior. Conconi (2009) provides a more complete picture of the recent evolution of multidimensional poverty in Argentina. However, this paper is not focused on the actual effects of the 2001-2002 crisis but rather on a more general description of empirical evidence on this topic for Argentina.
Therefore, it is this lack of available evidence which motivates a more detailed study of ill-being for Argentina and the deprivation costs of the untimely 2001-2002 crisis.
III. Conceptual and measurement framework
Multidimensional deprivation is not precisely a novel concept. Its measurement, however, is an expanding field of study which presents new
contributions on a regular basis.13 Defining well-being in our context becomes
the first necessary step in order to properly measure deprivation. This section begins with this task and then concentrates on technical details for the measurement of deprivation in multiple dimensions, which is the basis for the results in Section 4.
13
A. Theoretical underpinning
Normative contributions to the study of well-being include direct economic approaches, such as Sen (1981, 2000a and 2000b) as well as other strains which favor a Rawlsian perspective, the latter which views deprivation as a direct consequence of social exclusion and injustice (De Haan, 1999 and Le Grand, 2003). Nonetheless, this dichotomy does not prevent these studies from arriving at the same conclusion, that one dimension is not enough to measure deprivation.
This study favors Sen’s capability approach, due to its intuitive appeal and
the indirect capacity of measuring social exclusion processes.14 Sen (1992)
argues that the relevant space of well-being is the set of functionings that the
individual is able to achieve, which directly reflect an individual’s freedom to lead one life or another. Sen proposes a long list of relevant functionings in order to live “a good life”, among which he considers: satisfying basic needs, a good quality of life, proper housing conditions, obtaining an adequate level of income, good employment and working conditions, good health, fulfillment in social relationships, access to quality education, a safe environment and active participation in political life; to name several.
The logic of a multidimensional approach of well-being is difficult to deny. Therefore, in what follows, this conceptual framework is adopted and empirically implemented using the strategy presented in the following sub-section.
B. Empirical strategy
The agreeability of the philosophical concept of well-being is less evident in empirical applications. It is standard that these studies instill a sense of
confusion due to their diversity of definitions, methods and inference.15 As
stated before, all dimensions are not directly measurable, making the choice of functionings somewhat limited. This study uses a practical approach, which favors feasibility and policy relevance. The rest of the section describes the
14
The capability approach indirectly captures remnants of exclusion processes which may affect deprivation through instrumental or constitutive channels, as Sen (2000a) describes.
15
choices undertaken to arrive at the empirical estimates. To organize the discussion, we first focus on constructing dimensions and then consider aggregation issues.
1. Constructing dimensions using data reduction methods
It is common practice to characterize an aspect of livelihood by using a single indicator, as is the case of income. However, sometimes a dimension can be more appropriately captured by more than one variable. Surely, this heightens the arbitrariness of using a single proxy as a measure for welfare. In short, this last course of action is highly restrictive, since it assumes that this indicator captures the entire variability of the relevant functioning or in an extreme, of all well-being. In this sense, multivariate methods may help relax these stringent assumptions and propose an alternate approach to calculating indicators of well-being in each aspect of life.
Factor analysis methods (FA) are used to build indices of well-being in
those dimensions which cannot be measured by a single indicator.16 In a
nutshell, these data reduction methods take variables which are correlated
amongst themselves and “summarize” them into a single measure.17 It solves
the arbitrariness of selecting one proxy by taking multiple variables which reflect well-being in any particular dimension and extracting their joint variability. To illustrate this point, consider the simple case of reducing two variables into one index of education: literacy and years of schooling. FA methods fit a linear regression which grants the highest score to individuals with elevated levels on the included variables (e.g. an individual who is literate and has the maximum years of schooling). Extending to the general case with
n variables, these define a space which is described by linear combinations of
those variables. The first extracted factor is the linear combination which explains the most variance within that space.
16
We use factor analysis instead of principal component analysis because the latter forces all of the components to accurately and completely explain the correlation structure within the dimension; restrictive assumptions not found in the factor analysis case. See Sahn and Stifel (2000) for more information on this matter.
17 Actually, more than one component may be found in the data reduction. The first extracted
There are several advantages of using multivariate methods for the construction of well-being dimensions. First, the method does not assume the data follow a particular correlation structure or orthogonality between
variables. In a sense, it lets the data “speak for itself”, and avoids placing
restrictive and unrealistic expectations on the data. Second, this procedure allows estimating measures of internal validity, which is not possible with
other indices such as those used in Battistón et al. (2009). The most common
indicators of internal validity for FA indices are Bartlett’s sphericity test and the Kaiser-Meyer-Olkin (KMO) measure of sampling adequacy.
Nevertheless, there are also a series of caveats with the method. On the one hand, there are conceptual issues, since these methods were not particularly designed for the analysis of well-being. On the other hand, there are more technical issues, such as the potential for omitted variables bias in addition to measurement and approximation errors (Cudeck and MacCallum, 2007). Also, there is an ongoing debate with respect to the statistical properties of FA and their implications for deprivation measures (Krishnakumar and Nagar, 2007).
It is of noteworthy importance to highlight that the empirical application of FA methods to observable data is directly tied to the availability of information on variables for each functioning. In our case, the data for Argentina allow feasibly estimating three dimensions (besides income) using data reduction methods. Even if these do not comprehend the entirety of well-being dimensions listed by Sen, they do summarize important aspects of livelihood listed beforehand. Thus, the four dimensions available for this study are income, labor, assets and education. Since the income dimension is only composed by one continuous variable, it is the only dimension not subjected to FA methods.
The estimates in the next section first reduce the variables selected for each of the other three dimensions into a single index. Second, we test the validity of this index to capture said variability using reliability measures. Finally, we calculate individual scores for each dimension using the following process:
=
=
∑
1
k
ig ik kg
k
F
a q
(1)kth variable in the dimension and
q
kg is the standardized value of the kthvariable in dimension g. As previously mentioned, scores with higher results
indicate a better situation in the relevant functioning. For simplicity and ease
of interpretation, all scores are normalized in a closed [0,1] interval.18
2. Aggregating dimensions: calculating multidimensional deprivation
Once measures of individual well-being in each relevant dimension have been constructed, the next step implies selecting a measure to aggregate those dimensions and establish the level of total deprivation. The selection of this poverty index is far from arbitrary, since a reliable measure should fulfill certain axioms consistent with rational behavior. This trend is derived from one-dimensional poverty measures such as the FGT index which is particularly appealing due to its good behavior.
The search for these desirable properties carries over into the multidimensional assessment of deprivation. A number of contributions include axioms and try to provide a strong case for their robustness. In recent
years, Bourguignon and Chakravarty (2003), Duclos et al. (2006) and Alkire
and Foster (2009) have provided important methodological improvements for the measurement of multidimensional poverty.
In this paper, the selection of the measure is determined by the way in which we define social welfare and how to assess it. The assessment of deprivation is generally undertaken by comparing an individual vector of well-being to a minimum standard of living and classifying said individual into one of two states: deprived or not deprived. The first step is to procure measures of well-being for each individual and functioning:
′ =
{ ,...,
1}
i i ig
x
x
x
(2)where xig is the level of well-being in the g
th
livelihood. As stated
beforehand, estimates of xig are the factor scores obtained from FA.
Substituting (1) into (2) then provides an observable alternative to assess deprivation for multiple dimensions from observational data.
18
The normalization is done in the following manner: = − −
min( )
max( ) min( )
ig ig
ig ig
F F
I
Once the welfare proxy is defined, it becomes necessary to define the way social welfare is to be assessed. Poggi (2004) does exactly that, by applying a suggestion from the capability approach to set up the social valuation function. The simplest and most unrestricted way to define this function is as a linear
combination of well-being in each dimension.19 Under certain assumptions, it
is possible to show that the sum of each individual valuation function provides a consistent multidimensional social valuation function which is homogenous of degree one, homothetic, continuous and additive (Poggi, 2004). For specificity, refer to the Appendix B, which presents a technical derivation of this function.
In order to measure deprivation, we must define a measure which takes the
SVF and estimates ill-being consistently.20 Additionally, Poggi proves that if
this index fulfills multi-homotheticity and is unique to monotonic transformations then the poverty index which is best suited to assess ill-being is none other than the multidimensional FGT measure derived originally by Bourguignon and Chakravarty (2003):
α θ θ = =
⎡
⎛
⎞
⎤
⎢
⎥
=
⎜
⎜
−
⎟
⎟
⎢
⎝
⎠
⎥
⎣
⎦
∑ ∑
1 11
( )
n G g1
ig, 0
i g g
F
BC x
w Max
n
z
(3)Interpretation of (3) is direct. The shortcomings in each of the g dimensions
are aggregated into a single weighted measure which counts the amount of individuals deprived in all dimensions, i.e. it is an intersection measure
(Atkinson, 2003).
θ
is the elasticity of substitution between dimensions.2119
The definition of the SVF as linear is a characteristic which may be expanded in future work, since it is the simplest case and may not capture important non-linearities in well-being or other underlying behavior.
20
An index is considered consistent if for any matrices x and x’ and social valuation function V, we have that if V x( )≥V x( '), then P x( )≤P x( '); where P is the multidimensional deprivation measure.
21
BC(x) presents three possibilities based on the value of
α
; if α=
0
the indexpresents the multidimensional poverty headcount. α
=
1
and α=
2
correspond to the poverty gap and the squared poverty gap (or severity of poverty). For ease of interpretation, the estimates correspond to the deprivation headcount.
The BC deprivation measure fulfills a number of important axioms due to
its functional form,22 such as focus, monotonicity, symmetry, decomposability,
the principle of population, weak transfer principle and is non-decreasing under increases of correlation between dimensions. This last attribute is unique to the measure because of its multidimensional nature and implies that changes in correlation do not affect results from (3) as Bourguignon and Chakravarty (2003) explain.
3. Setting the deprivation line
One of the most important decisions of poverty analysis is the selection of the deprivation threshold. For one-dimensional income measures, standard practice has been to set a monetary amount which allows procuring a bundle of goods considered necessary for survival. This defines the threshold in an
absolute manner, since a single value is used to compare all individuals.23
However, the most important characteristic of commonly used thresholds is that they are exogenously defined. It seems like a strong assumption to make, since deprivation is defined differently for each individual.
Since well-being is relative, this study suggests that the deprivation thresholds should be set in the same manner. A series of applied research has used this approach, by using points on the distribution of the well-being proxy. Some studies use the mean as a comparison point, which has been criticized due to its sensitivity to extreme values. Other efforts suggest using the median as a comparison point. As any threshold, there is some degree of arbitrariness in this choice, to which perhaps more attention should be placed in future work. There are two ways to set these values which allow greater flexibility. The first is to focus on the possibility of the endogenous determination of the
Battistón et al. (2009).
22
These are elaborated in Bourguignon and Chakravarty (2003) and Poggi (2004).
23
deprivation thresholds and the second is to use methods such as the fuzzy set
approach to determine deprivation lines.24
Nevertheless, the selection of deprivation lines in this study favors a simplistic view. Since the main objective is to quantify the effect of the crisis on deprivation in multiple dimensions, it is trends which are important and not necessarily levels. Therefore, the deprivation line used for dimensions
constructed with FA is
=
1
2
g g
z
Med
. This deprivation line incorporates arelative approach directly, with exception of income (for which the US$ 2 PPP a day line is used). To ensure robustness in the ensuing estimates, we carry out a sensitivity analysis using different thresholds to ensure that our results hold.
IV. Empirical application
A. Data
The ensuing estimates are drawn from Argentina’s Encuesta Permanente
de Hogares (EPH), a periodic household survey carried out by the Instituto Nacional de Estadísticas y Censos (INDEC) in large urban centers populated by at least 100,000 inhabitants. The survey is representative of urban areas, although this does not pose a significant problem in extrapolating the results
nationwide since 85% of the national population resides in cities.25 The data
used in this paper correspond to the October rounds of the EPH for the 1998-2002 period. Since survey coverage increased throughout the timeframe, the
same regions are tracked to ensure maximum comparability.26
The analysis is restricted to this 5-year timeframe for several reasons: first, earlier observations required further reducing the sample (for comparability)
24
For endogenous determination of deprivation thresholds, see D’Ambrosio et al. (2002), Simler (2006) and De Mesnard (2007). For fuzzy set approaches, see Chiappero Martinetti (2005) and Smithson and Verkuilen (2006)
25
Nevertheless, a case has been made for the difference between urban and rural deprivation in Argentina, see Tornarolli (2007).
26
and in many cases did not contain information to properly construct the employed measures. Second, the selected period encompasses the recession (beginning in 1999) and the aftermath of the crisis (2002). As such, it is ideal to observe deteriorating conditions and isolate the impact of the downturn on deprivation. Third, starting in 2003 a significant period of recovery began in Argentina. Since the objective of this paper is to observe the immediate effects of the crisis, this period is not relevant. Finally, the EPH surveys underwent important methodological changes beginning in 2003; which hampers comparability to previous surveys in both sampling and structure. Hence, this short period contains the information to properly fulfill the objectives of this paper.
B. Relevant definitions and descriptive statistics
It is important to begin by defining each dimension. First, we assess deprivation in the labor dimension. The variables used to construct this functioning are related to labor benefits and formality. In particular, we consider the following variables:
- Access to employment health insurance: dummy variable that is equal
to one if the individual is provided with health insurance from their current occupation, and equal to zero otherwise.
- Right to a pension from employment: dummy variable that is equal to
one if the individual has a right to a pension when they retire from their current occupation, and equal to zero otherwise.
- Formality: dummy variable that is equal to one if the individual is a
formal worker in their current occupation, and equal to zero otherwise. In this case, we consider the productive definition of informality, which states that an individual is an informal worker if they are employed in a small firm (less than five people), as a non-qualified independent worker (they have not completed superior education; i.e., is not a professional), or is an unpaid family worker.
- Permanent occupation: dummy variable which is equal to one if the
individual has a permanent job, and equal to zero if employment is temporary.
- Well-constructed dwelling: dummy variable that is equal to one if the individual resides in a well-constructed dwelling, i.e. good-quality materials in the floor, walls and roof.
- Access to water: dummy variable that takes value equal to one if the
individual lives in a dwelling with access to running water.
- Access to hygienic restrooms: dummy variable that takes value equal
to one if the individual lives in a dwelling with a hygienic restroom.
- Access to sewer: dummy variable that takes value equal to one if the
individual lives in a dwelling with sewer drainage.
- Access to electricity: dummy variable that takes value equal to one if
the individual lives in a dwelling with access to electricity.
Educational deprivation is assessed for children as access to education (enrollment) and for adults using literacy and completion of education. In particular we construct the following variables:
- Dummy variables for each educational level27 for adults (aged 18
years or more). Dummies take value one if the individual has completed the corresponding level and zero otherwise.
- Literacy (for adults): dummy variable that takes value one if the
individual is literate (knows how to read and write).
- Enrollment (for children): dummy variable that takes value one if the
child is enrolled in school, and zero otherwise. For children with less than 12 years old we considered attendance to primary school, and secondary school in the case of those with 12-18 years.
Finally, income is measured with per capita household income, in Argentine pesos.
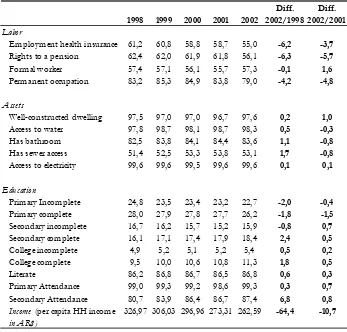
Table 1 presents trends for the variables included in each dimension. The results indicate that variables in the labor dimension were negatively affected throughout the period, with lower formality and lower coverage of important employment related benefits. The asset and education indicators remain relatively stable, although a mild improvement in both dimensions is evidenced from the evolution of the descriptive indicators. Finally, average per capita income declined throughout the entire period approximately 20 percent, of which 5 percentage points were due to the crisis. Thus, an initial descriptive
27
analysis from the raw data would imply that outcomes in both labor and income dimensions seem to deteriorate on par with the crisis, hinting at their cyclical nature. On the other hand, structural outcomes seem to vary less, even during the crisis.
Since most of the variables in the labor, asset and educational functionings are binary, the data reduction methods take this characteristic into account by using a tetrachoric correlation structure. Factor analysis methods are applied and the relevant indices normalized as described in section 3. Table A.1 in the Appendix A presents the KMO measures for each of the constructed dimensions. The labor and asset dimensions seem to be captured quite well, while the results for education less so. Nevertheless, the analysis of correspondence between dimensions in Table A.2 shows positive and significant associations throughout all years, indicating that these functionings seem to be linked quite strongly.
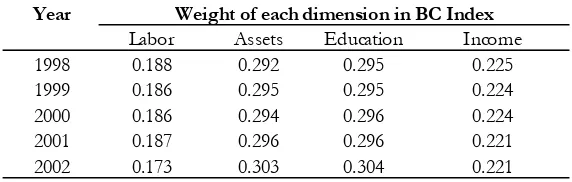
The estimated weights for each dimension are presented in Table 2. In
general, the weights behave as expected (Ataguba et al. 2010; Decanq and
Lugo, 2010), where structural dimensions seem to be quite important since they are tied directly to increased well-being. The smaller relative importance of cyclical dimensions may be explained by the following argument: structural dimensions are directly related to more pivotal needs (human capital and housing), and deprivations in these areas are generally considered more damaging than deficiencies in income and labor variables.
Using these weights, the BC index of multidimensional deprivation is now calculated for the period. Results for the aggregate level of deprivation and poverty in each dimension are presented, highlighting the situation before and after the 2001-2002 crisis, and whether most of the change is due to this aggregate shock. A sensitivity analysis of the estimates to different deprivation lines is then undertaken and the section wraps up with a characterization of deprived individuals.
C. Deprivation before and after the crisis
In 1998, 13.7% of the population was deprived in all dimensions, a proportion which grew just over one percentage point throughout the period, i.e. the individuals which suffer deprivation in all dimensions increased by one percentage point from 1998-2002. In terms of magnitude, this percentage effect seems to be minor. The difference seems less trivial when considering the number of individuals, since this increase would mean that over 270,000 people would have important shortcomings in all 4 dimensions due to the crisis.
Separating the results by dimensions, labor deprivation has the highest level, which is not surprising due to the increase of labor informality. Secondly, income poverty has the highest proportion of deprived individuals and shows a steady growth through the period (an increase of 27 percent), similar to the estimates presented in Figure 1. Finally, both asset and educational deprivation seem to be quite low, reflecting their structural or “stock” nature, i.e. that once an additional year of education or asset component is acquired it is almost impossible to lose it, contrary to employment or income which is more closely tied to the economic cycle.
These multidimensional estimates notably differ from the standard income poverty changes from the crisis for two reasons. First, the BC index shows
how many individuals are deprived in all four dimensions considered here;
which captures more chronic aspects of deprivation. Hence the change in the BC measure is less drastic due to this more rigorous definition. Second, the data indicate that variables which are cyclical in nature (income and labor) respond faster to the existing aggregate conditions than those which may be
considered to be structural (such as education and housing)28.
In fact, this may be seen by recalculating (and reweighting) the BC measure for two “extended” dimensions, cyclical and structural. First, we obtain the weighted sum of deprivation in each extended dimension and then divide by the sum of the weights for each component. The results show that cyclical deprivation increased from 20.5 to 23.5, an increase of more than ten percent during the period which was mostly due to the crisis. In change, structural deprivation shows a reduction from 1.5 to 1.3, although the change is quite small. Hence, the traditional income deprivation estimates show greater changes in the cyclical dimension evidencing that our estimates are less
28
sensitive because of the joint consideration of all four dimensions.
Are these changes in deprivation solely a result of the crisis? Comparing the change in multidimensional poverty since the beginning of the recession (1999) and to the initial crisis year shows that indeed the increase in ill-being is mainly driven by the macroeconomic crisis. The effect accounts for 90 percent of the change for overall deprivation and ranges between 50-90
percent for each dimension.29 Figure 2 shows the change in deprivation which
may be attributed to the crisis. The behavior in the figure shows that both the labor and income dimensions –once again– are those for which deprivation grew substantially; 5.9 and 1.8 percent, respectively. On the contrary, the crisis seems to have a small effect on the asset and education elements of well-being.
D. Sensivity to the deprivation line
The deprivation measures in Table 3 used the median line in each particular year to classify individuals into deprived states. As argued beforehand, relative assessment of well-being provides a better point of reference for poverty due to changes in society across time, since it compares well-being with respect to
the current status quo. However, it also introduces a potential source of bias
since estimates may be sensitive to the selection of this threshold. To test sensitivity and evaluate robustness, we recalculate the BC measures in Table 3 using median lines for 1998 and 2002, setting new reference periods. Figure 3
presents the difference between deprivation using current status quo and each
of the alternate reference periods.30
As would be expected, if deprivation is assessed using the conditions in 1998 as a reference, deprivation in all respects would worsen since the status quo was comparatively better in 1998 than in following years. The reverse results are obtained setting 2002 as the reference period. Nevertheless, for both cases deprivation would not be significantly affected whichever period is selected as the status quo. Ill-being would be overestimated (or underestimated) by less than 2 percent, which indicates that deviations from the median line do not pose significant biases to the BC measure and the
29 These results are obtained by weighing the change in deprivation due to the crisis with respect
to the overall change in the period.
30
dimensions selected here.
Decomposing the change in Figure 3 shows that the driving force behind these results is the sensitivity to deprivation lines in the income dimension. This suggests that income poverty has a large response to where the poverty line is set, as has been found elsewhere (Saunders and Hill, 2008). Therefore, it seems that of all evaluated dimensions income is the most sensitive to where the threshold is set. In the remaining dimensions, there is a small level of noise from this selection. These results would indicate that the poverty measure used here seems to be robust for capturing several aspects of deprivation. The above results make the estimates in Table 3 more credible, implying that the measure of ill-being yields unbiased results of the poverty increase of the severe 2001-2002 crisis in Argentina.
E. A multidimensional profile of the poor
A fundamental question in the analysis of well-being is: who is deprived? To answer this question, this sub-section presents a characterization of the poor on a number of socio-economic characteristics. The results allow observing important facts about the attributes of the deprived, highlighting important characteristics relevant for policies seeking to prevent future poverty and other forms of social safety nets.
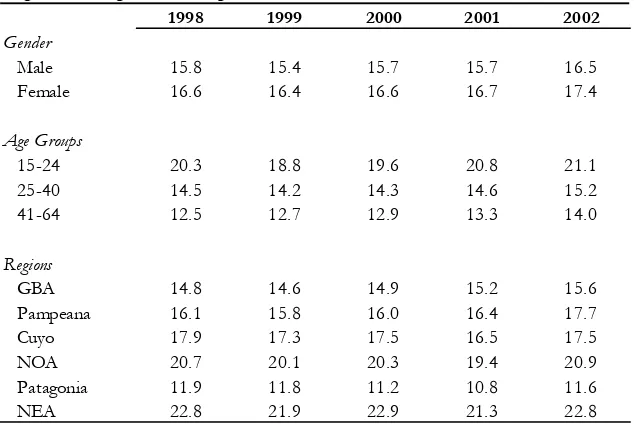
Table 4 presents this profile based on overall deprivation. The results show that those deprived in all dimensions tend to be females and younger. Observing the spatial distribution of the poor, the Northeast (NEA) and Northwest (NOA) seem to be the regions with the largest deprived population, while those in the South (Patagonia) are relatively better-off. This is consistent with other studies (Zaccaría and Zoloa, 2006), and the regional ranking with respect to multidimensional poverty shows a similar picture.
income-deprived shows the same behavior described, with the exception that the gender differences are reversed.
In general, these deprivation profiles show that in dimensions where the crisis has the most effect, there are important gender disparities and a significant level of vulnerability of younger individuals. As is the case with standard poverty profiles, the simple tools may serve as a guide to see which population groups are most affected by changes in ill-being in any dimension, and particularly considering deprivation as a whole.
V. Conclusions
This study quantified the deprivation costs of the financial crisis in Argentina during 2001-2002 among multiple dimensions. In order to achieve this goal, we operationalized a multidimensional deprivation index derived from the capability approach. We built our measure in two steps: first using multivariate data reduction techniques for each dimension and then aggregating the poor using Bourguignon and Chakravarty’s multidimensional poverty measure and comparing to relative deprivation thresholds.
The results show that multidimensional deprivation increased 1% due to the crisis. However, it is important to note that this small relative change in the estimates is due to the intersection nature of the BC index, since it defines as poor those deprived in all dimensions. In fact, this 1% increase translates into 270000 individuals being deprived in all livelihoods considered here; which is not a trivial amount. The estimates show that the increase in ill-being stems mostly from the effect of the crisis and accounts for between 50-90 percent of the total change in each dimension. In particular, functionings with greater dependence on the economic cycle –such as labor and income– suffer the immediate consequences of the crisis. On the other hand, dimensions which
are considered to be of a “stock” nature, such as housing and education seem
to be less affected.
A sensitivity test of the results indicates that the poverty measure used here seems to be robust, with changes in the deprivation thresholds not significantly affecting the estimates and trends –with the exception of income poverty. Deprivation profiles in the affected dimensions and of overall deprivation show evidence of important gender disparities and high vulnerability of younger individuals.
public policies. For employment, it is important to create social policies which
do not encourage informal or precarious employment (such as Plan Jefes). For
References
Alkire, S. and J. Foster, (2009). “Counting and Multidimensional Poverty
Measurement (Revised and Updated)”, OPHI Working Paper No. 32, Oxford.
Atkinson, A.B., (2003). “Multidimensional Deprivation: Contrasting social
welfare and counting approaches”, Journal of Economic Inequality, 1(1): pp.
51-65.
Ataguba, J.E., M.W. Fonta, H.E. Ichoku and C.I. Mba, (2010). “Multidimensional poverty under the capability framework: the case of missing dimensions data and poverty in Nigeria”, Paper prepared for
presentation at the 8th Poverty and Economic Policy (PEP) General Meeting,
June 2010, Dakar, Senegal.
Bassi, M. and S. Galiani, (2008). “Youth Labor Market in Latin America: A
Descriptive Analysis”, Mimeo, Inter-American Development Bank,
Washington DC.
Battistón, D., G. Cruces, L.F. López Calva, M.A. Lugo and M.E. Santos, (2009). “Income and beyond: Multidimensional Poverty in six Latin American
countries”, OPHI Working Paper No. 17, Oxford.
Bérgolo, M., M. Leites and G. Salas, (2008). “Pobreza y Justicia Social.
Conceptos e interrelaciones”, Quantum, IV(1), UDELAR, Uruguay.
Bourguignon, F. and S. Chakravarty, (2003). “The Measurement of
Multidimensional Poverty”, Journal of Economic Inequality, 1: pp. 25-49.
Busso, M., F. Cerimedo and M. Cicowiez, (2004). “Pobreza, Crecimiento y Desigualdad: Descifrando la última década en Argentina”, Paper presented at the XL Annual AAEP Meetings in Buenos Aires, Argentina.
Chaudhuri, S., (2003). “Assessing vulnerability to poverty: Concepts,
empirical methods and illustrative examples”, Mimeo, Columbia University.
Chiappero Martinetti, E., (2005). Capability Approach and Fuzzy Set Theory: Description, Aggregation and Inference Issues, in Lemmi, A. and G. Betti,
(eds.): Fuzzy Set Approach to Multidimensional Poverty Measurement,
Springer.
Cooney, P., (2003). Argentina at the Abyss, Unpublished manuscript, Queens
Conconi, A., (2009). “Pobreza Multidimensional en Argentina: Ampliando las Medidas Tradicionales de Pobreza por Ingresos y NBI”. Facultad de Ciencias Económicas, UNLP.
Cruces, G., (2005). “Income fluctuations, poverty and well-being over time: theory and application to Argentina”, Distributional Analysis Research Programme Working Paper 76, STICERD, London School of Economics and Political Science.
Cruces, G. and L. Gasparini, (2008), “Programas Sociales en Argentina:
Alternativas para la Ampliación de la Cobertura”, CEDLAS Working Paper
No. 77, Universidad Nacional de la Plata, (11/08)
Cruces, G. and P. Glüzmann, (2009), “The Impact of aggregate crises on social
indicators: The case of Argentina”, Unpublished report, CEDLAS/UNDP.
Cudeck, R. and R. MacCallum, (eds.), (2007). Factor Analysis at 100:
Historical Developments and Future Directions, Lawrence Erlbaum Associates.
D’Ambrosio, C., P. Muliere and P. Secchi, (2002). “The Endogenous Poverty Line as a change point in the income distribution: the Principle of transfers
revisited”, Paper Prepared for the 27th General Conference of The
International Association for Research in Income and Wealth Djurhamn (Stockholm Archipelago), Sweden, 18 to 24 August 2002.
Decanq, K. And M.A. Lugo, (2010). “Weights in Multidimensional Indices of
Well-Being: An Overview”, Discussion Paper No. ces10.06, Center for
Economic Studies, Katholieke Universiteit Leuven.
De Mesnard, S., (2007). “Poverty reduction: the paradox of the endogenous
poverty line”, LEG, Economy Series, Working Paper No. 2007-05, (03/07).
Dabós, M., L. Secco and B. Olaiz, (2007). “La ¿última? Crisis de Argentina”,
Paper presented at the XLII Annual AAEP Meetings in Bahía Blanca,
Argentina.
De Haan, A., (1999). “Social Exclusion: Towards an Holistic Understanding
of Deprivation”, Paper for the World Development Report 2001 Forum on
Inclusion, Justice, and Poverty Reduction.
Poverty Comparisons with Discrete Indicators of Well-Being”, CIRPEÉ Working Paper No. 06-28.
Fiszbein, A., P. Giovagnoli and I. Adúriz, (2003). “Argentina’s crisis and its
impact on household welfare”, CEPAL Review, 79.
Galiani, S., (2009). “Reducing Poverty in Latin America and the Caribbean”, CEDLAS Working Paper No. 88, Universidad Nacional de la Plata, (09/09).
Gasparini, L., F. Gutierrez and L. Tornarolli, (2007). “Growth and Income Poverty in Latin America and the Caribbean: Evidence from household
surveys”, Review of Income and Wealth, 53(2): pp. 209-235.
Gasparini, L. and G. Cruces, (2008), “A Distribution in Motion: The Case of
Argentina”, CEDLAS Working Paper No. 78, Universidad Nacional de la
Plata, (11/08).
Gasparini, L., F. Haimovich and S. Olivieri, (2009), “Labor informality bias of
a poverty-alleviation program in Argentina”, Journal of Applied Economics,
Universidad del CEMA, XII: pp. 181-205.
Gasparini, L., G. Cruces, L. Tornarolli and M. Marchionni, (2009), “A Turning Point?: Recent developments on Inequality in Latin America and the
Caribbean”, CEDLAS Working Paper No. 81, Universidad Nacional de la
Plata, (02/09).
Gasparini, L., W. Sosa Escudero, M. Marchionni, S. Olivieri, (2010), “Income, Deprivation and Perceptions in Latin America and the Caribbean: New
Evidence from the Gallup World Poll”, CEDLAS Working Paper No. 100,
Universidad Nacional de la Plata, (06/10).
Hardle, W. and L. Simar, (2007). Applied Multivariate Statistical Analysis,
Springer, New York.
Kakwani, N., (2003). “Issues in setting absolute poverty lines”, Poverty and
Social Development Papers, No. 3, Asian Development Bank, (06/03).
Kakwani, N., and J. Silber, (2007), Quantitative Approaches to
Multidimensional Poverty Measurement, Macmillan Publishing.
Krishnakumar, J. and A. Nagar, (2007). “On Exact Statistical Properties of Multidimensional Indices Based on Principal Components, Factor Analysis,
pp. 481-496.
LeGrand, J., (2003). Individual Choice and Social Exclusion, CASE Working
Paper 75, London School of Economics, UK.
López-Pablos, R., (2009). “Una aproximación antropométrica a la medición de
la pobreza”, CEDLAS Working Paper No. 85, Universidad Nacional de la
Plata, (06/09).
McKenzie, D., (2004). “Aggregate Shocks and Urban Labor Market
Responses: Evidence from Argentina's Financial Crisis”, Economic
Development & Cultural Change, 52(4): pp. 719-758.
Mussard, S. and M.N. Pi Alperin, (2008). “Inequalities in Poverty: Evidence
from Argentina”, Applied Economics Letters, 15(10): pp. 759-765.
Nunes, C., (2008). “Poverty Measurement: The Development of Different
Approaches and its Techniques”, ECINEQ Working Paper Series, No.
2008-93, August.
Perry, G. and L. Servén, (2003). “The anatomy of a multiple crisis: Why was Argentina special and what can we learn from it?”, World Bank Policy Research Working Paper No. 3081, The World Bank, Washington DC.
Poggi, A., (2004). “Social Exclusion in Spain: Measurement Theory and
Application”, PhD Thesis, Universitat Autonoma de Barcelona, Spain.
Sahn, D.E. and D.C. Stifel, (2000). “Poverty comparisons over time and across
countries in Africa”, World Development, 28(12): pp. 2123-2155.
Sen, A., (1981) “Poverty and Famines: An Essay on Entitlements and
Deprivation”. Oxford Clarendon Press.
Sen, A., (1992), Inequality Reexamined, Harvard University Press.
Sen, A., (1999), Development as Freedom, Alfred A. Knopf.
Sen, A., (2000a). “Social Exclusion: Concept, Application and Scrutiny”, Social Development Papers, No.1, Asian Development Bank.
Sen, A., (2000b), Social Justice and the Distribution of Income, Chapter 1: 60-81, Handbook of Income Distribution, Elsevier Science B.V.
the sensitivity if income poverty measures and trends”, Australian Economic Review, 41(4): pp. 371-388.
Simler, K.R., (2006). “Poverty comparisons with endogenous absolute poverty lines”, Contributed paper prepared for presentation at the International Association of Agricultural Economists conference, Gold Coast, Australia, August 12-18, 2006.
Smithson, M. and J. Verkuilen, (2006). “Fuzzy Set Theory: Application in the Social Sciences”, Sage Publications.
Thorbecke, E., (2005). “Multi-dimensional Poverty: Conceptual and
Measurement Issues”. Paper prepared for The Many Dimensions of Poverty
International Conference, UNDP International Poverty Centre, Brasilia, August 29-31.
Tsui, K., (2002). “Multidimensional poverty indices”, Social Choice and
Welfare, 19(1): pp. 69-93.
Tornarolli, L., (2007). “Metodología para el Análisis de la Pobreza Rural”, CEDLAS Working Paper No. 58, Universidad Nacional de la Plata, (09/07).
Zaccaría, H. and J.I. Zoloa, (2006). “Desigualdad y Pobreza entre las Regiones
Argentinas: Un Análisis de Microdescomposiciones”, CEDLAS Working
Appendix A. Table A.1
Kaiser-Meyer-Olkin measure of sampling adequacy Year
Labor Assets Education
1998 0.663 0.592 0.500
1999 0.660 0.573 0.500
2000 0.663 0.587 0.500
2001 0.673 0.586 0.500
2002 0.652 0.588 0.500
KMO Values
Table A.2
Correlation between dimensions
Year Labor Assets Education Income
1998
Labor 1.000
Assets 0.218 1.000
Education 0.299 0.359 1.000
Income 0.325 0.354 0.456 1.000
1999
Labor 1.000
Assets 0.207 1.000
Education 0.311 0.333 1.000
Income 0.336 0.326 0.434 1.000
2000
Labor 1.000
Assets 0.211 1.000
Education 0.313 0.341 1.000
Income 0.350 0.323 0.446 1.000
2001
Labor 1.000
Assets 0.211 1.000
Education 0.324 0.322 1.000
Income 0.349 0.321 0.431 1.000
2002
Labor 1.000
Assets 0.233 1.000
Education 0.294 0.318 1.000
Income 0.374 0.330 0.438 1.000
Appendix B. Derivation of the Social Valuation Function
Assume there are N individuals and G relevant functionings, and a matrix
of well-being results for each individual
i
=
1,2,...,
N
and dimension1,2,...,
g
=
G
.Within the capability approach, the individual valuation of a vector of functionings is the evaluation of the degree of functionings achieved by that person. Therefore, it is plausible to assume that individuals value a higher level in each functioning and value deprivation negatively. The simplest individual valuation function for this case would be a linear combination:
i g ig
g
z = −
∑
w xwhere wg are the weights given to the gth deprivation value. This weight
may be written as
1
(1
)
g g
g g
w
γ
γ
−
=
−
∑
, withγ
g representing the amount ofdeprived individuals in dimension g and with the sum of all the weights being
equal to one. The social value function (SVF), V, of the society is obtained by
adding across individuals:
i i
V
=
∑
z
Poggi (2004) proves that the SVF may also be written as:
*
( )
n G gmax{(
ig ig),0)}
i g
V x
=
∑∑
w
x
−
x
Figure 1
Evolution of poverty: GBA and Argentina 1974-2006
0 10 20 30 40 50 60
74 76 78 80 82 84 86 88 90 92 94 96 98 00 02 04 06
Po
ve
rt
y Ra
te
(O
ff
ic
ia
l
Mo
d
er
ate
l
in
e)
GBA Argentina
Source: Gasparini and Cruces (2008)
Figure 2
Changes in deprivation due to the crisis
Figure 3
Sensitivity of deprivation estimates to the relative comparison period
Table 1
Descriptive Statistics: variables used to construct dimensions
1998 1999 2000 2001 2002
Diff. 2002/1998
Diff. 2002/2001
Labor
Employment health insurance 61,2 60,8 58,8 58,7 55,0 -6,2 -3,7 Rights to a pension 62,4 62,0 61,9 61,8 56,1 -6,3 -5,7 Formal worker 57,4 57,1 56,1 55,7 57,3 -0,1 1,6 Permanent occupation 83,2 85,3 84,9 83,8 79,0 -4,2 -4,8
Assets
Well-constructed dwelling 97,5 97,0 97,0 96,7 97,6 0,2 1,0 Access to water 97,8 98,7 98,1 98,7 98,3 0,5 -0,3 Has bathroom 82,5 83,8 84,1 84,4 83,6 1,1 -0,8 Has sewer access 51,4 52,5 53,3 53,8 53,1 1,7 -0,8 Access to electricity 99,6 99,6 99,5 99,6 99,6 0,1 0,1
Education
Primary Incomplete 24,8 23,5 23,4 23,2 22,7 -2,0 -0,4 Primary complete 28,0 27,9 27,8 27,7 26,2 -1,8 -1,5 Secondary incomplete 16,7 16,2 15,7 15,2 15,9 -0,8 0,7 Secondary complete 16,1 17,1 17,4 17,9 18,4 2,4 0,5 College incomplete 4,9 5,2 5,1 5,2 5,4 0,5 0,2 College complete 9,5 10,0 10,6 10,8 11,3 1,8 0,5 Literate 86,2 86,8 86,7 86,5 86,8 0,6 0,3 Primary Attendance 99,0 99,3 99,2 98,6 99,3 0,3 0,7 Secondary Attendance 80,7 83,9 86,4 86,7 87,4 6,8 0,8
Income (per capita HH income 326,97 306,03 296,96 273,31 262,59 -64,4 -10,7
in AR$)
Table 2
Weight of each dimension in BC Index Year
Labor Assets Education Income
1998 0.188 0.292 0.295 0.225
1999 0.186 0.295 0.295 0.224
2000 0.186 0.294 0.296 0.224
2001 0.187 0.296 0.296 0.221
2002 0.173 0.303 0.304 0.221
Weight of each dimension in BC Index
[image:36.595.126.413.378.466.2]Source: own calculations from EPH surveys
Table 3
Multidimensional deprivation
Overall Labor Assets Education Income
1998 13.7 37.4 2.3 1.6 24.7
1999 13.6 38.1 1.4 1.5 25.2
2000 13.8 38.1 2.0 1.5 25.6
2001 13.8 38.0 1.5 1.5 26.6
2002 14.8 43.9 1.8 1.5 28.4
BC Index - Median Line
Table 4
Deprivation profile: Deprived in all dimensions
1998 1999 2000 2001 2002
Gender
Male 15.8 15.4 15.7 15.7 16.5 Female 16.6 16.4 16.6 16.7 17.4
Age Groups
15-24 20.3 18.8 19.6 20.8 21.1 25-40 14.5 14.2 14.3 14.6 15.2 41-64 12.5 12.7 12.9 13.3 14.0
Regions
GBA 14.8 14.6 14.9 15.2 15.6 Pampeana 16.1 15.8 16.0 16.4 17.7 Cuyo 17.9 17.3 17.5 16.5 17.5 NOA 20.7 20.1 20.3 19.4 20.9 Patagonia 11.9 11.8 11.2 10.8 11.6 NEA 22.8 21.9 22.9 21.3 22.8
Table 5
Deprivation profile: Labor dimension
1998 1999 2000 2001 2002
Gender
Male 35.5 35.8 35.7 35.4 40.9 Female 40.1 41.2 41.4 41.3 47.4
Age Groups
15-24 59.2 55.8 57.6 60.3 65.5 25-40 32.5 33.0 33.8 35.0 40.6 41-64 29.2 30.9 30.4 30.5 35.8
Regions
GBA 37.0 38.0 37.7 37.7 42.7 Pampeana 35.9 35.4 37.6 37.8 44.8 Cuyo 41.0 42.2 39.4 38.4 43.1 NOA 42.7 44.9 43.3 42.8 51.7 Patagonia 28.0 27.4 27.2 27.5 30.5 NEA 41.7 40.9 41.8 40.1 50.9
Table 6
Deprivation profile: Income dimension
1998 1999 2000 2001 2002
Gender
Male 24.7 25.6 25.6 26.8 28.9 Female 24.8 24.8 25.5 26.4 27.9
Age Groups
15-24 24.4 23.8 23.5 27.9 29.5 25-40 21.4 22.7 22.5 23.1 24.9 41-64 18.3 20.0 20.5 21.8 23.4
Regions
GBA 35.5 35.7 36.4 40.3 39.3 Pampeana 43.4 42.7 41.8 45.0 46.5 Cuyo 47.4 45.4 47.8 46.6 47.5 NOA 57.0 53.7 55.5 53.3 56.1 Patagonia 30.5 30.5 28.8 26.6 30.5 NEA 62.0 60.1 62.3 61.5 60.6