PERFORMANCE ANALYSIS OF SIMULTANEOUS MULTICHANNEL
CHARACTERIZATION OF ACOUSTIC SYSTEMS
PACS 43.58.e 43.75.Yy
López, José J.; González, Alberto
Departamento de Comunicaciones. Universidad Politécnica de Valencia Crta. Nazaret-Oliva s/n
46022 GRAO DE GANDIA SPAIN
Tel. +34 96 2849348 Fax +34 96 2849309
E-mail: jjlopez@dcom.upv.es, agonzal@dcom.upv.es
ABSTRACT
Measure transfer responses or, equivalently, impulse responses is a very important task to characterize acoustic systems. Multichannel acoustic systems are becoming very common in practical reproduction systems mainly for 3D audio applications. Measure of a system with multiple sources can be carried out sequentially, however, novel simultaneous methods are recently introduced by the authors in order to save measure time and provide a more versatile measure method. In this work the performance of a simultaneous method using MLS is compared with a sequential method. Mean square error between the two methods has been compared and analysed for validation.
1 INTRODUCTION
A common task in acoustics and audio consists in system identification of transducers (loudspeakers, microphones, etc), electronic equipment (preamplifiers, power amplifiers, filters, equalizers, etc) and rooms. In major part of applications only magnitude of the frequency response needs to be measured, and in some cases only low resolution (octaves, or thirds of octave) of this response are needed.
However, the constant improvement and evolution in this field and the introduction of digital techniques points towards better and more precise estimation and system identification methods. The characterization of the impulse response of a linear system, provides a full description and other parameters can be obtained from it very easy. For example, if the impulse response refers to a room, it is possible to compute the most common acoustical parameters according to the ISO3382 standard, [ISO97].
The basic method of system identification uses the relation between the impulse response of the linear system under test and the correlation sequences between the input and the output of this system. The use of periodic sequences to carry out this measurement is quite extended due to their useful properties as: low measurement time, artifacts and noise immunity and the availability of fast computational methods to carry out the needed calculations.
2. MULTIPLE SOURCE SYSTEMS
In general the above mentioned methods allow the user to measure the acoustic path between a sound source and a listening point, or between a sound source an some listening points, fig 1. These systems are known as SIMO (single input – multiple output).
h11( t)
x1(t)
y1(t)
h21( t)
yN(t)
y2(t)
[image:2.595.219.377.166.250.2]hN1( t)
Figure 1. Single source - multiple destination system.
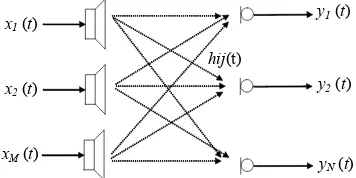
In the case of MIMO (multiple input – multiple output) systems as shown in figure 2, the procedure for measuring all the acoustic paths between each source and each listening point is more complex and time consuming. Only one source can be excited at the same time with the test signal, so only the acoustic paths between this source and the listening points can be measured in each measurement cycle.
Therefore, in order to measure the complete set of impulse responses, as many sources there are as many measurement cycles are needed. So measurement time is increment by a factor of M in case of multiple source systems.
x2(t)
y1(t)
hij(t)
yN(t)
y2(t)
x1(t)
xM(t)
Figure 2. Multiple source - multiple destination system.
However, in the last years, there is each time more common in acoustic and audio engineering to work with multiple sources systems, as for example:
• Arrays of loudspeakers used in public address systems in order to cover with constant level big auditoriums or arenas with large audiences.
• Surround sound reproductions systems, where the number of loudspeakers is directly related with the spatial sensation of sound obtained. In the last years the introduction of digital audio compression techniques has bring to the market systems with 5.1, 6.1, 7.1 and up to 10.2 channels.
• Multiway public address systems with active cross-overs networks and independent amplification stages for each way.
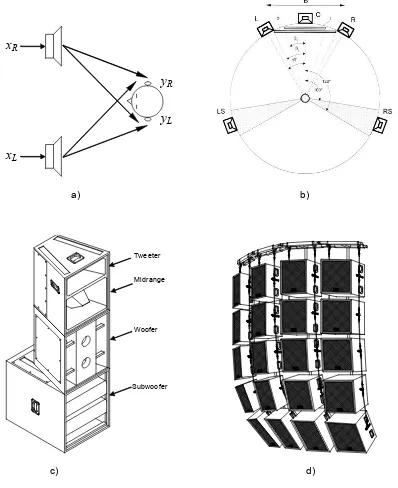
[image:2.595.208.386.427.516.2]• Other spatial sound systems that uses a lot of speakers, as for example Ambisonics, VBAP and the novel system Ambiophonics, [Far01] [Lop01].
In last years, the use of multichannel sound reproduction systems has become common and it is expected that their use increase in next years. Therefore it seems useful to make available a practical and versatile method to simultaneously measure multichannel system responses. In the figure 3 we have resume graphically all this kind of advanced sound systems.
x
Rx
Ly
Ry
L
a) b)
Tweeter
Midrange
Woofer
Subwoofer
[image:3.595.90.488.203.691.2]
c) d)
Figure 3. Multiple source audio systems: a) 3D audio system based on HRTF and cross-talk cancellation. b) Surround Sound System in 5.1 configuration. c) Multiway public address
3. SYMULTANEOUS MULTICHANNEL MEASSUREMENT
The natural way to develop a simultaneous multichannel measurement method consists in generalize the existing methods and so exploit the experience gained from the use of the single channel case. Only a multiple input single output system (MISO) need to be formulated, since every multiple input multiple output system (MIMO) can be separated in as many MISO systems as system outputs.
The mathematically analysis of the general case for different excitation periodic signals was rigorously formulated previously by the authors in [Gon01].
Now, we are going to particularise the method for a MLS system and to explain it easily in a time domain form. Lets consider a MISO system with M sources where the impulse response between each source and arrival point is represented by
h
i[ ]
n
.Let
m
~
[ ]
n
be a periodic MLS signal of period L, where L=2n-1. Each source is fed by the periodic sequencem
~
[ ]
n
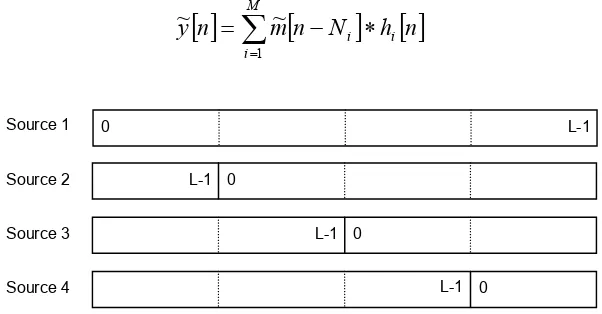
subject to different and proper time displacements Ni, fig. 4, so the systemoutput will be periodic of period L (since all the system inputs are periodic sequences with the same period) and it is expressed as:
[ ]
n
m
[
n
N
] [ ]
h
n
y
M i [image:4.595.148.449.321.478.2]i i
∗
−
=
∑
=1~
~
0 L-1 0 L-1 0 L-1 0 L-1 Source 1 Source 2 Source 3 Source 4Figure 4. MLS excitation signal for each source, convenient delayed.
For recovering the impulse response using the MLS method, the system output must be circular convolved by a unipolar and time reversed version of the MLS,
s
~
[ ]
n
. When the periodic impulse response has zero mean value, it is possible to recover the periodic impulse response directly from the circular correlation between the Maximum Length Sequence and the system output, which is the most usual method in practice and fast algorithms have been developed for this purpose, [Alr83].[ ] [ ]
1
1
~
~
+
+
−
=
L
n
m
n
s
[ ] [ ] [ ]
n
y
n
s
n
m
[
n
N
] [ ] [ ]
h
n
s
n
z
M ii i
~
~
~
~
~
1∗
∗
−
=
∗
=
∑
= Grouping terms:[ ]
n
m
[
n
N
] [ ] [ ]
s
n
h
n
z
M ii
i
∗
∗
Applying the properties of MLS we obtain:
[ ]
[
]
[ ]
i[
i]
M
i i i M
i
N
n
h
n
h
N
n
n
z
=
∑
−
∗
=
∑
−
=
=1 1
~
δ
So at the output a summation of the delayed version of impulse responses of each channel is obtained, fig. 5. The time delays Ni and the length L of the MLS, has to be conveniently chosen
to carry out a useful measure. In general, duration of
h
i[ ]
n
must be less than Ni samples inorder to avoid overlap between responses of each channel. In practice if all the impulses responses have similar length, all Ni are chosen equally spaced: Ni≈i·L / M .
h1
h2
h3
h4
[image:5.595.99.511.216.388.2]Obtained response
Figure 5. Signal obtained at the output when feed the system with delayed MLS
4. PERFORMANCE ANALYSIS
A first look to the impulse responses obtained using simultaneous method and using the classical sequential method does not reveals appreciable differences. Therefore, in order to carefully test the performance and the goodness of the simultaneous method compared to the sequential one, the next method has been devised:
1. A system with two loudspeakers and one microphone has been set up.
2. In order to obtain the two impulse responses with great precision, we have used a MLS of order 15, using 10 averages to ensure a very good signal-to-noise relation.
3. The impulse response of both channels has been measured using sequential method with MLS of order 15 and without averaging.
4. The impulse response of both channels has been measured using simultaneous
method with MLS of order 16 and without averaging.
5. The mean square error of the magnitude spectra between the measure of reference
and the other two measures has been calculated for comparison.
[image:5.595.173.422.639.695.2]Loudspeaker 1 Loudspeaker 2 Sequential 0.0438 0.0405 Simultaneous 0.0592 0.0582
Table 1. Comparison of the mean square error of the magnitude spectra for the two methods
5. ADVANTAGES OF THE SYMULTANEOUS METHOD
Measuring time is inferior in the simultaneous method, since the transitory time at the beginning of the measurement (for achieve circular convolution with the MLS) is required only once and M times in the sequential method. So, for similar impulse response lengths N0 for all the channels,
the time gain tends to 2 when the number of channels increases:
2
lim
,
)
1
(
2
M 0
0
tan
=
+
=
=
∞ → gain
eous simul
sequential
gain
M
N
T
MN
T
T
T
The measurement of the channels using simultaneous method is carried out at the same time interval for all of them. Oppositely using sequential one is carried at different time periods. This is another advantage if favour of the simultaneous method, especially when the channels change over the time, due to diverse factors.
As tested before, the noise rejection in simultaneous method is similar than in the sequential one. At a first glance, the simultaneous method has superior noise rejection because it uses a longer sequence. However it is possible that in practice the powers of the inputs to the system used in the simultaneous method have to be reduced in order not to saturate the measuring microphone. Finally, measurement averaging is also possible in the multichannel method, to improve the signal to noise ratio and avoid artifacts.
6 CONCLUSIONS
A general method to simultaneously measure multichannel systems, multiple input multiple output systems, by means of periodic sequences has been presented. This method generalizes the existing methods for single input single output systems. By means of the analysis of the mean square error between the sequential and simultaneous methods, the second one has been validated as a smart solution for measuring the impulse response of multichannel systems, saving measuring time.
7 ACKNOWLEDGMENTS
This work was supported by Generalitat Valenciana, grant GV00-094-14 and CICYT, grant TIC 2000-1683-C03.
REFERENCES
[Alr83] Alrutz, H. & Schroeder, M.R., A fast Hadamard transform method for the evaluation of measurements using pseudorandom test signals. In Proc. 11th Congress Acoust., Paris (GALF, France, 1983) 6 (1983) 235-8
[Far01] Farina A., Glasgal R., Armelloni E., Ambiophonic Principles for the Recording and Reproduction of Surround Sound for Music, Proc. 19th AES Conference, Surround Sound, Schloss Elmau (Germany), June 2001
[Gon01] González A. & López J.J. Simultaneous multichannel measurements by means of periodic sequences. 17th International Congress on Acoustics (ICA 2001), Rome (Italy), 2001
[Iso97] ISO/FDIS 3382, Acoustics - Measurement of the Reverberation Time of rooms with reference to other acoustical parameters, International Organisation for Standardisation (1997).
[Lop01] López J.J., González A., Ambiophonic Multichannel Convolver Software Tool, Proc. 19th AES Conference, Surround Sound, Schloss Elmau (Germany), June 2001
[Pol88] M. Poletti – “Linearly swept frequency measurements, time-delay spectrometry, and the Wigner distribution” JAES vol. 36, n. 6, 1988 June, pp. 457-468.
[Rif89] Rife D.D. & Vanderkooy J. Transfer-Function Measurement with Maximum-Length Sequences.Journal of the Audio Engineering Society, 37 (6) 1989, pp 419-444