A STUDY OF COMMUNITY ANNOYANCE FROM WIND TURBINES IN
AZORES
PACS: 43.50.Ba
Patrício, Jorge
Laboratório Nacional de Engenharia Civil Av. do Brasil
1700 Lisboa. Portugal Tel. 351 218 443 273 Fax. 351 218 443 028 E-mail: jpatricio@lnec.pt
ABSTRACT
Virtually it is well known that everything with moving parts creates some sort of noise. The wind turbines follow this principle. Although they may be considered relatively quiet in operation, they are a focus of environmental impacts, both in aesthetic and noise terms.
People at their homes often complain because of noise emitted from wind farms. And this happens frequently whenever these facilities are located near urban areas and the wind blows at high velocity.
This paper presents the results of a set of noise levels measurements done in the surroundings of a wind farm in Azores, Portugal, in order to evaluate community annoyance for the residents. The measurements were performed inside the houses accordingly with what is established in the appropriate Portuguese environmental noise standard. The results showed the existence of conformity with legal requirements on the subject. Additionally it raises some non-coherence regarding the procedure used for this kind of evaluation.
1 – INTRODUCTION
In order to evaluate the annoyance caused by noise produced by a wind farm located in AZORES Island, in Portugal, for the nearby residents, a noise levels measurement campaign was required to LNEC by the appropriate governmental Portuguese Department. This annoyance is mainly felt by residents whenever the wind blows both from south or north
direction at velocities generally higher than 10 ms-1.
The measurements were performed in accordance with ISO Standard 1966-1987, and the conclusions follows what is imposed by the Portuguese Noise Pollution Act (Decree-Law nº
292/2000, November, 14th).
In relation to the wind farm exploitation conditions the Portuguese Noise Pollution Act sets forth, in its Article 8º - “Permanent noisy activities”, the following:
The magnitude of these differences can be enlarged adding specific corrections based on the real and effective time of the duration of the activity, in accordance with what is established in the Table I.
Table I – Corrections for the duration of activity
.
Cumulative duration of the activity, T D
dB(A)
T ≤ 1 h 4
1 h < T ≤ 2 h 3
2 h < T ≤ 4 h 2
4 h < T ≤ 8 h 1
T > 8 h 0
For the night time period the values of 4 and 3 dB(A) can only be used for activities whose duration do not overpasses midnight.
Cumulative to what was mentioned, a penalty regarding the existence of tonal components -
K1 - or impulsive characteristics - K2 - can also be added. In case, the final equation used to
perform this kind of evaluation is the following:
LAeq(ambient noise) – LAeq(background noise) + K1 + K2≤ 3 dB(A) + D
2 – CHARACTERISATION OF THE SITE
The wind farm has 6 wind turbines placed in a line (E-W direction), located on the top of a hill. Each wind turbine has the following characteristics (manufacturer´s information):
§ Power: 300 kW;
§ Diameter of the Rotor: 30 m
§ Height of the Tower: 44 m
§ Noise power level: 98,0 dB(A) / 99,0 dB(A), for a wind speed of 8 m/s
[image:2.596.147.472.581.745.2]At a distance of 400 m south, there is an urban area whose residents often complain against excessive noise levels produced by the wind farm exploitation, both in daytime (7-22h) and night time periods (22-7h). These complains (annoyance felt inside bed and living rooms) arise whenever the wind reaches velocities of 10 m/s or higher.
Figure 1 shows a panoramic view of the relative locations this work deals with: the wind farm and the urban area.
3 – RESULTS
[image:3.596.98.496.189.343.2]Prior to the annoyance analysis (measurements) performed inside the houses of the complaining people in the urban area, several measurements were done in the vicinity of a wind turbine (nº 3) in order to evaluate the sound pressure level it establishes nearby. Figure 2 shows a schematic illustration of the cross-section view of the wind turbine location and the slop of the hill. It should be mentioned that the complaining residents (urban area) are living towards south direction.
Fig. 2 – Measurement points in the vicinity of wind turbine nº 3
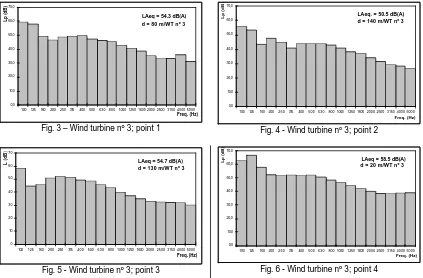
The measurements results are shown in figures 3 to 6. It should be noticed that these values do not strictly represent the noise established by this wind turbine (number 3), because the levels measured are naturally influenced by the noise coming from the other wind turbines which were simultaneously in operation.
LAeq = 54.3 dB(A) d = 80 m/WT nº 3
0,0 10,0 20,0 30,0 40,0 50,0 60,0 70,0
100 125 160 200 250315 400 500 630 800 1000 1250 1600 2000 2500 3150 4000 5000
Freq. (Hz)
[image:3.596.87.510.452.730.2]Lp (dB)
Fig. 3 – Wind turbine nº 3; point 1
LAeq. = 50.5 dB(A) d = 140 m/WT nº 3
0,0 10,0 20,0 30,0 40,0 50,0 60,0 70,0
100 125 160200 250 315 400 500 630 800 10001250 1600 2000 2500 3150 4000 5000
Freq. (Hz)
Lp (dB)
Fig. 4 - Wind turbine nº 3; point 2
LAeq = 54.7 dB(A) d = 130 m/WT nº 3
0 10 20 30 40 50 60 70
100 125 160 200250 315 400 500 630 800 1000 1250 1600 2000 2500 3150 4000 5000
Freq. (Hz)
L (dB)
Fig. 5 - Wind turbine nº 3; point 3
LAeq = 58.5 dB(A) d = 20 m/WT nº 3
0,0 10,0 20,0 30,0 40,0 50,0 60,0 70,0
100 125 160200 250 315 400 500 630 800 10001250 1600 2000 2500 3150 4000 5000
Freq. (Hz)
Lp (dB)
Fig. 6 - Wind turbine nº 3; point 4 d = 60 m
d = 80 m
d = 20 m
d = 110 m 1
2 3
4
Wind turbine nº 3
In the next set of figures the results of measurements performed inside each house (6 in total, identified by A, B, C, D, E and F) are presented. This information is the basis for the evaluation of the annoyance caused by the exploitation of wind farm. The distribution of figures is as follows: the figure on the left shows the spectra of ambient noise with the indication whether there is tonal component or not; the figure on the right the spectra of background noise.
LAeq = 23.9 dB(A) K1 = 0 dB(A) K2 = 0 dB(A)
0,0 10,0 20,0 30,0 40,0 50,0 60,0
100 125 160 200 250 315 400 500 630 800 1000 1250 1600 2000 2500 3150 4000 5000
Freq. (Hz)
[image:4.596.86.509.150.681.2]Lp (dB)
Fig. 7 – House A – Ambient Noise
LAeq = 21.7 dB(A)
0,0 10,0 20,0 30,0 40,0 50,0 60,0
100 125 160200 250 315 400 500630800 10001250 1600 2000 2500 3150 4000 5000
Freq. (Hz)
Lp (dB)
Fig. 8 - House A – Background noise
LAeq = 22.3 dB(A) K1 = 0 dB(A) K2 = 0 dB(A)
0,0 10,0 20,0 30,0 40,0 50,0 60,0
100 125 160 200 250 315 400 500 630 800 1000 1250 1600 2000 2500 3150 4000 5000
Freq. (Hz)
Lp (dB)
Fig. 9 – House B – Ambient Noise
LAeq = 21.3 dB(A)
0,0 10,0 20,0 30,0 40,0 50,0 60,0
100 125 160200 250 315 400 500 630 800 10001250 1600 2000 2500 3150 4000 5000
Freq. (Hz)
Lp (dB)
Fig. 10 - House B– Background noise
LAeq = 21.9 dB(A) K1 = 3 dB(A) K2 = 0 dB(A)
0,0 10,0 20,0 30,0 40,0 50,0 60,0
100 125 160 200 250 315 400 500 630 800 1000 1250 1600 2000 2500 3150 4000 5000
Freq. (Hz)
Lp (dB)
Fig. 11 – House E– Ambient Noise
LAeq = 19.1 dB(A)
0,0 10,0 20,0 30,0 40,0 50,0 60,0
100 125 160200 250 315 400 500 630 800 10001250 1600 2000 2500 3150 4000 5000
Freq. (Hz)
Lp (dB)
Fig. 12 – House E – Background noise
LAeq = 30.8 dB(A) K1 = 3 dB(A) K2 = 0 dB(A)
0,0 10,0 20,0 30,0 40,0 50,0 60,0
100 125 160 200 250 315 400 500 630 800 1000 1250 1600 2000 2500 3150 4000 5000
Freq. (Hz)
Lp (dB)
Fig. 13 – House F – Ambient Noise
LAeq = 25.5 dB(A)
0,0 10,0 20,0 30,0 40,0 50,0 60,0
100 125 160200 250 315 400 500 630 800 10001250 1600 2000 2500 3150 4000 5000
Freq. (Hz)
Lp (dB)
Fig. 14 - House F – Background noise
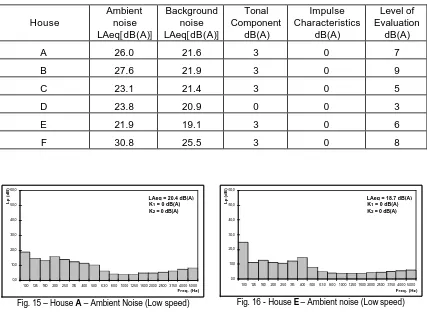
Table II – Summary of the results obtained
House
Ambient noise
LAeq[dB(A)]
Background noise
LAeq[dB(A)]
Tonal Component
dB(A)
Impulse Characteristics
dB(A)
Level of Evaluation
dB(A)
A 26.0 21.6 3 0 7
B 27.6 21.9 3 0 9
C 23.1 21.4 3 0 5
D 23.8 20.9 0 0 3
E 21.9 19.1 3 0 6
F 30.8 25.5 3 0 8
LAeq = 20.4 dB(A) K1 = 0 dB(A) K2 = 0 dB(A)
0,0 10,0 20,0 30,0 40,0 50,0 60,0
100 125 160 200 250 315 400 500 630 800 1000 1250 1600 2000 2500 3150 4000 5000
Freq. (Hz)
Lp (dB)
Fig. 15 – House A – Ambient Noise (Low speed)
LAeq = 18.7 dB(A) K1 = 0 dB(A) K2 = 0 dB(A)
0,0 10,0 20,0 30,0 40,0 50,0 60,0
100 125 160 200 250 315 400 500 630 800 1000 1250 1600 2000 2500 3150 4000 5000
Freq. (Hz)
[image:5.596.85.512.89.402.2]Lp (dB)
Fig. 16 - House E – Ambient noise (Low speed)
4 – CONCLUSIONS
As a primary conclusion one may state that for specific meteorological conditions, which were met in all cases analysed, community annoyance were found for night time period. Notwithstanding, it must be referred that there were no information regarding the compliance of noise insulation of façades with the legal requirements set forth for the purpose. This compliance is of major importance for, accordingly with the criteria previously mentioned, it is possible to find activities in illegal situation (to which some penalties have to be imposed) when another important part of the global legal requirements are not fulfilled (an appropriate sound insulation of buildings´ external walls).
The specific meteorological conditions referred to above are those related to wind velocity and direction. The worst situation is when the line defined by the wind farm and the urban area follows the north-south direction, blowing the wind on the same direction, no matters whether it blows from the north or the south.
In the study performed, it is also interesting to notice a tonal component in the frequency band of 125 Hz, which penalizes in 3 dB(A) the different obtained between ambient and background noise. However this component does not show up in the measurements performed in the vicinity of wind turbine number 3. So, a question arises: how a tonal component can be established inside houses when it is not detected near the potential noise source. At first sight it seems to appear only when the wind turbine blades cuts the air vortices that are generated in
front of the tower for certain values of high wind velocity. To analyse this, a specificstudy should
REFERENCES
1. NP 1730: 1996 – Acústica. Descrição e medição do ruído ambiente. Parte 1 – Grandezas
Fundamentais e Procedimentos. “Acoustics. Description and measurement of
environmental noise. Part 1 – Fundamentals and procedures”.
2. NP 1730: 1996 – Acústica. Descrição e medição do ruído ambiente. Parte 2 – Recolha de
dados relevantes para o uso do solo. “Acoustics. Description and measurement of
environmental noise. Part 2 - Relevant data for land-use planning”.
3. Regime Legal da Poluição Sonora – Aprovado pelo Decreto-Lei n.º 292/2000, de 14 de
Novembro. “Noise Pollution Act – Decree-Law nº 292/2000, November, 14th”.
4. PATRÍCIO, J. V. – Acústica nos edifícios. Lisboa, 2003, Edição do autor. “Acoustics in
buildings. Lisbon, 2003, Author´s Edition”.
5. Noise from wind turbines: the facts. The British wind energy association, June, 2000.
ACKNOWLEDGEMENTS