1
An international comparison of Mexico's over-the-top
video services market using hierarchical clustering
algorithm
*José Alberto Candelaria
Centro de Estudios, Instituto Federal de Telecomunicaciones.
Insurgentes Sur 838, Col. del Valle, Delegación Benito Juárez. C.P. 03100, México, D.F.
[email protected]
, 52155-50154818
Abstract
There exists a strong worldwide debate regarding over-the-top (OTT) services regulation. Its advocates argument that OTT companies do no invest in the network nor subject themselves to safety requirements; they do not have to pay for spectrum licenses and usually fiscal questions are attended in the countries with lower tax rates. Thus, it is considered that the fact that OTT companies are not subject to similar obligations and regulations than traditional operators promotes an unequal competition between OTT companies and traditional operators. On the other side, the growth of OTT services has allowed the development of an economy that every day bases more on the Internet. This phenomenon implies multiple benefits, however, also imposes new challenges. One of them refers to the consideration of a regulation that could be applied, in this case, to the new services. Futhermore, net neutrality principles’ defenders, hold that any type of charge imposed by internet service providers (ISP) to OTT companies in order to priorize its traffic would suppose a barrier to nascent and potentially disruptive companies that otherwise might not develop. In any case, before considering any type of regulation it is important to know if a particular OTT service market is doing well. For that respect the aim of this research consists on analyze the development of Mexico's over-the-top (OTT) video market from an international perspective. For that purpose we implement a hierarchical clustering algorithm considering agglomeration methods such as centroid, complete and ward. The fundamental
*Disclaimer: The content of this article is of the author's sole responsibility. It does not represent the views of the
2
objetive lies in identify if Mexico's OTT video market is comparable to promising markets instead of those who are stagnated. The study focuses particularly on OTT video total revenues and active devices (fixed, mobile and portable) for a sample data of 19 countries. The main advantage of hierarchical clustering analysis is that it allows to elucidate the existence of countries subgroups which share substantially similar characteristics in their OTT video market.
Keywords: Hierarchical Cluster Algorithm, Data Mining, Over-the-Top, Telecomm Regulation. JEL Classification: C38 L96
1 Introduction
The worldwide introduction of OTT's services relying on the network of the internet service provider (ISP) has affected the revenues of traditional telecom operators. Their success has generated a growing flow of traffic over broadband network imposing pressure on traditional telecoms into a need of investment in the network. Zuhdi et al. [13] argue that the access network is affected by the consumption of bandwidth that is done by OTT's applications and contents. Additionally, in pay-TV segment a notorious effect has been the decline in the number of subscribers, effect which is known as cord-cutting.
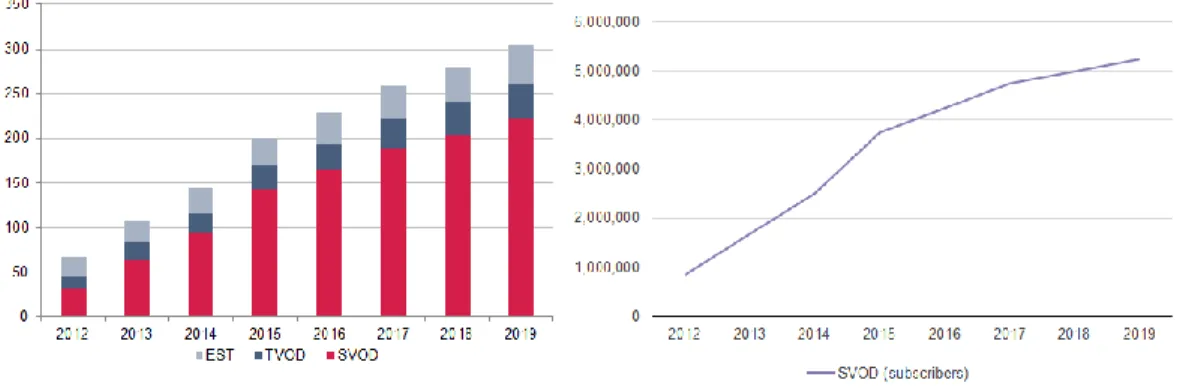
At Latin America regional level OTT companies such as Amazon, Facebook and Google have had an unquestionable economic success in recent years. In this regard, OTT video regional revenues have more than doubled in two years, increasing from US$1,050 millions in 2012 to US$2,606 millions in 20141. Even though these achievements are still behind in comparison with main economies such as those in Western Europe, OTT video regional revenues are forecasted to reach US$4,755 millions by year 2019. Furthermore, the number of active OTT video devices is a good indicator for the future trends in the progress of OTT video's applications. In 2014 the number of active devices, fixed and mobile, in Latin America region reached more than 13 and 80 millions, respectively (see Fig. 1). Mexico's figures reached 8 millions in the case of
3
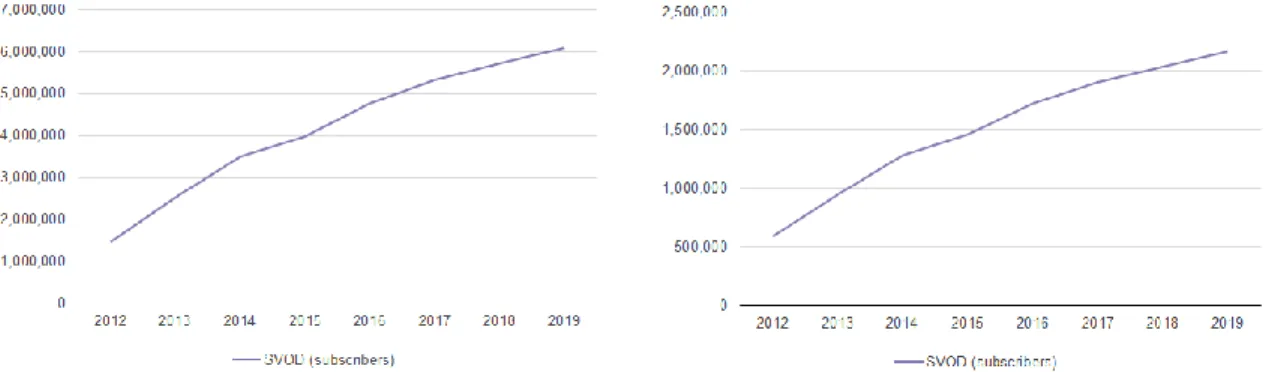
active mobile devices and 1.7 millions for active fixed devices in year 2014 (see Fig. 1). Regarding digital subscriptions or subscriptions on-demand (SVOD), such as Netflix or Amazon Instant Prime Video services, in Latin America region, they have increased from 1.4 million in 2012 to 3.4 millions in 2014 (see Fig. 2). It is expected that it will reach 6 millions by 20192. As Figure 2 shows, in Mexico the subscribers have more than doubled from .591 million in 2012 to 1.2 million in 2014.
Fig. 1 Total OTT video devices split by type. a) Left graph, Latin America and Caribbean; b) Right graph, Mexico (Source: OVUM. https://www.ovumkc.com/)
Fig. 2 Subscription on-demand. a) Left graph, Latin America and Caribbean; b) Right graph, Mexico (from OVUM. https://www.ovumkc.com/)
Despite previous considerations in favour of OTT video services some analysts such as Friedrich et al. [5] consider than traditional telecom operators have a room for manoeuvre. Specifically, Friedrich considers that they would be able to formulate and implement different competitive strategies aimed at the conservation of their revenues and subscribers. Whereas some others consist on the preservation of the infraestructure
4
business through the development of advanced connectivity services. Other options require the development of new applications and services. This approach involves a shift of paradigm beneficial for customers towards a quality-of-experience (QoE) instead of quality-of-service (QoS) [12]. The main difference being that QoE prioritizes the relation between the consumer and the applications which differs of QoS's vision that links the network with the applications. Ganuza et al. [6] analyze the bundling of services (fixed and mobile telephony, internet and TV) and the development of propietary OTT products by traditional operators in Latin America. The objective is to prevent cord-cutting
effect in the region and to compete with OTT services. They argue
that in the short and medium run the traditional operators shall not be threatened by OTT services because of the lack of high speed access networks in Latin America. A similar conclusion is found by Baccarne et al. [1] in an analysis for OTT TV services in Flemish market. The authors argue that competition between the two dominant television distributors and the adoption of triple play bundles has dispelled a cord-cutting scenario. Notwithstanding these claims, OTT telecommunication services has been historically considered a factor in the decline of established traditional telecommunications services [4]. For instance, during the second half of the 1990’s decade the email OTT service considerable affected the volume of global postal letters.Some other services that are, or could be displaced of the market by OTT’s disruptive innovation are:
Netflix, Hulu and similar platforms are an alternative for a considerable number of consumers, to
the detriment of the open TV (FTA) and pay TV.
Facetime and Skype could be a better option that long-distance calls.
Youtube shows videos and music which is also offered by broadcast channels.
Itunes displaces CD sellers.
5
On the other hand, Detecon Consulting3 establishes that telecommunications industry will generate worlwide 1.3 trillion Euros by year 2017, of which OTTs will generate 402 billions Euros. The compounded annual growth rate (CAGR) of worldwide OTT services for 2012 to 2017 period would reach 17.3%; while CAGR for traditional telecommunications services would be 2.6% for the same period. It is expected that cloud services will be the most important service segment, almost representing 1/3 of total service market by year 2017. Furthermore, there is now considerable optimism for Pay OTT video services in Mexican market. The Competitive Intelligence Unit4 measures its impact over restricted TV market and it concludes that Pay OTT video services will add up to 44% of paid content market in Mexico by year 2020.
Even though OTT's services have impacted traditional operators' resources, which in certain occasions prevent the investment in broadband infrastructure, they have positively contributed to the explosion of contents and innovation. The fact that OTT operators are free of legal requirements such as a license fee in order to enter to the market has allowed them to left its stamp in the development of innovative projects such as start-ups or individual content providers.
There exists a debate with respect to the application of a regulation to OTT companies that will impose a minimum standard of quality to its services. In that respect, it should be analyzed if that regulation could be applicable to all type of OTT services.
In this article we will focus on the assessment of Mexico's OTT video market by conducting a cluster analysis for a set of 19 developed and developing countries, by applying a hierarchical algorithm. The objective is to identify if Mexican OTT video market could be compared to successful international markets by considering OTT video revenues and OTT video active devices for years 2012 to 2015.
3
https://www.itu.int/en/ITU-D/Regional-Presence/AsiaPacific/Documents/Events/2014/ITU-ASEAN%20Forum%20-
%20Indonesia%20-%20Dec%202014/ITU%20Conference%20Jakarta%20-%20Day%202%20-%20Dr.%20Werner%20Knoben%20-%20Detecon.pdf
4
6
The hierarchical clustering algorithm is also known as similarity grouping and it considers different agglomeration methods such as centroid, complete and ward. The convenience of cluster analysis as a descriptive tool is its consideration of a multivariate framework, i.e. a set of measured variables [10], useful to classify a sample of objects, or subjects, into groups whose members share similar characteristics.
The paper is organized as follows. The following section presents the methodology for hierarchical clustering. Then, section 3 describes the sample data and the variables used in our analysis. In section 4 we present the results. Section 5 is about some regulations considerations for OTT services and in section 6 are the conclusions.
2 Methodology
In this article we analyze Mexico's OTT video market and for that respect we implement a data analysis based in a hierarchical clustering algorithm. In the stylistic vein of Exploratory Data Analysis (EDA) the main purpose is to present a comparison of the resemblances and differences between Mexico's OTT video service market and a set of countries' markets from a multidimensional point of view. In this way we shall obtain a more precise perspective for Mexico's OTT video market. In the next subsection this data analysis tool is explained in detail.
2.1 Hierarchical clustering
7
and data. Furthermore, the analysis requires to specify a distance measure between observations. Since all our variables are continuous we use the Euclidean distance between the variables:
𝑑𝑖𝑗 = √(𝑥𝑖1− 𝑥𝑗1) 2
+ ⋯ + (𝑥𝑖𝑝− 𝑥𝑗𝑝) 2
As it was aforementioned the agglomeration methods used in this article are centroid, complete and ward, which are detailed below (A, B and C refer to different groups of points):
Complete linkage or farthest neighbor method. In this case the distance between the two new clusters
is the greatest of the distances between groups before merging.
𝑑(𝐶, 𝐴𝐵) = 𝑚𝑎𝑥(𝑑(𝐶, 𝐴), 𝑑(𝐶, 𝐵))
Centroid method. In this case the distance between two groups is equal to the Euclidean distance
from the mean of the observations belonging to each group.
𝑑(𝐶, 𝐴𝐵)2= 𝑛𝑎
𝑛𝑎+ 𝑛𝑏
𝑑(𝐶, 𝐴)2+ 𝑛𝑏
𝑛𝑎+ 𝑛𝑏
𝑑(𝐶, 𝐵)2− 𝑛𝑎𝑛𝑏
(𝑛𝑎+ 𝑛𝑏)2
𝑑(𝐴, 𝐵)2
Ward method. All possible pairs of clusters are combined and the sum of the squared distances within each cluster is calculated. This is then summed over all clusters and minimized. The combination that gives the lowest sum of squares is chosen.
3 Data
In this paper we use a dataset of 19 countries for a four-year period, 2012 to 2015. The source of data is OVUM Knowledge Center5, a telecom and media consulting. The variables considered for our multivariate
5
8
cluster analysis approach are OTT video total revenues by type of content segment (movies, TV and other) and total active devices (fixed, portable and mobile) (see Table 1). Due to data restrictions the countries considered are: Brazil, Canada, China, France, Germany, India, Indonesia, Italy, Japan, Mexico, Nigeria, Russia, Saudi Arabia, South Africa, South Korea, Spain, Turkey, United Kingdom and USA. The units for OTT video revenues are in millions US Dlls, while total active devices are in millions. In Table 2 we can observe the moments of our sample.
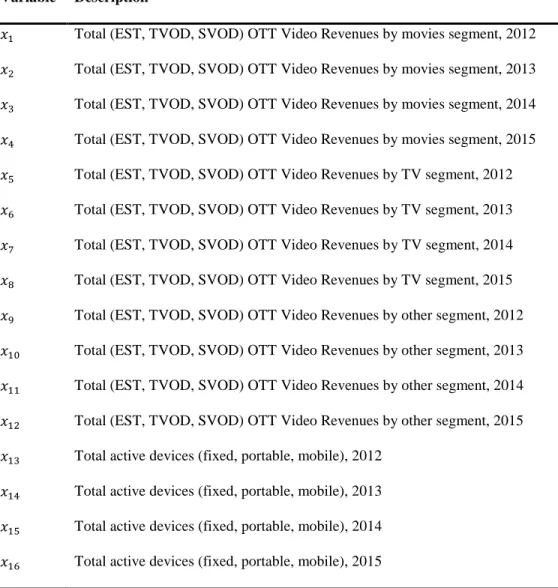
Table 1. Variables* Variable Description
𝑥1 Total (EST, TVOD, SVOD) OTT Video Revenues by movies segment, 2012
𝑥2 Total (EST, TVOD, SVOD) OTT Video Revenues by movies segment, 2013
𝑥3 Total (EST, TVOD, SVOD) OTT Video Revenues by movies segment, 2014
𝑥4 Total (EST, TVOD, SVOD) OTT Video Revenues by movies segment, 2015
𝑥5 Total (EST, TVOD, SVOD) OTT Video Revenues by TV segment, 2012
𝑥6 Total (EST, TVOD, SVOD) OTT Video Revenues by TV segment, 2013
𝑥7 Total (EST, TVOD, SVOD) OTT Video Revenues by TV segment, 2014
𝑥8 Total (EST, TVOD, SVOD) OTT Video Revenues by TV segment, 2015
𝑥9 Total (EST, TVOD, SVOD) OTT Video Revenues by other segment, 2012
𝑥10 Total (EST, TVOD, SVOD) OTT Video Revenues by other segment, 2013
𝑥11 Total (EST, TVOD, SVOD) OTT Video Revenues by other segment, 2014
𝑥12 Total (EST, TVOD, SVOD) OTT Video Revenues by other segment, 2015
𝑥13 Total active devices (fixed, portable, mobile), 2012
𝑥14 Total active devices (fixed, portable, mobile), 2013
𝑥15 Total active devices (fixed, portable, mobile), 2014
𝑥16 Total active devices (fixed, portable, mobile), 2015
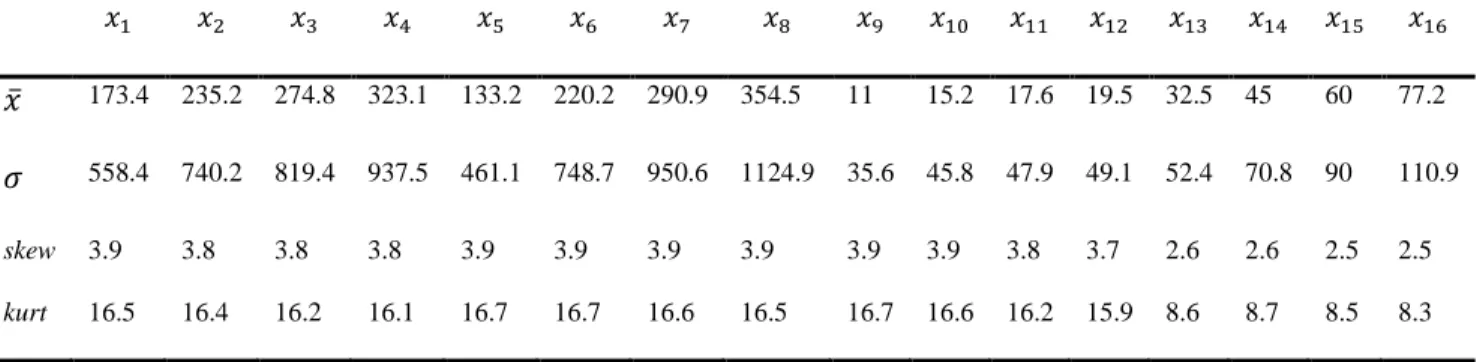
9 Table 2. Moments of the sample
𝑥1 𝑥2 𝑥3 𝑥4 𝑥5 𝑥6 𝑥7 𝑥8 𝑥9 𝑥10 𝑥11 𝑥12 𝑥13 𝑥14 𝑥15 𝑥16
𝑥̅
173.4 235.2 274.8 323.1 133.2 220.2 290.9 354.5 11 15.2 17.6 19.5 32.5 45 60 77.2𝜎
558.4 740.2 819.4 937.5 461.1 748.7 950.6 1124.9 35.6 45.8 47.9 49.1 52.4 70.8 90 110.9skew 3.9 3.8 3.8 3.8 3.9 3.9 3.9 3.9 3.9 3.9 3.8 3.7 2.6 2.6 2.5 2.5
kurt 16.5 16.4 16.2 16.1 16.7 16.7 16.6 16.5 16.7 16.6 16.2 15.9 8.6 8.7 8.5 8.3
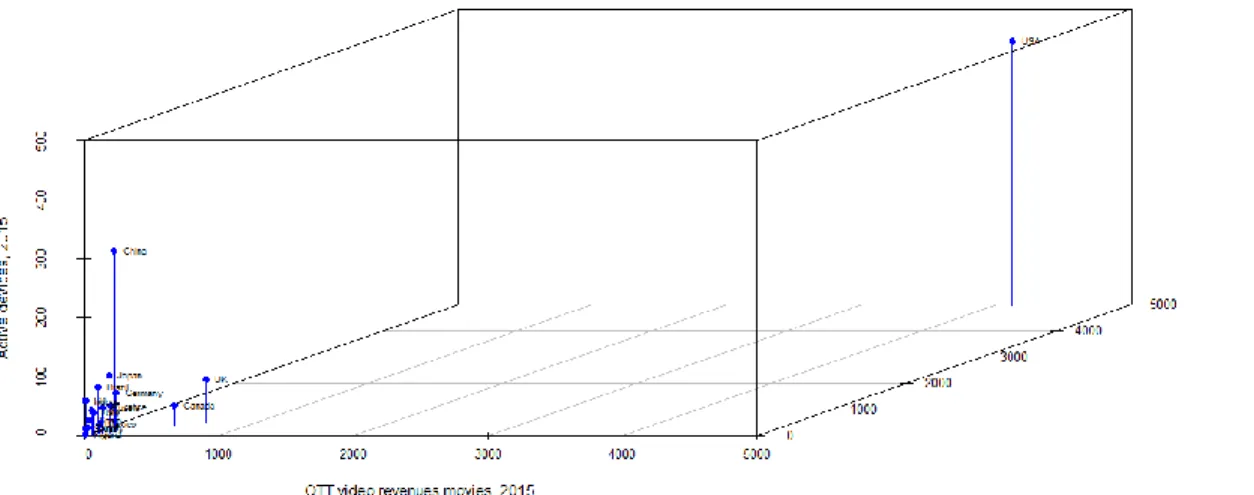
10
Fig. 3 Three dimensions scatter plot. Total OTT digital video revenues by content segment (movies and TV) and active devices in year 2015
4 Results
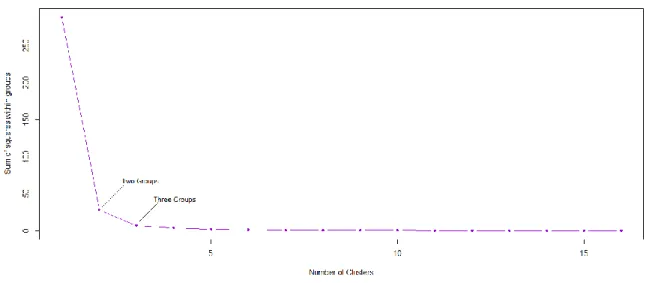
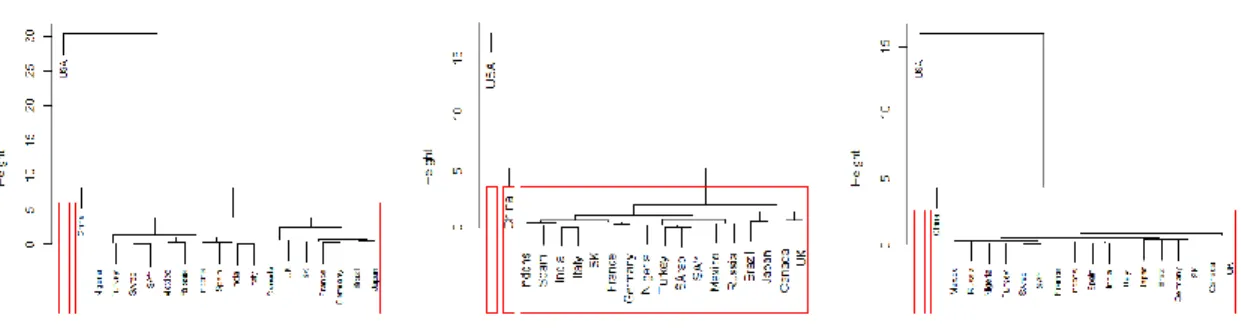
In a first step we preprocess our dataset. For that purpose we scale the data by applying scale() function in R program6. The process subtracts from each vector its mean and then divide it by its standard deviation. Then, in order to decide the number of clusters for our analysis we make a scree plot of the within groups sum of squares7 by the number of clusters. The premise consists on trying to find a bend in the plot to identify the number of clusters [8, 11]. Thus, our scree plot (see Fig. 4) suggests between two or three groups for our standardized data set. In our opinion three groups seem to be an appropiate measure of similarity grouping; however, we also obtain results for two and four groups (see Table 3). In all cases the United States of America is a singleton as a consecuence of its very highOTT penetration and a great consumption of contents with respect to the rest of countries. The different agglomeration methods (Centroid, Complete and Ward) of the cluster analysis place China in its own group; while the rest of countries, including Mexico, are in the third group when we take three clusters (𝐺3). With respect to Mexico's OTT video market it seems to have some resemblances with Russian market given that they are always placed in the same branch for the different dendrograms (see Fig. 5). To a lesser extent, according to Ward method, Mexico's market seems to approach
6 The R Project for Statistical Computing: https://www.r-project.org/
7
𝑆𝑆𝑊 = ∑
∑
∑
(𝑥
𝑖𝑗𝑔
− 𝑥̅
𝑗𝑔)
𝑛𝑔𝑖=1 𝑝 𝑗=1 𝐺
𝑔=1
,
where 𝑥𝑖𝑗𝑔 is the j-th variable in the i-th item of the g-th group;𝑥
̅𝑗𝑔11
to those of Indonesia, Spain, India and Italy. Finally, the other two methods (Complete and Centroid) express that Mexico's market is more comparable to those of emerging countries such as Nigeria, Turkey, South Africa and Saudi Arabia.
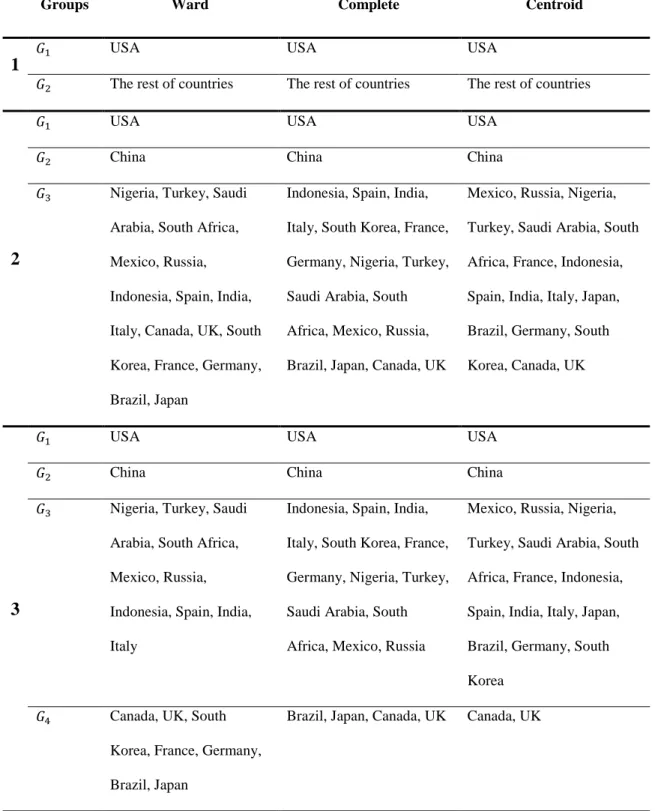
On the other hand, increase the number of groups is a double-edge sword since it can result in smaller error function values, but also in an increasing risk of overfitting. Nonetheless, we include four clusters in our analysis obtaining different results for each agglomeration method (see Table 3). In Ward method 𝐺4 is defined by developed countries such as Canada, France, Germany, Japan, South Korea and United Kingdom; and an emerging economy, Brazil. Mexico is in the same group as Spain, India, Italy, Turkey and Russia. The case of Brazil is special since this country has generally lower OTT video revenues than Mexico's market (e.g. OTT video revenues by movies segment in year 2015: Brazil, US$52.50 millions; Mexico, US$58.97 millions), however its number of active OTT devices is much larger than Mexico’s total (e.g. total active devices in year 2015: Brazil, 78.82 millions; Mexico, 15.37 millions). Therefore, we can conclude than Brazil is more a sort of outlier than a regional comparable country to Mexico. For the case of Complete method, we find that France, Germany and South Korea are no longer grouped in 𝐺4, while Mexico remains in 𝐺3. Lastly, for Centroid method only Canada and the UK remain in 𝐺4; while the rest of countries are now in 𝐺3 group, including Mexico.
12
Table 3. Hierarchical clustering by type of agglomeration method
Groups Ward Complete Centroid
1
𝐺1 USA USA USA
𝐺2 The rest of countries The rest of countries The rest of countries
2
𝐺1 USA USA USA
𝐺2 China China China
𝐺3 Nigeria, Turkey, Saudi Arabia, South Africa, Mexico, Russia, Indonesia, Spain, India, Italy, Canada, UK, South Korea, France, Germany, Brazil, Japan
Indonesia, Spain, India, Italy, South Korea, France, Germany, Nigeria, Turkey, Saudi Arabia, South Africa, Mexico, Russia, Brazil, Japan, Canada, UK
Mexico, Russia, Nigeria, Turkey, Saudi Arabia, South Africa, France, Indonesia, Spain, India, Italy, Japan, Brazil, Germany, South Korea, Canada, UK
3
𝐺1 USA USA USA
𝐺2 China China China
𝐺3 Nigeria, Turkey, Saudi Arabia, South Africa, Mexico, Russia, Indonesia, Spain, India, Italy
Indonesia, Spain, India, Italy, South Korea, France, Germany, Nigeria, Turkey, Saudi Arabia, South Africa, Mexico, Russia
Mexico, Russia, Nigeria, Turkey, Saudi Arabia, South Africa, France, Indonesia, Spain, India, Italy, Japan, Brazil, Germany, South Korea
𝐺4 Canada, UK, South Korea, France, Germany, Brazil, Japan
13
Fig. 5 Dendrograms by agglomeration method: a) Left plot, Ward, b) Center plot, Complete and c) Right plot, Centroid.
Retaking the similarities between Mexico's OTT video market and the rest of countries considered in our sample, it is remarkable that it is comparable to the Russian OTT video market, being one of those with most growth potential over the next years. According to Pyramid Research´s OTT video report8 Russia ranks second just after China, in its OTT Video Market Attractiveness Index for emerging markets. Its sizeable broadband market and its state of the art infraestructure are considered as the main strengths of Russian OTT video market. Furthermore, in 2014 Russia's total OTT video revenues reached US $145 millions, figure that is expected to double (US $305 millions) by year 2019 (see Fig. 6). Regarding the number of subscriptions video on-demand (SVOD) it reached 2.5 millions in year 2014, while by year 2019 it would surpass the 5 millions of subscribers (see Fig. 6). Then, it is evident that OTT companies can exploit the potential benefits of a growing market such as Russian for coming years. In the case of Mexico we observe a positive trend in its OTT video TVOD revenues for the next years (see Fig. 7), specifically for electronic sell-through service (OTT EST), e.g. Apple iTunes, and digital rental or paid temporary access to on-demand content (TVOD). Thus, we can conclude that both markets follow a similar path, and both are considered as emerging markets with high perspectives in OTT video market.
8
OTT Video Market Attractiveness Index: Worldwide Country Rankings, Market Drivers and Positioning Strategies in
14
Fig. 6 a) Left graph, total OTT video revenues; b) Right graph, SVOD subscribers in Russia (from OVUM.
https://www.ovumkc.com/).
Fig. 7 Mexico total pay TV and OTT video TVOD revenues (source OVUM.
https://www.ovumkc.com/)
15
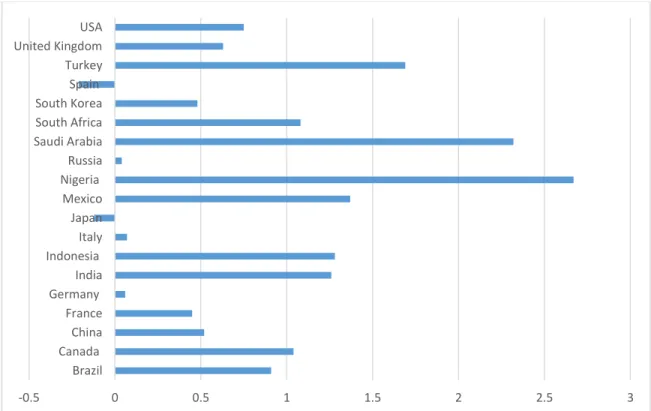
(CONAPO) proyections9 by year 2020 the age group between 15 and 64 years old would approximately represent the 66% of Mexico's total population. This percentage is greater than the existing on year 2010 (65.5%). Then, the potential number of OTT video content users would represent a considerable share of the total population. Thus, we can conclude that Mexico's OTT video market shows an optimistic perspective for the future by bearing some resemblance to other potential OTT markets and by expecting a positive growth rate of its population by age group.
Fig8 Population Growth Rate 2010-2015 (Source: UN World Population Prospects, the 2015 revision)
5 Regulation Considerations for OTT services
9
Informe de ejecución. Programa de Acción de la Conferencia Internacional sobre la Población y el Desarrollo 1994-2009. CIPD + 15. http://www.conapo.gob.mx/
-0.5 0 0.5 1 1.5 2 2.5 3
Brazil Canada
China France Germany
India Indonesia
Italy Japan Mexico Nigeria
16
The fact that Mexican OTT video market shows similarities to other international emerging markets is relevant in order to obtain a glimpse into future performance expectations of the industry and the applications of possible regulation scenarios.
A worldwide perspective about OTT services refers to the imbalanced ecosystem generated by them through
the limitation or elimination of security and privacy of the end users. One of the main discussions is about
net neutrality and the effects of its regulation on investment incentives for
ISPs. ISPs are having to invest massively in higher and higher capacity infrastructure to meet the demand
generated by OTT services. The fact that ISPs are not yet able to charge a cost to OTT companies derived of
traffic priorizations is creating a lot of controversy. Another main issue is about tax collection and the
complications derived from the nature of OTT companies as global entities which are able to explote transfer
pricing advantages in order to allocate profits in countries with lower tax rates.
There is a trend in the market toward a vertical integration between ISPs and OTT services which must be taken into consideration by the Mexican telecomm regulator if it decides to implement a regulation. In that respect we consider that it would be the prevailing scenario in between operators and OTT in video market.
6 Conclusions
17
it has been ranked as the second most attractive emerging market in the world10 and it is expected to sum total revenues of US $305 millions by year 2019. Then, it is clear that Russian market is a promising hot spot for worldwide OTT video market. Even though Latin America region still exhibits low broadband penetration levels with respect to developed countries [9], the facts indicate that Mexico's OTT video market closely resembles to promising OTT video markets. Furthermore, the diffusion of OTT's services in Mexico is benefited by an increase in the number of active devices and by a positive population growth rate, especially in the case of age groups considered as potentital OTT video content users.
Thus, the Mexican regulator must consider that OTT video market has developed so well up to now without any regulation and in some way it is comparable to main emerging international OTT markets. Furthermore, it must considers the fact that ISPs are starting to recognize the relevance of OTT services by vertically integrating with OTT services. Also, it should be pointed out the risks of an excessive regulation which could avoid the appearance and development of new applications or added value services. Then, from regulator’s perspective it is a double-edge sword that should be taken into account.
References
1. Baccarne, B., Evens, T. & Schuurman, D. (2013). The television struggle: an assessment of Over-the-Top television evolutions in a cable dominant market. Digiworld Economic Journal, no. 92, p. 43.
www.comstrat.org
2. Barkhuus, L. (2009) Television on the Internet: New Practices, New Viewers. CHI 2009, Boston, MA, USA.
3. Chavin, J., Ginwala, A. & Spear, M. (2012). The future of mobile messaging: Over-the-top competitors threaten SMS. Telecom, Media & High Tech Extranet. Retrieved March 29, 2014. McKinsey & Company Telecom.
10
OTT Video Market Attractiveness Index: Worldwide Country Rankings, Market Drivers and Positioning Strategies in
18
4. Dargue, M. & Wadsworth, W. (2013). Over the top. Operator threat and opportunity. www.cartesian.com. Accessed 11 November 2015.
5. Friedrich, R.; Bartlett, C.; Groene, F. & Mialaret, N. (2013). Enabling the OTT revolution. How telecom operators can stake their claim. Booz & Company. http://www.strategyand.pwc.com/reports/enabling-ott-revolution. Accessed 09 November 2015.
6. Ganuza, J., Viecens, M (2014). Over-the-top (OTT) content: implications and best response strategies of traditional telecom operators. Evidence from Latin America. Info: the Journal of Policy, Regulation and Strategy for Telecommunications, Information and Media 16.5: 69-59.
7. Husson, F., Josse, J. & Pagès, J. Principal Component methods - hierarchical clustering – partitional clustering: why would we need to choose for visualizing data? Technical Report of the Applied Mathematics Department (Agrocampus). http://www.agrocampus-ouest.fr/math/
8. Johnson, R. A., and Wichern, D. W. (2007). Applied Multivariate Statistical Analysis. 6th ed. Englewood Cliffs, NJ. Prentice Hall.
9. Katz, R. (2009). Estimating Broadband Demand and its Economic Impact in Latin America. Proceedings
of the 3rd ACORN-REDECOM Conference Mexico City.
http://unpan1.un.org/intradoc/groups/public/documents/gaid/unpan036761.pdf
10. Manly, B.F.J. (2005), Multivariate Statistical Methods: A primer. Third edition, Chapman and Hall. 11. Rencher, A. C., and W. F. Christensen (2012). Methods of Multivariate Analysis. 3rd ed. Hoboken, NJ.
Wiley.
12. Seppänen, J & Varela, M (2013). QoE-driven Network Management for Real-Time Over-the-top Multimedia Services. In: IEEE wireless communications and networking conference (WCNC), IEEE, Shanghai,China.http://ieeexplore.ieee.org/xpl/login.jsp?tp=&arnumber=6554806&url=http%3A%2F% 2Fieeexplore.ieee.org%2Fxpls%2Fabs_all.jsp%3Farn