Implementación de un conformador de haz tipo delay-and-sum sobre un dispositivo FPGA
Texto completo
Figure


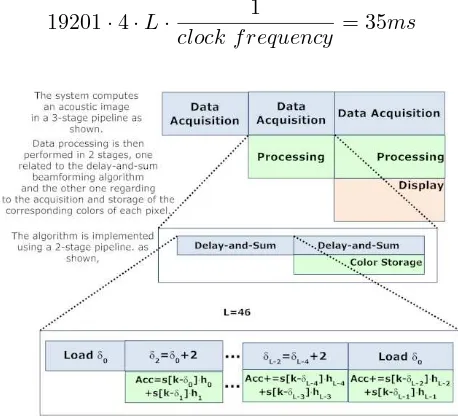
![Figure 3.1: Implementation of the beamforming algorithm. sprocessed. Oncecorresponding channel n of the ADC,n[k] are the sampled data obtained from the δ0i is the delay that indexes over the buffer the datum that has to be s(p)[k] is obtained, it is multiplied by the corresponding hi coefficient of the filter and thenaccumulated until i=L-2, when the 9 most significant bits address the corresponding color in the colorlook-up table to store it in an external double buffer.](https://thumb-us.123doks.com/thumbv2/123dok_es/4277012.29458/11.612.100.547.274.439/implementation-beamforming-oncecorresponding-corresponding-coecient-thenaccumulated-signicant-corresponding.webp)


Documento similar
• After analyzing the background and continuous sound levels in the Port of Cartagena, it was found that impulsive sound must have a level above approximately 70 dB re 1 µPa to be
In this paper, the acoustic emission method was applied to determine the active presence of xylophages in two different types of test: in situ tests carried out on the wooden beams
It provides a flat-field source for the science instrument used with NAOMI and a tip-tilt injection facility to test the performance and general ‘health’ of the adaptive
In the previous sections we have shown how astronomical alignments and solar hierophanies – with a common interest in the solstices − were substantiated in the
Instrument Stability is a Key Challenge to measuring the Largest Angular Scales. White noise of photon limited detector
Figure 6 shows the same normalized intensity as Figure 5 but only for the horizontal segment edges, with measurements of the phasing subaperture on the segment center and shift left
From the measurement results in the vertical arrangement it can be concluded that the ceiling-floor system of the prototype modules reaches a good level of airborne and impact
The LR’s in the case of the KDF are produced from the Same Source (SS) and Different Source (DS) score distributions (examples are shown in the Figure 1)
