Revista Mexicana de Ingeniería Biomédica • volumen XXVII • número 2 • Diciembre 2006 68
edigraphic.com
ARTÍCULO DE INVESTIGACIÓN ORIGINALSOMIB
REVISTA MEXICANA DE INGENIERÍA BIOMÉDICA
Vol. XXVII, Núm. 2 Diciembre 2006 pp 68 - 73
A B S T R A C T A B S T R A C TA B S T R A C T A B S T R A C T A B S T R A C T
Laser Induced Fluorescence Spectroscopy (LIFS) is a technique that has been recently used to detect in vivo or in vitro cancer. The LIFS system has been used to analyze cervical tissue samples for histolog-ical evaluation. Because the fluorescence spectra are position and inter-probe dependent (albeit they were equally classified by histo-logical evaluation) the relationship that exists in the data is complex. So, a back-propagation Artificial Neural Network is used to detect the relationships contained within them. The validation of the system was done with 5 different proves and a 100% classification coincidence between the neural network classification and a normal histological one was obtained. The LIFS-System works with a N2 laser of 5 µJ pulse energy (tFWHM = 3.8 ns at 337.1 nm wavelength) and spectra from 350 to 650 nm were processed and evaluated in a PC.
Key Words: Key Words:Key Words: Key Words:Key Words:
Laser induced fluorescence, Cervical cancer and neural network.
R E S U M E N R E S U M E NR E S U M E N R E S U M E NR E S U M E N
La espectroscopia de inducción de fluorescencia con láser (LIFS) es una técnica recientemente usada para detectar cáncer in vivo o in vitro. En este trabajo se usa esta técnica para analizar y diagnosticar muestras de tejido cervical preparadas para su evaluación histológi-ca. Debido a que los espectros de fluorescencia son muestra a mues-tra y punto a punto diferentes (a pesar de ser clasificados como iguales por medio de su evaluación histológica) no resulta simple determinar las relaciones básicas de los datos medidos. Por lo cual se usa una red neuronal artificial del tipo “back-propagation” para detectar estas relaciones. La validación del sistema se realizó con 5 diferentes muestras y se obtuvo una coincidencia del 100% entre la clasificación realizada por ésta y la realizada por el proceso his-tológico normal. El sistema LIFS trabaja con pulsos de 5 µJ (tFWHM = 3.8ns a 227.1nm) provenientes de un láser de N2 y los espectros de 350 a 650 nm fueron procesados y evaluados en una computadora personal.
Palabras clave: Palabras clave:Palabras clave: Palabras clave:Palabras clave:
Fluorescencia inducida con luz láser, cáncer cervicouterino y redes neu-ronales.
Evaluation of healthy and infected cervical tissue
using a LIFS system and a back-propagation neural
network
Aparicio Castillo A.,* De La Rosa Vázquez J.M.,* Calva Chavarría P.A.,* Franco López E.B.,* Torres Manzo R.,* Álvarez Dorantes R.,* De La Rosa Gutiérrez G.,** Romero Guadarrama M.B.***
* Sección de Estudios de Postgrado e Investigación ESIMEZ-IPN, México D.F.
* * Escuela Superior de Medicina IPN, México D.F.
* * * Unidad de Patología del Hospital General de México. Facultad de Medicina-UNAM, Cd. Universitaria, México, D.F.
Correspondence:
José Manuel de la Rosa Vázquez, [email protected]
Artículo recibido: 1/septiembre/2006 Artículo aceptado: 6/diciembre/2006
edigraphic.com
SUSTRAÍDODE-M.E.D.I.G.R SUSTRAÍDODE-M.E.D.I.G.R SUSTRAÍDODE-M.E.D.I.G.R SUSTRAÍDODE-M.E.D.I.G.R
SUSTRAÍDODE-M.E.D.I.G.R.A.P.A.P.A.P.A.P.A.P.H.H.H.H.H.I.C.I.C.I.C.I.C.I.C
:ROP ODAROBALE FDP :ROP ODAROBALE FDP :ROP ODAROBALE FDP :ROP ODAROBALE FDP :ROP ODAROBALE FDP
VC ED AS, CIDEMIHP VC ED AS, CIDEMIHP VC ED AS, CIDEMIHP VC ED AS, CIDEMIHP VC ED AS, CIDEMIHPARGARGARGARGARG
ARAP ARAP ARAP ARAP ARAP
A AA
AACIDÉMOIB ARUTCIDÉMOIB ARUTCIDÉMOIB ARUTCIDÉMOIB ARUTCIDÉMOIB ARUTARETIL :CIHPARETIL :CIHPARETIL :CIHPARETIL :CIHPARETIL :CIHPARGIDEMARGIDEMARGIDEMARGIDEMARGIDEM
mon cancer in women even though widespread use of Pap smear and colposcopy programs are currently in place. In agreement to data existing the mortality in 2002 reaches 5,777 and in the same period approximately 12,516 new cases of cervi-cal cancer were reported3. The Pap smear is un-able to achieve a concurrently high sensitivity (the correct classification percentage on the precan-cerous tissue samples) and high specificity (the correct classification percentage on normal tissue samples). The accuracy of the Pap smear is limited by both sampling and reading errors. Approximate-ly 60% of false negative smears are attributed to insufficient sampling; the remaining 40% are due to reading errors4. Colposcopy examination in pert hands maintains a high sensitivity at the ex-pense of a significantly low specificity, leading to many unnecessary biopsies5. Biopsy followed by histology is the gold standard for definitive diagno-sis of cancer, but a major drawback of this approach is that the diagnosis requires expert interpretation of the microscopically derived histopathological information and is prone to human errors6.
Laser Induced Fluorescence Spectroscopy (LIFS) has the potential to improve the efficacy of cervi-cal precancerous detection7. This technique has the capability to probe the biochemical and morpho-logical changes that occur as tissue becomes neo-plastic, through the spectral characteristics of the measured fluorescence. In this work, we perform preliminary testing on cervix tissue biopsies in order to develop a LIFS-system for the in vivo detection of precancerous state and cancer. The spectral infor-mation is correlated to tissue histopathology diag-nosis through a back propagation neural network which is implemented in software in a PC. The sys-tem is fully automated in order to be handled by no experts. This spectroscopic approach may also pro-vide an alternate biopsy diagnostic modality in clin-ical pathology setting.
MATERIALS AND METHODS
The cervical tissue samples from patients after re-section at surgery were placed in 10% formalde-hyde during 24 hours at room temperature and then embedded in paraffin for slicing. Sections of 4 µm were sliced for the microscope slide preparation. A standard hematoxylin and eosin protocol to stain the tissue samples was used. The study involved 15
tis-ing set of an artificial neural network to classify them in five different cases and 5 tissue samples were used as a validation of the neural network. All samples were between three and four years old.
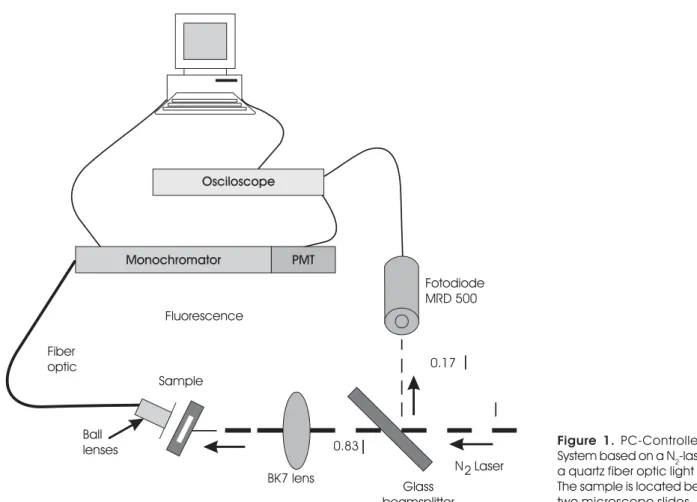
The Figure 1 shows the experimental arrangement. A home made Blumlein N2 Laser, 5 µJ, 250 W peak, at 337.1 nm (∆λFWHM = 2.6 nm, ∆tFWHM = 3.8 ns) op-erated at 70 mbar N2 is enough in all the measure-ments. A glass beamsplitter (a microscope slide) and a Motorola MRD500 photodiode were used to mon-itor the laser light and to trigger the detection sys-tem. The measured reflectance of the slide is 17%. A rectangular (1.7 mm x 0.9 mm) spot at the sam-ple is obtained with a 2.54 cm diameter BK7 glass lens (15 cm focal length).
The cervix tissue samples (located between two microscope slides) were irradiated at 45º and the fluorescence was measured perpendicularly to the reverse side of the sample. In order to achieve a large signal, two BK7 ball lens (10 mm diameter, E32748, from Edmund Industrial Optics) forming a fiber coupler, were used. A E38956 quartz fiber op-tic light guide (6.2 mm core diameter, 91.4 cm length) from Edmund Industrial Optics was used to transmit the collected fluorescence to a 0.27 m Digital Scan-ning Monochromator (Spectra Pro 275 from Acton Research Co.), where the fluorescence is analyzed and measured by a Hamamatsu H957-08 PMT (Pho-to Multiplier Tube) module. The laser reference and scattered fluorescence pulses are registered by a digital oscilloscope.
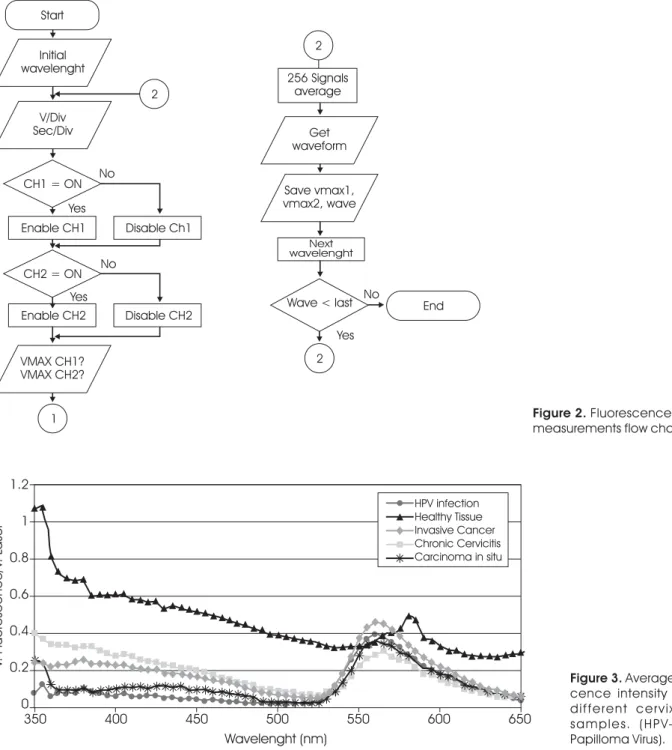
PC is used to control the operation of the mono-chromatic and to save the signals measured by the oscilloscope through a GPIB interface. The Figure 2 shows the flow chart to obtain the fluorescence spectra. The average of 256 pulses is given by the oscilloscope every 5 nm from 350 to 650 nm. The peak value of the fluorescence intensity Ië at each selected wavelength, using a National Instrument Data Acquisition LAB PC-1200 board, is stored in the PC. All these values are processed by an specific software to eliminate noise, to consider laser pulse variations and to graphic the spectra in different ways. The software was developed in a Lab-View (Ver. 6) graphic programming package.
RESULTS AND DISCUSSION
edigraphic.com
paper at 337.1 nm wavelength8 and shows a re-sponse time of 2 ns (given by the PMT). Fluorescence lifetimes in the order of 9 ns, which are in the order of the fluorescence lifetimes of human tissue9, were measured.
The Figure 3 shows the average fluorescence intensity versus the wavelength from 10 different places each sample. The fluorescence of the healthy tissue sample is higher than the fluores-cence of the others in the bands from 350 to 540 nm and from 575 to 650 nm, and that could be a criterion to separate malignant and non-malignant tissues. For 320 nm excitation some authors10 have proposed to use only the ratio of the fluorescence intensities at 383 nm and 460 nm to classify malignant and non-malignant tis-sues for in-vitro cervical tissue obtaining a 33% of false negative diagnoses.
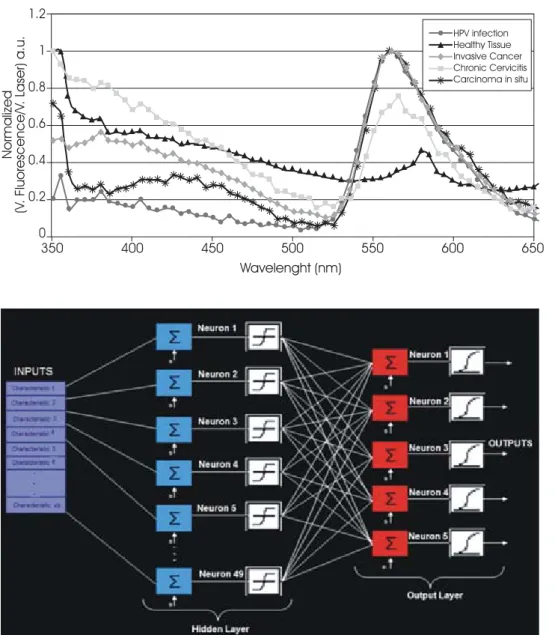
In order to compare all the intensity values of the fluorescence spectra in each tissue, the spectra in Figure 3 are normalized assigning the value of 1 to the maximal fluorescence intensity for each sam-ple, see Figure 4. From (Figure 4) the differences
between all fluorescence patterns are evident. For example, the maxima of HPV infection, invasive cancer and carcinoma in-situ spectra take place at around 560 nm, but they have different values be-tween 350 to 500 nm. On the other hand, the max-ima of healthy tissue and chronic cervicitis spectra takes place at 350 nm, but they have different val-ues between 550 to 600 nm.
Multivariate statistical algorithms and neural net-work based algorithms have been successfully used to discriminate from between fluorescence spectra
in vivo squamous (precancerous state) or non squa-mous intra epithelial lesions4. Here we propose the use of all the measured spectral intensities (49 per spectra), using a neural network, to classify the five tissue cases.
AUTOMATIC DIAGNOSES
A neural network is a good option to represent a complex relationship between any number of input parameters (like the ones presented in Figures 3 and 4) and an outcome of interest. The fact that an
edigraphic.com
SUSTRAÍDODE-M.E.D.I.G.R SUSTRAÍDODE-M.E.D.I.G.R SUSTRAÍDODE-M.E.D.I.G.R SUSTRAÍDODE-M.E.D.I.G.R
SUSTRAÍDODE-M.E.D.I.G.R.A.P.A.P.A.P.A.P.A.P.H.H.H.H.H.I.C.I.C.I.C.I.C.I.C
:ROP ODAROBALE FDP :ROP ODAROBALE FDP :ROP ODAROBALE FDP :ROP ODAROBALE FDP :ROP ODAROBALE FDP
VC ED AS, CIDEMIHP VC ED AS, CIDEMIHP VC ED AS, CIDEMIHP VC ED AS, CIDEMIHP VC ED AS, CIDEMIHPARGARGARGARGARG
ARAP ARAP ARAP ARAP ARAP
A AA
AACIDÉMOIB ARUTCIDÉMOIB ARUTCIDÉMOIB ARUTCIDÉMOIB ARUTCIDÉMOIB ARUTARETIL :CIHPARETIL :CIHPARETIL :CIHPARETIL :CIHPARETIL :CIHPARGIDEMARGIDEMARGIDEMARGIDEMARGIDEM
ficial neural network is largely independent of as-sumptions regarding the statistical distributions relat-ing to the data makes them more reliant on large quantities of data11. Following the neural network theory12-14 we propose two layers (with tansig and logsig transfer functions for the hidden and output layers) of adaptive weights network in a feed-forward diagram, see Figure 5. We consider 49 inputs, one for each (Iλ, λ) measurement (spectra from 410 to
650 nm), 49 hidden units and 5 outputs (one for each tissue classification in Figure 3). A fixed activation point b was used.
In our network each input site is connected to only one hidden unit through an associated weight wi,i (where i = 1, ….., 49 is the number of the input point). The hidden layer is connected to the output layer through the associated weights wi,j (where j = 1,…, 5 is the number of the output unit). The
net-Figure 2. Fluorescence spectra measurements flow chart.
wavelenght
V/Div Sec/Div
2
CH1 = ON No
Yes
Enable CH1
CH2 = ON No
Yes Enable CH2
Disable Ch1
Disable CH2
VMAX CH1? VMAX CH2?
1
256 Signals average
Get waveform
Save vmax1, vmax2, wave
Next wavelenght
Wave < last No
Yes
2
End
Figure 3. Average fluores-cence intensity spectra different cervix tissue samples. (HPV-Human Papilloma Virus).
1.2
1
0.8
0.6
0.4
0.2
0
V.
Fluorescence/V
.
Laser
350 400 450 500 550 600 650
Wavelenght (nm)
edigraphic.com
work starts with randomly proposed connection weights.
When an input spectra (Iλ, λ from Figure 4) is pre-sented to this network a different diagnoses from the histological one results. A back-propagation learn-ing algorithm is used to match both diagnoses. It minimizes the error function by changing all the con-nection weights. To find the initial weight values and the activation point b, the neural network was trained in Matlab with two tissue samples (each a histologi-cal diagnosed one). No pattern generalization prob-lem was presented after 7,000 epochs. The com-plete code can be consulted elsewhere15.
After minimizing the error function for the training set (finding the best weights) the input spectra of the validation set were presented to the network in
order to recognize if these were similar to the learned spectra and produce a similar output. The neural network output layer produces only one value and the tissue classification is assessed as follows: Carci-noma in situ (0.98 ± 0.03); Healthy (0.3 ± 0.03); Chronic cervicitis (0.5 ± 0.03); Invasive cancer (0.7 ± 0.03); HPV infection (0.9 ± 0.03). When the val-ue is out of these intervals the tissval-ue is not classified. A 100% classification coincidence of the validation set data was obtained.
CONCLUSIONS
We have presented a time resolved N2-laser induced fluorescence system that allows the measurement of cervical biopsies and diagnose healthy or
can-Figure 4. Fluorescence patterns different cervix tissue samples. Here the peak value each spectra in Figure 2 have been nor-malized to 1.
1.2
1
0.8
0.6
0.4
0.2
0
Normalized
(V
.
Fluorescence/V
.
Laser)
a
.u
.
350 400 450 500 550 600 650
Wavelenght (nm)
HPV infection Healthy Tissue Invasive Cancer Chronic Cervicitis Carcinoma in situ
edigraphic.com
SUSTRAÍDODE-M.E.D.I.G.R SUSTRAÍDODE-M.E.D.I.G.R SUSTRAÍDODE-M.E.D.I.G.R SUSTRAÍDODE-M.E.D.I.G.R
SUSTRAÍDODE-M.E.D.I.G.R.A.P.A.P.A.P.A.P.A.P.H.H.H.H.H.I.C.I.C.I.C.I.C.I.C
:ROP ODAROBALE FDP :ROP ODAROBALE FDP :ROP ODAROBALE FDP :ROP ODAROBALE FDP :ROP ODAROBALE FDP
VC ED AS, CIDEMIHP VC ED AS, CIDEMIHP VC ED AS, CIDEMIHP VC ED AS, CIDEMIHP VC ED AS, CIDEMIHPARGARGARGARGARG
ARAP ARAP ARAP ARAP ARAP
A AA
AACIDÉMOIB ARUTCIDÉMOIB ARUTCIDÉMOIB ARUTCIDÉMOIB ARUTCIDÉMOIB ARUTARETIL :CIHPARETIL :CIHPARETIL :CIHPARETIL :CIHPARETIL :CIHPARGIDEMARGIDEMARGIDEMARGIDEMARGIDEM
ral network is used to process the spectra and clas-sify the tissue in five different classes. Fifteen three to four year old pathologically classified healthy and ill cervix tissue which were prepared for histological evaluation in microscope slides were used in our in-vestigation. Measured spectra were used to train a back propagation neural network, which yields then automatic diagnoses. The validation of the system was done with 5 different samples and a 100% co-incidence between the neural network classification and the normal histological one has been obtained. So, the LIF spectroscopy approach may provide an alternative diagnostic modality in clinical pathology setting.
In order to reduce the measurement time from 20 minutes to the order of seconds, we are plan-ning to use a UV-VIS-CCD based spectrometer. Also, the implementation of a reflection backscattering fiber optic light guide will allow us in vitro and in vivo
diagnoses.
BIBLIOGRAPHY
1. Secretaría de Salud. México. Epidemiología 2006; 1(23): 1-7.
2. Lazcano-Ponce E, Herrero R, Muñoz N, Cruz A, Shah KVK, Alonso P, Hernández P, Salmerón J, Hernández M. Epide-miology of HPV infection among Mexican women with normal cervical cytology. International Journal of Can-cer 2001; 91(3): 412-420.
sembles of radial basis function networks for spectro-scopic detection of cervical precancer. IEEE Transac-tions of Biomedical Engineering 1998; 45(8): 953-961. 5. Mitchell MF. Accuracy of colposcopy. Clinical
consulta-tions in obstetrics and gynecology. 1994; 6(1): 70-73. 6. Majumder SK, Kumar R, Gosh NP, Gupta PK. Cancer
diag-nosis using N2 laser excited autofluorescence spectros-copy of formalin-fixed human tissue” Conference Pro-ceedings of Photonics 2004. http://eel.inst.ac.ir/Sadr/ Papers/bio4.pdf
7. Briokner CJ, Follen M, Boiko I, Galvan J, Thomsen S, Malpica A, Suzuki S, Lotan R, Richards-Kortum R. Autof-luorescence patterns in short-term cultures of normal cervical tissue. Photochemistry and Photobiology 2000; 71(6): 730-736.
8. De la Rosa J, Bautista FJ. Optical properties of paper at 337.1 nm. Revista Mexicana de Física 2005; 51(1): 110-113.
9. Fang Q, Papaioannou T, Jo JA, Vaitha R, Shastry RK, Mar-cu L. Time-domain laser-induced fluorescence spectros-copy apparatus for clinical diagnostics. Review of Scien-tific Instruments 2004; 75(1): 151-162.
10. Glassman WS, Liu CH, Tang GC, Lubicz S, Alfano RR. Ultra-violet excited fluorescence spectra from non-malignant and malignant tissues of the gynecological tract. Lasers in the Life Sciences 1992; 5(1-2): 49-58.
11. Batuello TJ, Crawford ED. Artificial neural networks in prostate cancer. Lab. Medica International 2001; 18(3): 10-11.
12. Bishop CM. Neural networks for pattern recognition, Ox-ford University Press Inc., New York, 1995.
13. Hagan M, Demuth H, Beale M. Neural network design, PWS, Publishing Company, Boston, 1996.
14. Rojas R. Neural networks, a systematic introduction. Spring-er, Berlin, 1996.