ARTÍCULOORIGINAL Galván-Portillo MV y col.
(1) Mexico’s National Institute of Public Health. Cuernavaca, Morelos, México.
(2) Division of Environmental Health Science, Department of Community and Preventive Medicine, Mount Sinai School of Medicine. New York, NY, USA. (3) School of Medicine. National Autonomous University of Mexico. Cuernavaca, Morelos, México.
Received on: July 14, 2006 • Accepted on: October 13, 2006.
Address reprint request to: Dra. Lizbeth López Carrillo. Instituto Nacional de Salud Pública. Av. Universidad 655, col. Santa María Ahuacatitlán. 62508 Cuernavaca Morelos, México.
E-mail:lizbeth@insp.mx
Galván-Portillo MV, Wolff MS, Torres-Sánchez LE, López-Cervantes M, López-Carrillo L.
Estimación de la ingesta de fitoestrógenos en un grupo de mujeres mexicanas. Salud Publica Mex 2007;49:126-131.
Resumen
Objetivo
. Crear una base de datos con el contenido de
nueve fitoestrógenos (FIT) presentes en alimentos
mexica-nos y calcular su ingestión y reproducibilidad en 50 mujeres
participantes en un estudio de cohorte en México.
Mate-rial y métodos
. Los FIT seleccionados incluyeron flavonol
(FOL), flavones (FES), flavanol (FAL), secoisolariciresinol (SE),
matairesinol (MA), lariciresinol (LA), pinoresinol (PI), ácido
cinámico (CA) y coumestrol (CU). El contenido de estos
compuestos se obtuvo de cuatro diferentes fuentes de
da-tos. La ingestión diaria se estimó a través de un
cuestiona-rio de frecuencia de consumo de alimentos, aplicado en dos
oportunidades con una diferencia de un año a cada
parti-cipante. La reproducibilidad en el reporte de cada FIT se
estimó mediante coeficientes de correlación intraclase
ajus-tados por residuales de energía.
Resultados
. La media de
consumo de los FIT seleccionados varió de 1.3
±
0.8
µ
g/d
de MA hasta 116.3
±
43.8 mg/d de CA. La reproducibilidad
varió desde 0.17 para FAL hasta 0.47 para LA. Las
principa-les fuentes de FIT fueron frijoprincipa-les, naranja, salsa picante,
bró-coli, manzana y cebolla.
Discusión
. Este es el primer estudio
que calcula la ingestión de FIT en México y podría
consti-tuir una herramienta útil para la futura evaluación de su
efecto en la salud.
Palabras clave: ingesta de fitoestrógenos; población
mexica-na; reproducibilidad; Mexico
Galván-Portillo MV, Wolff MS, Torres-Sánchez LE, López-Cervantes M, López-Carrillo L. Assessing phytochemical intake in a group of Mexican women. Salud Publica Mex 2007;49:126-131.
Abstract
Objective
. Identify the content of selected
phytochemi-cals (PHYs) in Mexican foods and evaluate the reliability of
a food frequency questionnaire (FFQ) in assessing PHYs
intake among Mexican women.
Material and Methods
.
Values for PHYs content were obtained from four different
data sets. PHYs intake was assessed in 50 women of
repro-ductive age enrolled in a longitudinal cohort study. Values
were obtained from a FFQ administered twice, one year
apart in order to evaluate its reliability. Selected PHYs
in-cluded flavonol (FOL), flavones (FES), flavanol (FAL),
secoiso-lariciresinol (SE), matairesinol (MA), secoiso-lariciresinol (LA),
pinoresinol (PI), cynamic acid (CA) and coumestrol (CU).
Results
. Daily PHYs intake ranged from 1.3
µ
g
±
0.9 for MA
to 116.3
±
43.8 mg for CA. The adjusted correlation
coeffi-cients ranged from 0.17 for FAL to 0.47 for LA. Pinto beans,
oranges, hot sauce, broccoli, apples and onions were the main
sources of the selected PHYs daily intake.
Discussion
. The
results of this study contribute to our understanding of the
consumption of PHYs in the Mexican diet, and would help
evaluate their potential health impact.
Key words: phytochemical intake; Mexican populations;
reliability; México
Assessing phytochemical
intake in a group of Mexican women
Marcia V Galvan-Portillo, MSc,
(1)Mary S Wolff, PhD,
(2)Luisa E Torres-Sánchez, Dr PH,
(1)Malaquías López-Cervantes, PhD,
(3)Lizbeth López-Carrillo, Dr PH.
(1)P
hytochemicals (PHYs) are plant compounds with
estrogen-like activity. Epidemiological evidence
suggest that high ingestion of these compounds is
as-sociated with a decrease on the risk of breast,
1-4pros-tate,
2,5,6and gastric cancer,
7,8as well as cardiovascular
diseases,
4,9-11osteoporosis,
2,12-14and menopausal
symp-toms,
15-16Fruits and vegetables are an important source
of PHYs; however their consumption varies
through-out the world.
5,12,15In Latin American countries, the
energy intake from fruits and vegetables is
approximate-ly three times higher than in North America,
North-Central Europe and Asian countries.
17This variation in
phytochemical intake may explain differences in PHYs
related disease patterns. The lack of comprehensive
phy-tochemical composition food tables precludes the study
of their health impact, especially in developing
coun-tries. This study aims to identify the content of selected
PHYs in Mexican foods and evaluate the reliability of a
food frequency questionnaire in assessing PHYs intake
among women living in Mexico.
Material and Methods
Intake of selected PHYs was estimated in a sample of
50 women, aged between 17 and 37 years,
participat-ing in a longitudinal cohort study in the state of
More-los, Mexico from 2001-2002 that was approved by the
IRB of the Mexico National Institute of Public Health.
Eligible participants were pregnant and
non-lactating women, who reported no change in their diet
over the past 12 months and signed an informed
con-sent document. A more detailed description of the
study design is published elsewhere.*
Women were asked about their dietary habits, on
two different occasions using a standardized food
fre-quency questionnaire (FFQ).
18,19Trained personnel
completed the in-person interviews one year apart and
during the same season of the year. The frequency of
the consumption of foods that are sources of PHYs
(54/100 items included in the FFQ) was calculated
con-sidering a pre-determined portion size and 10
frequen-cy categories ranging from never to six times per day.
To determine PHYs intake, we developed a
data-base of nine selected PHYs present in the 54 foods
included in the FFQ. Selected PHYs included three
flavonoids (FLAV): flavonol (FOL), flavones (FES),
fla-vanol (FAL); four Lignans (LI): secoisolariciresinol (SE),
matairesinol (MA), lariciresinol (LA), pinoresinol (PI);
cinnamic acid (CA) and coumestrol (COU). Mean
val-ues of FOL, FES and FAL were imputed from the 2003
USDA flavonoid data set,
20while the 1998 Notice plus
data base
21was used as a source of CA and COU. Mean
values for SE, MA, LA and PI were also obtained from
published databases.
22,23The taxonomic name, genus
and species of vegetables were verified in the
imputa-tion process.
24PHYs contents in mg/100g and
µ
g/100g
referred to wet edible portions. If values of PHYs for
an individual food item were available from several
references, we calculated a mean value from the pool
of values. Non-vegetable sources of PHYs included
milk chocolate, jam, wine and beer. Recipes of local
dishes were also used to determine whether they
in-cluded ingredients that were sources of PHYs.
25The
Food Intake Analysis software, along with a program
written with Fox Pro v.9.0, was used to estimate the
individual intake of nutrients and PHYs of interest. A
detailed description of nutrient calculation is published
elsewhere.
26Descriptive statistics were calculated to assess the
characteristics of the study population. Energy
adjust-ed (by means of energy residuals) intra-class
correla-tion coefficients (
ρ
1) were calculated to evaluate the
reliability of the FFQ results. The main food sources of
selected PHYs intake were identified by partial R
2through estimated multiple linear regression models.
All analyses were performed using the statistical
soft-ware package STATA 7.0.
Results
General characteristics of the study population are
dis-played in Table I. The study sample included mostly
young (mean age 23.8 years), nulliparous (85.4%)
wom-en, with normal body mass index scores (23.7 kg/m
2).
Approximately half of the women had at least 12 years
of education and reported having a paid job. Table II
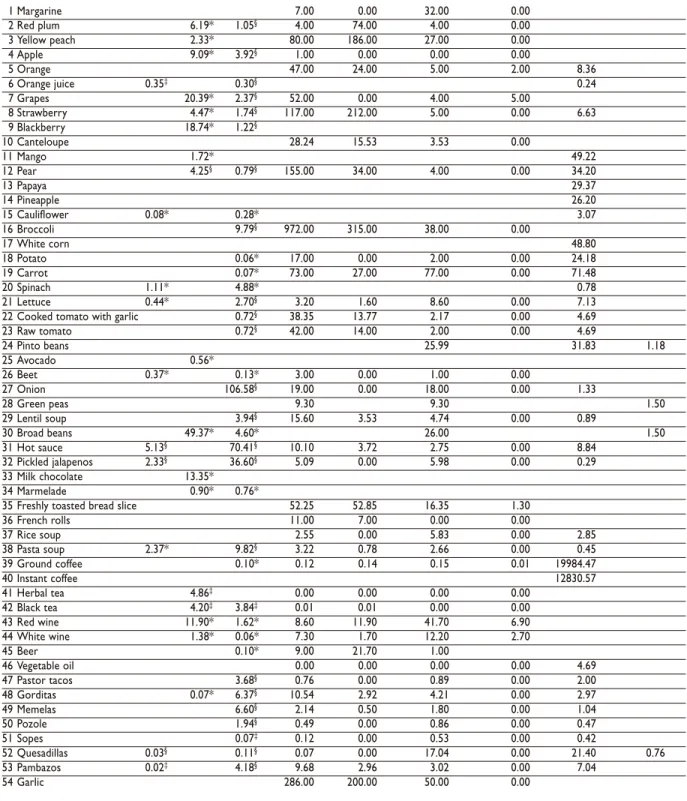
shows the imputed values (mg/100g or
µ
g/100g in
fresh edible weight) for the PHYs in the foods
includ-ed in our FFQ.
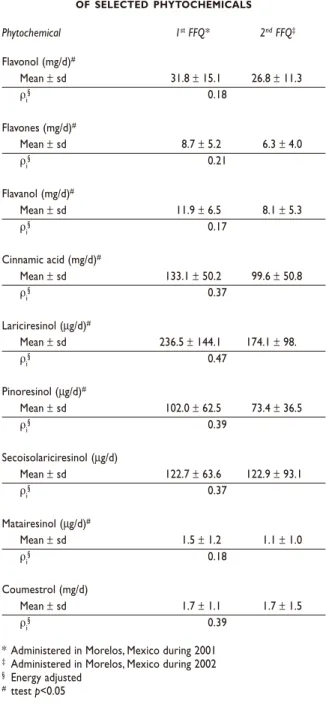
Table III shows the energy-adjusted means of
se-lected PHYs estimated in the two interviews, along
with their energy adjusted intraclass correlation
coef-ficients. The daily nutrient intake was estimated to be
2336.7
±
476.3 kcal for energy, 76.7
±
6.3 g for protein,
273.6
±
26.8 g for carbohydrates and 109.5
±
12.3 g for
total fat (data not included in the table). The daily
FLAV intake varied from 7.5
±
3.8 mg for FES to 29.3
±
Table I
CHARACTERISTICS OF THE STUDY POPULATION
Characteristics (n= 50)
Age (years)
Mean ± SD 23.8 ± 4.1
Median 24
Percentile 25 - 75 21 - 26
Parity (%)
Nulliparous 85.4
Parous 14.6
Body Mass Index
Mean ± SD 23.1 ± 3.5
Median 23.7
Percentile 25 - 75 20.7 - 25.1
Level of education (years)
Mean ± SD 11.1 ± 3.4
Median 12
Occupation (%)
Paid work 50
Housewife 48
Student 2
10.1 mg for FOL. LI daily intake varied from 1.3
±
0.9
µ
g for MA to 205.3
±
111.6
µ
g for LA. CA daily intake
resulted 116.3 mg
±
43.8 while COU intake was 1.7
±
1.1 mg. The adjusted correlation coefficients ranged
from 0.17 for FAL to 0.47 for LA.
Foods that contributed 10% or more to the
select-ed PHYs daily intake are shown in Table IV. Pinto beans
were the main sources of CA, SE and COU intake, and
apples accounted for 28.7% of the FLA intake variance.
Hot sauce was the main contributor of FES and onion
contributed to FOL intake. Broccoli was the primary
source of LA and PI, and oranges explained 53.2% of
the MA intake variation.
Discussion
These results provide information about the intake of
selected PHYs in a group of Mexican women. Our
da-tabase contains information about frequently
con-sumed foods in the Mexican diet, which are sources of
PHYs.
There are several important limitations to our
study. First, our analyses were limited to nine selected
PHYs, therefore we were not able to calculate total
PHYs consumption. Second, we were unable to obtain
data about the PHYs content of some local and
fre-quently consumed foods included in the FFQ,
includ-ing edible cactus, squash blossoms, mamey, zapote and
prickly pears (local fruits). Finally, information about
food preparation was not included in our
question-naire; therefore we were not able to adjust for its affect
on PHYs content. Certain food preparation methods
may alter the content of PHYs, although the
magni-tude of these effects is still unknown.
1,27Pinto beans provided the highest percentage of
three PHYs intake (SE, COU and CA). According to
very recent information several PHYs are present in
different kinds of Mexican beans
28,29however, only one
type of bean was evaluated in our FFQ, further
stud-ies should include other types of beans.
The variability in the estimated intake of PHYs
among countries may be explained by the fact that the
many of the databases do not contain complete
in-formation on PHYs content. For example, not all
data-base values refer to the same compounds –they may
comprise as many as 4000 structurally different
phy-tochemicals with structures varying from simple
mol-ecules (e.g. phenolic acid) to highly polymerized
substances (e.g. tannins).
30Worldwide comparisons of PHYs should be
ap-proached with caution, as methodologies used to
cal-culate these estimates are not standardized.
Table II
CONTENTS OF SELECTED PHYTOCHEMICALS VALUES IN 54 FOODS
Food item Flavone& Flavanol& Flavonol& Lariciresinol#,≠ Pinoresinol#,≠ Secoisolariciresinol#,≠ Matairesinol#,≠ Cinamic acid‡,& Coumestrol‡,&
1 Margarine 7.00 0.00 32.00 0.00
2 Red plum 6.19* 1.05§ 4.00 74.00 4.00 0.00
3 Yellow peach 2.33* 80.00 186.00 27.00 0.00
4 Apple 9.09* 3.92§ 1.00 0.00 0.00 0.00
5 Orange 47.00 24.00 5.00 2.00 8.36
6 Orange juice 0.35‡ 0.30§ 0.24
7 Grapes 20.39* 2.37§ 52.00 0.00 4.00 5.00
8 Strawberry 4.47* 1.74§ 117.00 212.00 5.00 0.00 6.63
9 Blackberry 18.74* 1.22§
10 Canteloupe 28.24 15.53 3.53 0.00
11 Mango 1.72* 49.22
12 Pear 4.25§ 0.79§ 155.00 34.00 4.00 0.00 34.20
13 Papaya 29.37
14 Pineapple 26.20
15 Cauliflower 0.08* 0.28* 3.07
16 Broccoli 9.79§ 972.00 315.00 38.00 0.00
17 White corn 48.80
18 Potato 0.06* 17.00 0.00 2.00 0.00 24.18
19 Carrot 0.07* 73.00 27.00 77.00 0.00 71.48
20 Spinach 1.11* 4.88* 0.78
21 Lettuce 0.44* 2.70§ 3.20 1.60 8.60 0.00 7.13
22 Cooked tomato with garlic 0.72§ 38.35 13.77 2.17 0.00 4.69
23 Raw tomato 0.72§ 42.00 14.00 2.00 0.00 4.69
24 Pinto beans 25.99 31.83 1.18
25 Avocado 0.56*
26 Beet 0.37* 0.13* 3.00 0.00 1.00 0.00
27 Onion 106.58§ 19.00 0.00 18.00 0.00 1.33
28 Green peas 9.30 9.30 1.50
29 Lentil soup 3.94§ 15.60 3.53 4.74 0.00 0.89
30 Broad beans 49.37* 4.60* 26.00 1.50
31 Hot sauce 5.13§ 70.41§ 10.10 3.72 2.75 0.00 8.84
32 Pickled jalapenos 2.33§ 36.60§ 5.09 0.00 5.98 0.00 0.29
33 Milk chocolate 13.35*
34 Marmelade 0.90* 0.76*
35 Freshly toasted bread slice 52.25 52.85 16.35 1.30
36 French rolls 11.00 7.00 0.00 0.00
37 Rice soup 2.55 0.00 5.83 0.00 2.85
38 Pasta soup 2.37* 9.82§ 3.22 0.78 2.66 0.00 0.45
39 Ground coffee 0.10* 0.12 0.14 0.15 0.01 19984.47
40 Instant coffee 12830.57
41 Herbal tea 4.86‡ 0.00 0.00 0.00 0.00
42 Black tea 4.20‡ 3.84‡ 0.01 0.01 0.00 0.00
43 Red wine 11.90* 1.62* 8.60 11.90 41.70 6.90
44 White wine 1.38* 0.06* 7.30 1.70 12.20 2.70
45 Beer 0.10* 9.00 21.70 1.00
46 Vegetable oil 0.00 0.00 0.00 0.00 4.69
47 Pastor tacos 3.68§ 0.76 0.00 0.89 0.00 2.00
48 Gorditas 0.07* 6.37§ 10.54 2.92 4.21 0.00 2.97
49 Memelas 6.60§ 2.14 0.50 1.80 0.00 1.04
50 Pozole 1.94§ 0.49 0.00 0.86 0.00 0.47
51 Sopes 0.07‡ 0.12 0.00 0.53 0.00 0.42
52 Quesadillas 0.03§ 0.11§ 0.07 0.00 17.04 0.00 21.40 0.76
53 Pambazos 0.02‡ 4.18§ 9.68 2.96 3.02 0.00 7.04
54 Garlic 286.00 200.00 50.00 0.00
* USDA flavonoid database
‡ Notis plus database
§ USDA flavonoid and notis plus databases #Milder et al 2005 and Mazur et al 1997
&mg/100g wet edible food
Table III
ENERGY ADJUSTED MEANS AND CORRELATION
COEFFICIENTS OF DAILY INTAKE OF SELECTED PHYTOCHEMICALSPhytochemical 1st FFQ* 2nd FFQ‡
Flavonol (mg/d)#
Mean ± sd 31.8 ± 15.1 26.8 ± 11.3
ρi§ 0.18
Flavones (mg/d)#
Mean ± sd 8.7 ± 5.2 6.3 ± 4.0
ρi
§ 0.21
Flavanol (mg/d)#
Mean ± sd 11.9 ± 6.5 8.1 ± 5.3
ρi
§ 0.17
Cinnamic acid (mg/d)#
Mean ± sd 133.1 ± 50.2 99.6 ± 50.8
ρi§ 0.37
Lariciresinol (µg/d)#
Mean ± sd 236.5 ± 144.1 174.1 ± 98.
ρi
§ 0.47
Pinoresinol (µg/d)#
Mean ± sd 102.0 ± 62.5 73.4 ± 36.5
ρi
§ 0.39
Secoisolariciresinol (µg/d)
Mean ± sd 122.7 ± 63.6 122.9 ± 93.1
ρi§ 0.37
Matairesinol (µg/d)#
Mean ± sd 1.5 ± 1.2 1.1 ± 1.0
ρi
§ 0.18
Coumestrol (mg/d)
Mean ± sd 1.7 ± 1.1 1.7 ± 1.5
ρi
§ 0.39
* Administered in Morelos, Mexico during 2001
‡ Administered in Morelos, Mexico during 2002 § Energy adjusted
#ttest p<0.05
Acknowledgements
This study was supported in part by Mount Sinai
School of Medicine/Queens College International
Training and Research in Environmental and
Occupa-tional Health Program funded by the NaOccupa-tional
Insti-tutes of Health (D43TW00640).
References
1. Mishra S, Dickerson V, Najm W. Phytoestrogens and breast cancer prevention: What is the evidence? Am J Obstet Gynecol
2003;188(5):s66-s70.
2. Murkies A, Wilcox G, Davis S. Clinical Review 92: Phytoestrogens. J Clin Endocrinol Metab 1998;83(2):297-303.
3. Peeters P, Keinan-Boker L, van der Schouw Y, Grobbee D. Phytoestrogens and breast cancer risk. Review of the epidemiological evidence. Breast Cancer Research and Treatment 2003;77:171-183. 4. Arts I, Hollman P. Polyphenols and disease risk in epidemiologic studies. Am J Clin Nutr 2005;81(suppl):S317-S325.
5. Kurzer M, Xu X. Dietary phytoestrogens. Annu Rev Nutr 1997;17:353-381.
6. Strom S, Yamamura Y, Duphorne Ch, Spitz M, Babaian R, Pillow P, et al. Phytoestrogen intake and prostate cancer: a case-control study using a new database. Nutr Cancer 1999;33(1):20-25.
7. Garcia-Closas R, Gonzalez C, Agudo A, Riboli E. Intake of specific carotenoids and flavonoids and the risk of gastric cancer in Spain. Cancer Causes and Control1999;10:71-75.
8. Lagiou P, Samoli E, Lagiou A, Peterson J, Tzonou A, Dwyer J, et al. Flavonoids, vitamin C and adenocarcinoma of the stomach. Cancer Causes and Control 2004;15:67-72.
9. Hertog M, Kromhout D, Aravanis C, Blackburn H, Buzina R, Fidanza F,
et al. Flavonoid intake and long-term risk of coronary heart disease and cancer in the seven countries study. Arch Intern Med 1995;155:381-386. 10. Rimm E, Katan M, Ascherio A, Stampfer M, Willett W. Relation between intake of flavonoids and risk for coronary heart disease in male health professionals. Ann Intern Med 1996;125:384-389. 11. Hirvonen T, Pirjo P, Virtanen M, Ovaskainen M, Häkkinen S, Albanes D, et al. Intake of Flavonols and Flavones and Risk of Coronary Heart Disease in Male Smokers. Epidemiology 2001;12:62-67.
12. Setchell K, Cassidy A. Dietary Isoflavones: Biological Effects and Relevance to Human Health. J Nutr 1999;129:S758-S767.
13. Setchell K, Lydeking-Olsen E. Dietary phytoestrogens and their effect on bone: evidence from in vitro and in vivo, human observational, and dietary intervention studies. Am J Clin Nutr 2003;78(suppl):S593-S609.
Table IV
FOODS THAT CONTRIBUTE ≥ 10% TO THE SELECTED
PHYTOCHEMICAL INTAKE OF STUDY POPULATIONFood Phytochemicals % intake
Pinto beans Secoisolariciresinol 75.8
Coumestrol 66.9
Cinnamic acid 20.5
Broccoli Lariciresinol 20.0
Pinoresinol 10.3
Orange Matairesinol 55.2
Apple Flavanol 28.7
Hot sauce Flavones 48.0
14. Atkinson C, Compston J, Day N, Dowsett M, Bingham S. The effects of phytoestrogen isoflavones on bone density in women: a double-blind, randomized, placebo-controlled trial. Am J Clin Nutr 2004;79(2):326-333. 15. Setchell K. Phytoestrogens: the biochemistry, physiology, and implications for human health of soy isoflavones. Am J Clin Nutr 1998;68(suppl 6):S1333-S1346.
16. Carusi D. Phytoestrogens as hormone replacement therapy: an evidence-based approach. Prim Care Update Ob/ Gyns
2000;7(6):253-259.
17. World Cancer Research Fund/American Institute for Cancer Research. Patterns of diet. In: Food, Nutrition and the prevention of cancer: a global perspective. Press, 1997:20-52.
18. Bonilla-Fernández P, López-Cervantes M, Torres-Sánchez LE, Tortolero-Luna G, López-Carrillo L. Nutritional factors and breast cancer in Mexico. Nutr Cancer 2003;45(2):148-155.
19. Galván-Portillo M, Torres-Sánchez L, López-Carrillo L. Dietary and reproductive factors associated with benign breast disease in Mexican women. Nutr Cancer 2002;43(2):133-140.
20. Nutrient data lab, Food composition lab, Beltsville Human Nutrition Research Center, ARS, U.S. Department of Agriculture. USDA Database for the Flavonoid Content of selected foods 2003;1-77. Available on: http://www.nal.usda.gov/fnic/foodcomp.
21. Institute of Food Research. Biotechnology & Biological Sciences Research Council. Colney, Norwich NR4 7UA, UK. CD-ROM Notisplus a
database of bioactive compounds found in food plants (1998). 22. Milder I, Arts I, van de Putte B, Venema D, Hollman P. Lignan contents of Dutch plant foods: a database including lariciresinol,
pinoresinol, secoisolariciresinol and matairesinol. Br J Nutr 2005;93: 393-402.
23. Mazur W, Duke J, Wahala K, Rasku S, Adlercreutz H. Isoflavonoids and lignans in legumes: nutritional and health aspects in humans. J Nutr Biochem 1998;9:193-200.
24. USDA, ARS, National Genetic Resources Program. Germplasm Resources Information Network - (GRIN) [Online Database]. National Germplasm Resources Laboratory, Beltsville, Maryland. [Accessed on 25 augustt, 2005]. Available on: http://www.ars-grin.gov2/cgi-bin/npgs/html/ index.pl (25 August 2005).
25. Muñoz Z R. Diccionario Enciclopédico de Gastronomía Mexicana. Mexico: Clio, 2000.
26. López-Carrillo L, López-Cervantes M, Ward MH, Bravo-Alvarado J, Ramirez-Espitia A. Nutrient intake and gastric cancer in Mexico. Int J Cancer 1999; 83(5):601-605.
27. Goldman I, Kader A, Heintz M. Influence of production, handling and storage on phytonutrient content of foods. Nut Rev 1999; 57(9): S46-S52. 28. Espinosa-Alonso LG, Lygin A, Widholm JM, Valverde ME, Paredes-Lopez O. Polyphenols in wild and weedy Mexican common beans (Phaseolus vulgaris L.). J Agric Food Chem 2006;54(12):4436-4444. 29. Diaz-Batalla L, Widholm JM, Fahey GC Jr, Castano-Tostado E, Paredes-Lopez O. Chemical components with health implications in wild and cultivated Mexican common bean seeds (Phaseolus vulgaris L.). J Agric Food Chem 2006;54(6):2045-2052.