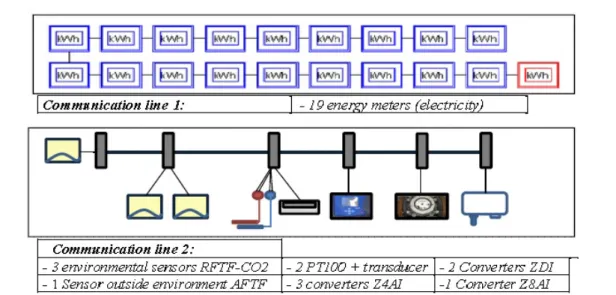
Energy Management by Dynamic Monitoring of a Building of the University of Valladolid
Texto completo
Figure


Documento similar
These base stations were powered with renewable energy sources (wind, solar and geother- mal) and, in addition, equipped with batteries as well as connected to the traditional
Table 10 and Figure 7 show the comparison between the original building and the biomass boilers improvement according to the total primary energy demand during the whole life
Therefore, the current study introduces the optimal configuration of renewable energy generation systems for Chiang Mai University, which is one of the largest public universities
The results form part of a larger study and can be used as a starting point for future research, where the energy performance of the existing building stock will
Given the much higher efficiencies for solar H 2 -generation from water achieved at tandem PEC/PV devices ( > 10% solar-to-H 2 energy efficiency under simulated sunlight) compared
In order to know the energy behavior of the house taking into account all the elements of the building envelope, as well as windows and doors and the installations, it is necessary
In this paper we identify the renewable energy source (RES) demand scenarios for Morocco, the needs of RES installed capacity according to those scenarios and
The withdrawn of magnetic ballast and replacement through an electronic one seems the more suitable alternative to improve lighting efficiency and so to reduce demand.. Sixteen
