N A N O E X P R E S S
Size-Selected Ag Nanoparticles with Five-Fold Symmetry
Miguel A´ ngel Gracia-PinillaÆDomingo FerrerÆ Sergio Mejı´a-RosalesÆEduardo Pe´rez-Tijerina
Received: 11 February 2009 / Accepted: 24 April 2009 / Published online: 15 May 2009 Óto the authors 2009
Abstract Silver nanoparticles were synthesized using the inert gas aggregation technique. We found the optimal experimental conditions to synthesize nanoparticles at different sizes: 1.3±0.2, 1.7 ±0.3, 2.5 ±0.4, 3.7 ±0.4, 4.5±0.9, and 5.5±0.3 nm. We were able to investigate the dependence of the size of the nanoparticles on the synthesis parameters. Our data suggest that the aggregation of clusters (dimers, trimer, etc.) into the active zone of the nanocluster source is the predominant physical mechanism for the formation of the nanoparticles. Our experiments were carried out in conditions that kept the density of nanoparticles low, and the formation of larges nanoparti-cles by coalescence processes was avoided. In order to preserve the structural and morphological properties, the impact energy of the clusters landing into the substrate was
controlled, such that the acceleration energy of the nano-particles was around 0.1 eV/atom, assuring a soft landing deposition. High-resolution transmission electron micros-copy images showed that the nanoparticles were icosahe-dral in shape, preferentially oriented with a five-fold axis perpendicular to the substrate surface. Our results show that the synthesis by inert gas aggregation technique is a very promising alternative to produce metal nanoparticles when the control of both size and shape are critical for the development of practical applications.
Keywords Nanocrystals and nanoparticles Structure of nanoscale materials
Stability and fragmentation of clusters Inert gas aggregation Silver nanoparticles
Introduction
The controlled synthesis of nanoparticles is one of the most challenging tasks for the development of novel nanotech-nology applications. Indeed, the production of well-defined nanoparticles with reproducible size and shape distribu-tions may be quite complicated. Chemical methods [1–5] offer a relatively easy way to synthesize nanoparticles, but often the results are not fully reproducible, and the size and shape distributions are difficult to control. On the other hand, physical methods [6–9] appear to be more promising to produce particles with controlled sizes and shapes, since the synthesis usually depends on a small number of parameters. Actually, the control in the size and shape of the metallic nanoparticles can be critical to understand the behavior and properties of these systems [10]. Recent studies have demonstrated that there is a close relation between the shape of silver nanoparticles, and their M. A´ . Gracia-PinillaS. Mejı´a-RosalesE. Pe´rez-Tijerina (&)
Laboratorio de Nanociencias y Nanotecnologı´a (Facultad de Ciencias Fı´sico Matema´ticas-FCFM), Centro de Innovacio´n, Investigacio´n y Desarrollo en Ingenierı´a y Tecnologı´a (CIIDIT), Universidad Auto´noma de Nuevo Leo´n, Monterrey,
Nuevo Leo´n 66450, Me´xico e-mail: eduardo.pereztj@uanl.edu.mx URL: www.fcfm.uanl.mx/ifi/Nanociencias.htm
M. A´ . Gracia-Pinilla
e-mail: miguel.graciapl@uanl.edu.mx
S. Mejı´a-Rosales
e-mail: smejia@fcfm.uanl.mx
D. Ferrer
The Microelectronics Research Center at The University of Texas at Austin (MRC), Austin, TX 78758, USA e-mail: domingo@mer.utexas.edu
E. Pe´rez-Tijerina
antibacterial and antiviral properties. Jose´-Yacama´n and collaborators [11] found that the interaction of silver nanoparticles with HIV-I viruses is strongly dependent on the size of the particles (only particles of sizes in the range of 1–10 nm get attached to the virus surface). Jose´-Yacama´n’s group also found that the antibacterial activity of silver nanoparticles (for the gram-negative bacterium Escherichia coli) is favored by high-atom-density facets, such as the {111} [12]. In the same direction, results of a recent work show that there is a high shape-dependency in the antibacterial activity of silver nanoparticles [13].
Sattler et al. [14] reported the first successful generation of metal clusters—constituted by few atoms—and larger nanoparticles, using physical techniques. These results were obtained by an inert gas atmosphere for the aggre-gation of the clusters, and the analysis of the sizes was made by mass spectroscopy. The use of magnetron sputter source with technique of cluster ion generation was first introduced by Haberland et al. [15]. A recent paper showing the possibilities of mass selected Ag-clusters deposition, in this case reported the deposition of soft-land mass selected Ag561clusters on an Au(111) surface
func-tionalized with an ordered ML of C60molecules [16]. For
the understanding of the physical-chemistry properties and behavior of mass selected clusters, the characterization in situ is necessary; Brown and co-workers [17] have been pioneers in this direction, in specific in the study of elec-trical properties of mass selected clusters.
In similar experiments, Reinhard et al. [9], using in situ electron diffraction, showed that both small and large nanoparticles produced by this method are highly stable, and that the resulting structures conform a mixture of icosahedra, decahedra, cubo-octahedra, and fcc.
Several theoretical studies have been performed with the aim of predicting the properties of silver nanoparticles. Ferrando and co-workers [18, 19], for example, showed that the icosahedra, while metastable at large sizes, are indeed stable for small nanoparticles. These results are explained by the formation of the particle in a shell-by-shell process. Doye and Calvo [20] found that for silver nanoparticles of small sizes less of 1,000 atoms the ico-sahedral shape dominates. At larger sizes between 1,000 and 100,000 atoms, the decahedra structure becomes preferential, and for even larger sizes (more than 100,000 atoms), the fcc structure with cubo-octahedron or truncated octahedron shapes is the most common. There are also many experimental efforts directed to understand the growth mechanisms of silver clusters and small particles. Parks and co-workers [21] showed that for Ag nanoparti-cles of 55 atoms in size, the ideal Mackay icosahedron is the most energetically preferred structure; these measure-ments were made using electron diffraction in situ over
Ag55?/- ionized clusters selected by mass. Similarly,
Schooss and co-workers [22] made a systematic study for cationic silver nanoparticles of different sizes (19B
n B79),nbeing the number of atoms in the cluster, con-cluding that the growth at these sizes follows a layer by layer mechanism, which allows the formation of particles with icosahedral shapes. Palmer and co-workers [23] reported that Ag nanoparticles synthesized by inert gas aggregation, deposited on carbon grids for transmission electron microscopy (TEM) imaging, evolve for times as large as days to coalesce into larger particles, which may form metastable structures with ordered arrays, and pro-pose that this structuring is regulated by the heterogeneous nucleation of surface defects.
In this work, we use the inert gas sputtering deposition technique [8, 9, 15] to control the size and shape of the silver nanoparticles. The control of the size and shape can be improved by the adequate manipulation of the param-eters that determine the kinetic processes involved in the growth of the particles: temperature, atmosphere, erosion rate, and length of the active area in the nucleation chamber. Since a high percentage of the particles synthe-sized by this method consist of ionized particles, it is possible to use mass spectroscopy in situ to filter the par-ticles by mass, and to use electrostatics to accelerate the charged particles and control their terminal velocity at their arrival to the substrate. In the next section, we make a detailed description of the experimental conditions, fol-lowed by a section that presents and discusses our results. Finally, in the last section, we remark the most relevant conclusions of this work.
Experimental Setup
range of 30–70 W); and (iv) aggregation zone length (from 30 to 130 mm.). The nominal average size of the nano-particles was determined in situ from the experimental conditions; we used the mass spectrometer to select the size of the nanoparticles before collecting them onto substrate. In all cases, the erosion of the target was maintained just for a few minutes, in order to obtain a low density of nano-particles on the substrate (we used quartz substrates and TEM grids as substrates). To assure the preservation of the structural and morphological properties of the particles, the energy of cluster impact [31,32] was kept at 0.1 ev/atom, a value that warranties a soft landing deposition [27–33].
The samples were studied using TEM. We obtained high-resolution (HREM) images using a JEOL 2010 microscope, and STEM images in the high angle annular dark field (HAADF-STEM) mode were used to study the shape and size of the nanoparticles using a Tecnai 20 Microscope, where both TEMs were operated at 200 keV. The crystal structure was confirmed by analysis of the FFT transforms of the unfiltered micrographs. We also used X-ray analysis to confirm that the particles were free of oxides at the surface. The TEM and STEM observations were complemented by atomic force microscopy (AFM) analysis, using the AFM CP-II from Digital Instruments.
Results
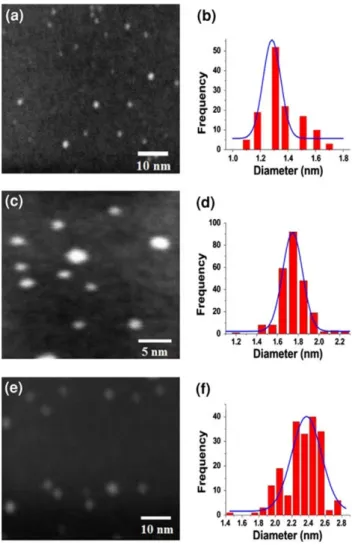
By the variation of the critical parameters on the synthesis system (gas flow, partial gas pressure, magnetron power, aggregation zone length), we were able to produce small nanoparticles at six different sizes: 1.3±0.2, 1.7 ±0.3, 2.5±0.4, 3.7±0.4, 4.5±0.9, and 5.5±0.3 nm. The average size of the nanoparticles was monitored in situ at the synthesis conditions, using the mass spectrometer that selects the size of the nanoparticles (since this synthesis method produce ionized particles, it is possible to filter the particles by size). After deposition, we measured the size of the particles directly from HAADF-STEM micrographs, taking into account only the particles dispersed on the sample surface, and leaving the aggregates out of the contabilization. The results of the HAADF-STEM mea-surements, along with the size distributions estimated by mass spectrometry, are shown in Fig.1. Here, the single curves represent the distributions obtained with the in situ mass spectrometry methods (before the selection by mass), and the shadowed regions represent the distributions obtained by HAADF. As can be noted in Fig.1, the dis-persion in size is significantly smaller than those obtained by other synthesis methods [1,2]. The comparison between the distributionsbeforeandafterthe mass filter highlights the relevance of the filtering process, since the mass spectrometry results show that the distributions of two
neighboring mean sizes overlap their populations (i.e., the distribution of particles with mean size 2.5 nm overlap significantly with the 1.7 and 3.7 nm distributions), whereas the distributions measured after the filter are clearly separated from each other. Thus, the filtering pro-cess allows to synthesize particles with a high resolution in size, which may be exploited to investigate how critical is the dependency of chemical and optical properties on the size of the nanoparticles.
In general terms, the process of production of nano-particles can be explained by three mechanisms [27–30]: the aggregation or attachment of atoms around small clusters (dimers, trimers, etc.); the coagulation of nano-particles, where two or more nanoparticles get together forming a new twinned nanoparticle; and the coalescence of particles (also called Ostwald ripening), being the latter process that predominates at high temperatures. Competi-tion between these three mechanisms will define the final size and shape distributions of the particles. In our case, we controlled the experimental conditions such that the first mechanism—cluster aggregation—is the one that domi-nates the process. The role of the Ar gas is to produce the erosion of the metal target, such that a large presence of argon into the chamber produces a large erosion of the target. By keeping the gas flow at low values, it is possible to obtain small nanoparticles or clusters. The role of helium in the mixture gas is to keep low the rate of nucleation and attachment of metal atoms: as the amount of helium is increased, the number of collisions between metal clusters and He molecules increases as well, reducing the mean free path of the nanoparticles andpreventing their mean size to increase.
The most important parameter that can be varied to control the size of nanoparticles is the power of the mag-netron. By changing the power, it is possible to increase or decrease the kinetic energy of the argon ions, which con-trols the density of sputtered material (at greater kinetic energy, greater amount of erosion of the metal target). There exists a regime of fairly linear dependence of the cluster size on the power of the magnetron, followed by a saturation regime where a slight increment of the power decreases the mean size of the nanoparticles. For a fixed magnetron power, the length of the aggregation zone determines the residence time of the particles into the active zone, and consequently, their final size. The fine tuning of these independent parameters allows the opti-mization of conditions to synthesize particles with a par-ticular mean size. In this study, the parameters were optimized to produce particles of six different sizes: 1.3, 1.7, 2.5, 3.7, 4.5, and 5.5 nm (as shown in Fig.2).
the results are shown in Fig. 3. These images show con-sistency with the very narrow size distributions obtained by TEM. We measured different height profiles of several nanoparticles (these profiles are shown in the Fig. 3b), and the average height matches the 5.5 nm of diameter mea-sured by the mass spectrometer. The shape of the profiles, roughly Gaussian, is consistent with what would be expected fromquasisphericalparticles, such as icosahedra, in contrast with other particle shapes, cuboctahedra for example, that generate height profiles with pronounced changes of slope. These profiles may be considered as evidence that large structural and morphological modifi-cations (plastic deformation, fragmentation, implantation) were not produced neither when the particles were filtered by size with mass spectroscopy, nor at the landing of the particles on the substrate. Therefore, it would be expected that the electronic, structural, and morphological properties of the particles determined by the synthesis conditions are
Fig. 1 HAADF micrograph and histogram of size for Ag nanopar-ticles of:a,b1.3±0.2 nm;c,d1.7±0.3 nm;e,f2.5±0.4 nm;g, h3.7±0.4 nm; i, j4.5±0.9 nm; andk,l5.5±0.3 nm. Taking
into account only the particles dispersed on the sample surface, and leaving the aggregates out of the accountancy
kept without major changes after the deposition. This issue may be of great relevance for practical purposes, since in many potential applications of metal nanoparticles (catal-ysis, electronics, and medicine, for example) the size, superficial area, and geometry are critical factors. From the AFM image shown in Fig.3a, it is possible to observe the growth of some aggregates, something expected for Ag nanoparticles.
Figure4 shows typical HRTEM micrographs of an Ag nanoparticles. The HRTEM images show that the larger nanoparticles (3.7 nmB rB5.5 nm) have an icosahedral or decahedral structure. From the images and their corre-sponding FFT shown in Fig.4, we can note the five-fold, three-fold, and two-fold orientations of the icosahedral and decahedral structure reported before Jose´-Yacama´n and co-workers [12]. In the case of very small nanoparticles (1.3 and 2.5 nm), the HRTEM images are less conclusive concerning to the structure, partly due to the fluctuations at the surface generated by the electron beam; however, the FFT transforms clearly show that the particles are indeed crystalline. However, when nanoparticles are very small, the STEM-HAADF may be helpful to discern their shapes [34], since in the STEM images the intensity signal is
proportional toZn(whereZis the atomic number andnis an exponent close to 2), and to the thickness of the atoms column. Since in our case there is only one chemical ele-ment present in the particles, the intensity profiles of a HAADF-STEM will only depend on the mass distribution. Several HAADF-STEM images for different sizes are shown in Fig.5a–c. In the images, and the profiles marked in the images are drawn in Fig.5d–f. The profiles, approximately gaussian in shape, correspond to nearly spherical particles. Given the similarity of these profiles with those obtained for larger particles, is not unreasonable to assume that the smaller particles are also icosahedral, although higher resolution imaging is needed to discard other possibilities.
Discussion and conclusions
Ag nanoparticles were synthesized by inert gas aggrega-tion, with a high control in the size of the particles.With the experimental conditions used in this work, we were able to produce nanoparticles of six different sizes: 1.3±0.2, 1.7±0.3, 2.5±0.4, 3.7±0.4, 4.5±0.9, and 5.5±0.3 nm. While there was some overlapping between size distributions for neighboring sizes before the selecting the particles by their masses, after the filtering the size distributions showed practically no overlapping. TEM and AFM data show an excellent agreement with the mass spectroscopy measurements. HRTEM micrographs and FFT patterns suggest that the particles have at least one principal axis of five-fold symmetry, characteristic of an icosahedral structure. HAADF-STEM images show that the 1.1 nm have a quasispherical shape, consistent with the icosahedral structure. While in the inert gas condensation process, there are three different mechanisms involved in the formation of nanoparticles—coagulation, coalescence, and aggregation of atoms on small clusters—, it is the latter
Fig. 3 AFM image of Ag nanoparticles:a3509350 nm image of silver nanoparticles filter with 5.5 nm size selected andbprofile of silver nanoparticles by AFM
one that apparently predominates in our experiments, since when there is a high rate of coagulation and coalescence, the size distribution becomes broader. The icosahedral structure can be explained by the rapid condensation of the atoms in the gas to form solid nuclei, which act as seeds for a layer-by-layer growth.
We conclude that it is possible to produce silver nano-particles with icosahedral shape. Therefore, we can control not only the size but also the shape. This will allow to obtain more definitive information about the properties in which the shape variations are not a big factor; we can also be able to understand the change on properties for the icosahedral shape as a function of size.
Acknowledgments This work was supported by the International Center for Nanotechnology and Advanced Materials of the University of Texas at San Antonio (ICNAM), the Council for Science and Technology of the State of Nuevo Leo´n (COCyTE NL), Me´xico, and the National Council for Science and Technology, Me´xico (CONA-CYT), grant 207569. We also acknowledge the contribution of Pro-fessor M. Jose´-Yacama´n from UT-San Antonio for the useful discussions and suggestions.
References
1. T. Teranishi, M. Hosoe, T. Tanaka, M.J. Miyake, J. Phys. Chem. B103, 3818 (1999). doi:10.1021/jp983478m
2. T. Teranishi, M. Miyake, Chem. Mater. 10, 594 (1998). doi: 10.1021/cm9705808
3. T.C. Wang, M.F. Rubner, R.E. Cohen, Lagmuir18, 3370 (2002). doi:10.1021/la015725a
4. R.W.J. Scott, O.M. Wilson, R.M. Crooks, J. Phys. Chem. B109, 692 (2005). doi:10.1021/jp0469665
5. O.M. Wilson, R.W.J. Scott, J.C. Garcia-Martinez, R.M. Crooks, J. Am. Chem. Soc.127, 1015 (2005). doi:10.1021/ja045224m 6. E. Pe´rez-Tijerina, M.A. Gracia-Pinilla, S. Mejı´a-Rosales, U.
Ortiz-Me´ndez, A. Torres, M. Jose´-Yacama´n, Faraday Discuss. 138, 353 (2008). doi:10.1039/b705913m
7. P. Jensen, Rev. Mod. Phys. 71, 1695 (1999). doi:10.1103/ RevModPhys.71.1695
8. R.E. Palmer, S. Pratontep, H.G. Boyen, Nat. Mater. 2, 443 (2003). doi:10.1038/nmat897
9. D. Reinhard, B.D. Hall, D. Ugarte, R. Monot, Phys. Rev. B55, 7868 (1997). doi:10.1103/PhysRevB.55.7868
10. E. Lioudakis, A. Antoniou, A. Othonos, C. Christofides, A.G. Nassiopoulou, C.B. Lioutas, N. Frangis, J. Appl. Phys. 102, 083534 (2007). doi:10.1063/1.2800269
11. J.L. Elechiguerra, J.L. Burt, J.R. Morones, A. Camacho-Bragado, X. Gao, H.H. Lara, M. Jose´-Yacama´n, J. Nanobiotechnol.3, 6 (2005). doi:10.1186/1477-3155-3-6
12. J.R. Morones, J.L. Elechiguerra, A. Camacho-Bragado, K. Holt, J.B. Kouri, J.T. Ramı´rez, M. Jose´-Yacama´n, Nanotechnology16, 2346 (2005). doi:10.1088/0957-4484/16/10/059
13. S. Pal, Y.K. Tak, J.M. Song, Appl. Environ. Microbiol.73, 1712 (2007). doi:10.1128/AEM.02218-06
14. K. Sattler, J. Mu¨hlbach, E. Recknagel, Phys. Rev. Lett.45, 821 (1980). doi:10.1103/PhysRevLett.45.821
15. H. Haberland, M. Mall, M. Moseler et al., J. Vac. Sci. Technol. A 12(5), 2925 (1994). doi:10.1116/1.578967
16. S. Duffe, T. Irawan, M. Bieletzki, T. Richter, B. Sieben, C. Yin, B. von Issendorff, M. Moseler, H. Ho¨vel, Eur. Phys. J. D45, 401 (2007). doi:10.1140/epjd/e2007-00201-y
17. A.D.F. Dunbara, J.G. Partridge, M. Schulze, S.A. Brown, Eur. Phys. J. D39, 415 (2006)
0 2 4 6 8 10 0.0
0.1 0.2 0.3 0.4 0.5
(d)
Intensity (a.u)
Diameter (nm)
0 1 2 3 4 5 6
0.00 0.05 0.10 0.15 0.20 0.25
(e)
Intens
ity (
a.u
)
Diameter (nm)
0.0 0.5 1.0 1.5 2.0 2.5 3.0 0.00
0.05 0.10 0.15 0.20 0.25 0.30 0.35
(f)
Intensity (a.u)
Diameter (nm)
(a) (b) (c)
18. F. Baletto, C. Mottet, R. Ferrando, Phys. Rev. B 63, 155408 (2001). doi:10.1103/PhysRevB.63.155408
19. F. Baletto, R. Ferrando, A. Fortunelli, F. Montalenti, C. Mottet, J. Chem. Phys.116, 3856 (2002). doi:10.1063/1.1448484 20. J.P.K. Doye, F. Calvo, Phys. Rev. Lett.86, 3570 (2001). doi:
10.1103/PhysRevLett.86.3570
21. X. Xing, R.M. Danell, I.L. Garzo´n, K. Michaelian, M.N. Blom, M.M. Burns, J.H. Parks, Phys. Rev. B 72, 081405 (2005). doi: 10.1103/PhysRevB.72.081405
22. M.N. Blom, D. Schooss, J. Stairs, M. Kappes, J. Chem. Phys. 124, 244308 (2006)
23. M. Couillard, S. Pratontep, R.E. Palmer, Appl. Phys. Lett.82, 2595 (2003). doi:10.1063/1.1568165
24. S.H. Barker, S.C. Thorton, A.M. Keen, T.I. Preston, C. Norris, K.W. Edmonds, C. Binns, Rev. Sci. Instrum. 68, 1853 (1997). doi:10.1063/1.1147957
25. I.M. Goldby, B. Von Issendorff, L. Kuipers, R.E. Palmer, Rev. Sci. Instrum.68, 3327 (1997). doi:10.1063/1.1148292
26. Mantis Deposition Ltd Oxford, England. www.mantisde position.com
27. S. Stappert, Ph.D. thesis, Univertita¨t Duisburg Dessen, 2003 28. I. Shyjumon, Ph.D. thesis, University of Greifswald, 2005 29. M.A. Gracia-Pinilla, Ph.D. thesis, Universidad Auto´noma de
Nuevo Leo´n, 2008
30. M.A. Gracia-Pinilla, E. Pe´rez-Tijerina, J.A. Garcı´a, C. Ferna´ndez-Navarro, A. Tlahuice-Flores, S. Mejı´a-Rosales, J.M. Montejano-Carrizales, M. Jose´-Yacama´n, J. Phys. Chem. C112, 13492 (2008). doi:10.1021/jp804085q
31. H. Haberland, Z. Insepov, M. Moseler, Phys. Rev. B51, 11061 (1995). doi:10.1103/PhysRevB.51.11061
32. O. Rattunde, M. Moseler, A. Ha¨feler, J. Kraft, D. Rieser, H. Haberland, J. Appl. Phys. 90, 3226 (2001). doi:10.1063/1. 1398067
33. K.-H. Meiwes-Broer, Metal Clusters at Surfaces, Structure, Quantum Properties, Physical Chemistry, 1st edn. (Springer-Verlag, Berlin, 2000)