Work Distribution, Methodology and
Technology for ISD and Maintenance
Trends over the last 30 Years
John Krogstie
IDI, NTNU and SINTEF Norway
Abstract. The information systems we see around us today are at first sight very different from those that were developed 30 years ago. On the other hand, it seems that we are still struggling with many of the same problems, such as late projects and unfilled customer demands. In this article we present selected data from survey investigations performed by us in 1993, 1998, and 2003 among Norwegian organisations on how they conduct information systems development and maintenance. The investigations looks on many of the same areas as earlier investigations e.g. by Lientz and Swanson in the late 1970’, thus we are able to report on some tendencies of the development in the last 30 years. A major finding is that even if we witness large changes in the implementation technology and methods used, a number of aspects such as overall percentage of time used for maintaining and evolving systems in production compared to time used for development is remarkably stable. The same can be said about the rate of replacement, around 50% of ‘new’ systems to be developed are replacement systems. On the other hand, since we have more complex infrastructures supporting the information systems, more and more of the resources are used for other tasks such as operations and user-support. Less and less time is available for providing new information systems support in organisation
1 Introduction
difficulties with application systems that they are under a constant pressure of change. Given the intrinsic evolutionary nature of the sources of system specifications, it should come as no surprise that specifications and the related information system must evolve as well [1].
The goal of both development activities and maintenance activities is to keep the overall information system support of the organisation relevant to the organisation, meaning that it supports the fulfilment of organisational needs. A lot of the activities usually labelled ‘maintenance’, are in this light value-adding activates, enabling the users of the systems to do new task. On the other hand, a large proportion of the ‘new’ systems being developed are so-called replacement systems, mostly replacing the existing systems without adding much to what end-users can do with the overall application systems portfolio of the organisation.
Based on this thinking we have earlier developed the concept application portfolio upkeep 1
as a high-level measure that can be used to evaluate to what extent an organisation is able to evolve their application system portfolio efficiently. How application portfolio upkeep is different from maintenance is described further below.
In this paper, we present descriptive results from survey-investigations performed in Norwegian organisations in 1993, 1998, and 2003. These investigations are also comparable to similar investigation by Lientz and Swanson going back to the late 70ties, thus are able to give us a way of tracking the developments over the last 30 years in this area. The statistical significance of some of the main differences is reported in [3], but is not included here for brevity.
1.1 Outline of the Paper
We will first give definitions of some of the main terms used within software development and maintenance, including the terms application portfolio upkeep and application portfolio evolution. The main descriptive results from our investigation are then presented and compared with previous investigations from earlier years. The last section summarises our results and presents ideas for further work.
2 Basic concepts
Maintenance is in the IEEE Glossary divided into three types: corrective, adaptive and perfective [4] inspired by [5]. We here use the IEEE terms with some clarifications:
Maintenance is defined as the process of modifying a software system or component after delivery.
1. Corrective maintenance is performed to correct faults in hardware and software. 2. Adaptive maintenance is performed to make the computer program usable in a
changed environment
3. Perfective maintenance is performed to improve the performance, maintainability, or other attributes of a computer program. Perfective
1
maintenance has been divided into enhancive maintenance [6] and non-functional perfective maintenance. Enhancive maintenance implies changes and additions to the functionality offered to the users by the system. Non-functional perfective maintenance implies improvements to the quality features of the information system and other features being important for the developer and maintainer of the system, such as modifiability. Non-functional perfective maintenance thus includes what is often termed preventive maintenance, but also such things as improving the performance of the system.
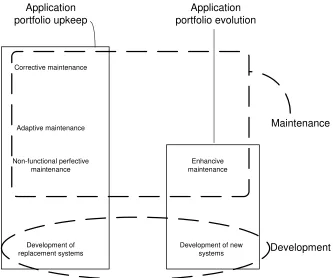
In addition to the traditional temporal distinction between development and maintenance, we have introduced the concepts application portfolio evolution and application portfolio upkeep, given the groupings as illustrated in Figure 1.
1. Application portfolio evolution: Development or maintenance where changes in the application increase the functional coverage of the total application systems portfolio of the organisation. This includes:
• Development of new systems that cover areas, which are not covered earlier by other systems in the organisations
• Enhancive maintenance.
2. Application portfolio upkeep: Work made to keep up the functional coverage of the information system portfolio of the organisation. This includes:
• Development of replacement systems.
Corrective maintenance
Adaptive maintenance
Non-functional perfective maintenance
Enhancive maintenance
Development of replacement systems
Development of new systems
Application portfolio upkeep
Application portfolio evolution
Maintenance
Development
[image:3.612.141.474.209.487.2]• Corrective maintenance • Adaptive maintenance
• Non-functional perfective maintenance
3 Research Method
The survey form used in 2003 was distributed by mail to 247 Norwegian organisations. The organisations were randomly selected from the list of member organisations of Dataforeningen (The Norwegian Computer Society).
The form contained 38 questions, many with sub-questions. The contents of the form [7] were based on previous investigations within this area; especially those described in [8-12].
On some of the questions, we were interested in the quality of the answers, recognising that some of the information called for might not be easily obtainable. It was also room for issuing open-ended remarks on most questions.
Galtung [13] regards that the least size that is meaningful in a survey is 40 units. Since survey-investigations in the area of development of application systems toward the same population earlier had given a response rate of about 22% [14,15] and the response rate of similar surveys has been around 20-25% (e.g. [9]), an answer ratio of approximately 20% was expected. This would have resulted in around 50 responses. 54 responses were returned, giving a response rate of 22%.
The forms were filled in using a web-form by people with long experience with application systems related work (average 14.5 years), typically filling the role as IT director in the company. Of the respondents, 49 out of 53 (92.5%) indicated that IT was of extremely (5) to large (4) strategic importance for the organisation. The additional four respondents answered 3 on the 1-5 scale used. This indicates that application systems support including own development and maintenance is an area of importance for the respondents. All organisations were doing work on all support-line levels (1-3) [16], but with different emphasis on different types of support.
In 1993 [15 17, 18], and 1998 [8] we performed similar surveys which contain the results from investigations of 52 and 53 Norwegian organisations, respectively. Most of the organisations that received a survey-form in the 1993 and 1998 studies also received the form from us in 2003, and many of the same questions have been asked. The methods that are used are also similar, enabling us to present a ‘longitudinal survey study’, although the overlap among actual respondents is limited to only a few organisations. Because of this and the somewhat low response rate, we will be cautious in our interpretations of the results
3. 1 Other Investigations
We will compare some of the results also with the results of similar investigations in other countries. The most important of these investigations are:
2. The Nosek and Palvia investigation [11]: A follow-up study to Lientz/Swanson performed in 1990. Their results are based on responses from 52 American organisations.
3. The Swanson and Beath investigation [12]: Reports on case-studies of 12 American companies that in addition to questions given in the Lientz/Swanson study focused on portfolio analysis and the question of replacement systems. These aspects are also a major part of our investigations.
4. Descriptive Results
First, we present some of the overall demographics of the surveys. We focus on 2003 results. Similar results from our previous surveys conducted in 1993 and 1998 are included in parenthesis where the numbers are comparable.
20% (1998-43%) of the organisations had a yearly data processing budget above 10 mill NKr (approx. 1.3 mill USD), and the average number of employees among the responding organisations was 181 (1998-656; 1993-2347). The average number of full-time personnel in the IS-organisations reported on was 9.8 (1998-10.9; 1993-24.3), whereas the average number of full-time application programmer and/or analysts was 4.1 (1998-4.6; 1993-9.5). As we see, the responding companies are generally smaller in our latest survey, whereas they have approximately the same size of IT-departments as in the 1998 survey. The average experience in the local IS-department was 5.4 (1998-6.3; 1993-6.4) years, (average total experience was 8.2 (1998-8.3) years. The average number of full time hired IT consultants was 0.7, which is much lower than what was reported in 1998 (2,7). This reflects the limited activity at the time in the Norwegian consultant-market (and general), where all the major consultant-companies had to lay off hundreds of employees.
4.1 Portfolio Analysis and Replacement Systems
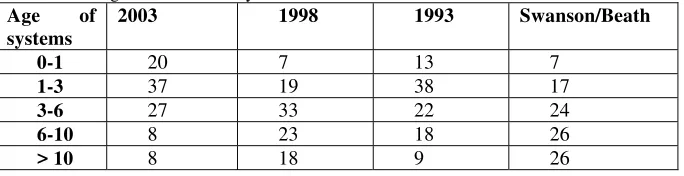
[image:5.612.142.484.528.616.2]The number of main systems in the organisations ranged between one and 15, with a mean of 4,5 (1998-9.6;1993-10.3) and a median of 3 (1998-4;1993-5) systems. The user population of these systems ranged between 3 and 2005, with a mean of 314 (1998-498; 1993-541) and a median of 55 (1998-150;1993-250). The age distribution of the systems in ours studies and the Swanson/Beath study is provided in Table 1. The average age of the systems was 3.9 years (1998-5,0 ; 1993-4.6; Swanson/Beath-6.6).
Table 1 : Age distribution of systems
Age of systems
2003 1998 1993 Swanson/Beath
0-1 20 7 13 7
1-3 37 19 38 17
3-6 27 33 22 24
6-10 8 23 18 26
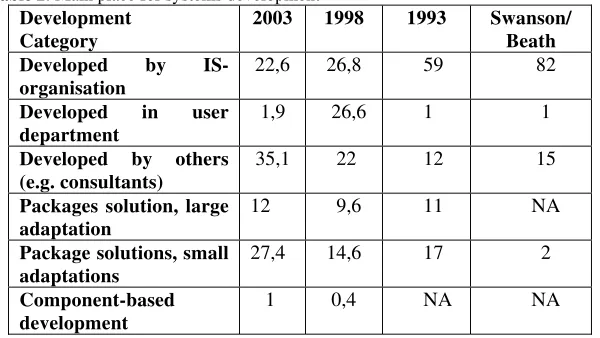
An overview of where systems are developed is provided in table 2. As an overall trend, we see that fewer systems are being developed in the IS-organisation, from 82% in Swanson/Beath to 59% in 1993, to just above 20 % in 2003. The amount of systems developed in the user organisation remains low (the peak in 1998 was due to a few organisations with a large number of systems). Similarly we see an increase in systems developed by outside firms, and on the use of packages. Whereas the amount of packages with large adaptations (e.g. ERP systems) appears to be quite stable around 10% over the last 10 years, the number of COTS (packages with small adaptations) is on the rise. The new category we introduced in 1998, component-based development only amounted to 1.0 % (0.4% in 1998) of the total systems.
Table 2: Main place for systems development
Development Category
2003 1998 1993 Swanson/ Beath Developed by
IS-organisation
22,6 26,8 59 82
Developed in user department
1,9 26,6 1 1
Developed by others (e.g. consultants)
35,1 22 12 15
Packages solution, large adaptation
12 9,6 11 NA
Package solutions, small adaptations
27,4 14,6 17 2
Component-based development
1 0,4 NA NA
The organisations typically supported several technical configurations (mean 1.9, median 2). The average number of different programming languages in use was 2 (median 2). This is similar to the investigation in 1998 and 1993. Table 3 provides an overview of the percentage of systems reported being developed using the different programming languages. As we see, from being dominant ten years ago COBOL is almost not used anymore.
Table 3: Percentages of systems developed using different programming languages
Language/ Investigation
2003 1998 1993 Swanson/ Beath
Nosek/ Palvia
Lientz/ Swans.
COBOL 0,5% 32.6% 49% 63% 51% 51.6%
4GL 13,5% 16.9% 24% 8%
C 12,5% 15.4% 4% 3%
C++ 23,1% 15.1%
RPG 12.9% 4% 2% 10% 22.4%
Java 29,8% 2%
Assembler 0.9% 3% 8% 11.9%
Fortran 0.6% 4% 2% 7% 2.4%
PASCAL 0.3% 2%
PL/1 0.3% 2% 25% 3.2%
The languages that are used in most organisations and for most systems are now Java (27%) and C++ (24%). Java was just starting to be in widespread use in 1998 and C++ was barely included in 1993. The percentage of organisations reporting to have COBOL applications has decreased from 73% in 1994 to 26% in 1998 to 1% in 2003.
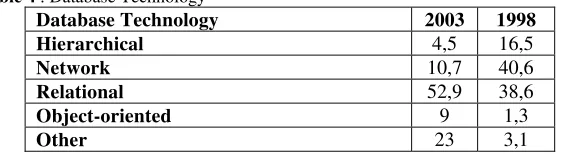
[image:7.612.166.448.217.294.2]Table 4 summarises the development in database technologies, showing how eventually most installed databases now are relational. Also in 1998, the relational technology was most widespread looking upon the number of organisations using this technology. We also see a rise in the use of object-oriented and other database technology (e.g. for Data Warehouses).
Table 4 : Database Technology
Database Technology 2003 1998
Hierarchical 4,5 16,5
Network 10,7 40,6
Relational 52,9 38,6
Object-oriented 9 1,3
Other 23 3,1
In general, we see that the developments as for implementation technologies follow an expected path, but much slower than one might have expected.
40 new systems were currently being developed, and 23 of these systems (60 %) were regarded as replacement systems. (1998-57%; 1993-48%; S/B-49%). The portfolio of the responding organisations contained 172 systems, meaning that 13% of the current portfolio was being replaced. (1998 – 9%; 1993 – 11%; S/B 10%) . The average age of systems to be replaced was 5.5 years (1998-10.5 years ; 1993-8.5 years). The reasons for the replacements have slightly changed from earlier investigations [3]. The most important reasons for replacement are now a need for standardization and integration with other systems. The burden to maintain is still an important issue in many cases, although of less importance than in earlier investigations. Burden to operate and use is much less important.
4.2 Use of Methodology and Organisational Controls
As for the use of methodology, as many as third of the organisations respond that they have no methodology in place at all. As for the use of methodology within different areas of development and maintenance, the numbers were: Planning (43.5%, 1998-34%), Analysis (23,9%, 1998-30,2%), Requirements specification (56.5%, 1998-50,9%), Design (45.7%, 1998-39,6%), Implementation/Coding (52.2%,1998-43,3%), Testing (54.3%, 1998-34%), Conversion and rollout (32.6%,1998-26,4%), Operations (37%,1998-32,1%), Maintenance (28.3%,1998-30,2%), Project management (34.8%,1998-41,5%).
average 2 (1998-2;1993-2) systems supported by the tools. This shows that the use of advanced system development tools still makes a limited although increasing impact on the overall application systems support of organisations.
With 'organisational controls' we mean procedures and functions that are intended to control different aspects of the maintenance process. Use of organisational controls concerning maintenance has been reported in several studies [8, 10, 11, 12, 15].
The use of organisational controls and a comparison with previous investigations are given in Table 5. The majority of the organisations document user requests, classify change requests and re-test changes in their systems as in the previous investigations. A marked improvement in the use of cost-justifications can be seen. On the other hand, a dramatic worsening of the use of periodic implementations of errors and new functionality can also be seen. The use of organisational controls have in other studies shown to be efficient for improving the amount of value added time of maintenance by increasing the percentage enhancive maintenance [19].
Table 5: Comparisons on use of organisational controls
Control2 2003 1998 1993 Nosek/
Palvia
Lientz/ Swans.
e. Changes are re-tested 75% 59% 79% 54% 59% b. Classification of CR 64% 59% 60% N/A N/A d. Changes documented 57% 51% 67% 83% 77% c. Requests cost-justified 55% 36% 54% 37% 33% h. Users kept informed 51% 51% 79% N/A N/A a. User requests logged 49% 59% 77% 89% 79% i. Equal routines for all 40% 40% 58% N/A N/A j. Periodic formal audits 38% 17% 68% 39% 32% g. Acceptance testing of doc. 34% 28% 43% N/A N/A l. Personnel charge-back 19% 13% 31% 25% 31% k. Equipment charge-back 17% 15% 40% 23% 34% f. Changes are batched 13% 52% 40% 28% 33% Organisational controls are typically used to assure adhering to software maintenance success factors [20]. An assumption concerning use of organisational controls is that there always is a potential for improvement of the IS-system portfolio. Usually the amount of change requests exceeds the capacity of the IS-organisation. Based on this it seems reasonable to prioritise change requests and perform cost-benefit analysis. Among the responding organisations, however, 45% did not perform analysis of consequences related to changes and requests were not cost-justified.
4.3 Distribution of Work
Table 6 shows the distribution of work in previous investigations, listing the percentage of maintenance work relative to development work, the study reported, and the year of the study. Based on this we find that in most investigations, between 50% and 60% of the effort is done to enhance systems in operation (maintenance) when disregarding other work than development and maintenance. An exception from this was our previous study in 1998.
Table 6: Result on maintenance from previous investigations on maintenance
Maintenance Investigation Year
49 Arfa et al [21] 1990
53 Lientz and Swanson [10] 1980
56 Jørgensen [22] 1994
58 Nosek and Palvia [11] 1990
58 Yip [23] 1995
59 Krogstie [15] 1993
63 Martinussen [24] 1996
72 Holgeid [8] 1998
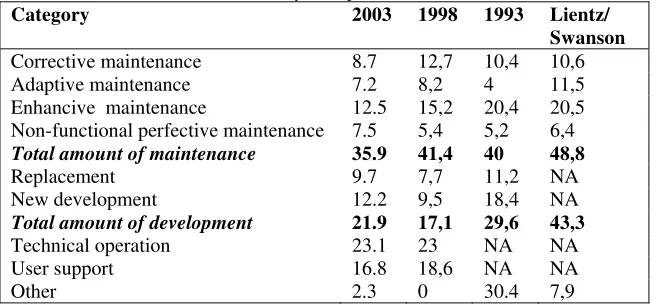
[image:9.612.140.471.300.453.2]Table 7 summarises the descriptive results on the distribution of work in the categories in our investigation, comparing to previous investigations.
Table 7: Distribution of the work done by IS-departments
Category 2003 1998 1993 Lientz/
Swanson
Corrective maintenance 8.7 12,7 10,4 10,6
Adaptive maintenance 7.2 8,2 4 11,5
Enhancive maintenance 12.5 15,2 20,4 20,5 Non-functional perfective maintenance 7.5 5,4 5,2 6,4
Total amount of maintenance 35.9 41,4 40 48,8
Replacement 9.7 7,7 11,2 NA
New development 12.2 9,5 18,4 NA
Total amount of development 21.9 17,1 29,6 43,3
Technical operation 23.1 23 NA NA
User support 16.8 18,6 NA NA
Other 2.3 0 30.4 7,9
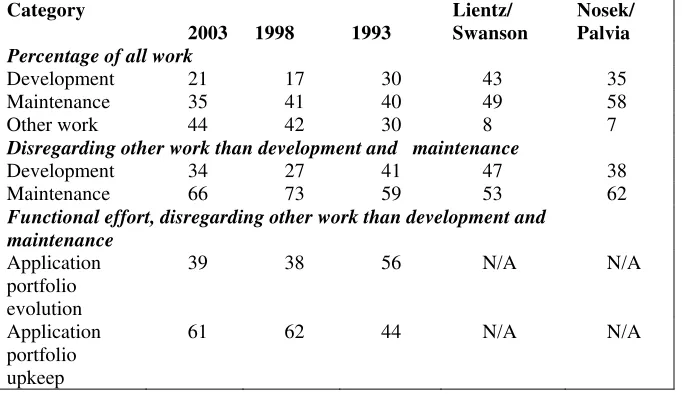
in 1998, the one in 1993, the Lientz/Swanson investigation and the Nosek/Palvia investigation. The first set of number compare the numbers for development, maintenance and other work. The amount of other work reported in our investigations is much larger than in the American investigations. Therefore, in the second set of figures, we compare the data without considering other work. For the categories application portfolio evolution and application portfolio upkeep, we only have numbers from our own investigations.
Table 8: Comparisons of maintenance figures with previous investigations
Category
2003 1998 1993
Lientz/ Swanson
Nosek/ Palvia
Percentage of all work
Development 21 17 30 43 35
Maintenance 35 41 40 49 58
Other work 44 42 30 8 7
Disregarding other work than development and maintenance
Development 34 27 41 47 38
Maintenance 66 73 59 53 62
Functional effort, disregarding other work than development and maintenance
Application portfolio evolution
39 38 56 N/A N/A
Application portfolio upkeep
61 62 44 N/A N/A
5
Conclusion and Further Work
Looking at the overall trends, there are a number of differences in the underlying technology, which is as expected. This is very clearly witnessed in the distribution of programming languages used, where procedurally languages like COBOL have to a large extend been suppressed by object-oriented languages like Java and C++. This has happened at a smaller pace than one might have expected, applications exist for a number of years in organisations before they are being replaced, even if it appears that the replacement time is decreasing. On the other hand, overall percentage of time uses for maintaining and evolving systems in production compared to time used for development is remarkably stable. The same can be said about the rate of replacement, around 50% of ‘new’ systems to be developed are actually replacement systems. Since more complex infrastructures are supporting the information systems, more and more of the resources is used for other tasks such as operations and user-support, less and less time is available for providing new information systems support in organisation
developing several detailed case studies. To come up with better empirical data on to what extent the application systems support in an organisation is efficient, would take another type of investigation, surveying the whole portfolio of the individual organisation, and getting more detailed data on the amount of the work that is looked upon as giving the end-user improved support, and how efficient this improved support was provided. This should include the views of the users of the application systems portfolio in addition to those of the IS-managers and developers.
A long-term plan is to do a similar investigation in 2008, following up our five-year cycle.
References
1. B. Boehm, K. Sullivan, Software economics: status and prospect. Information and Software Technology 41(14) (1999) 937-946.
2. F. P. Brooks, No silver bullet. Essence and accidents of software engineering, IEEE Computer 20 (4) (1987) 10-19.
3. J. Krogstie, A. Jahr, D. I. K. Sjøberg. A Longitudinal Study of Development and Maintenance in Norway: Report from the 2003 Investigation, accepted in Information and Software Technology, 2006
4. IEEE Standard Glossary of Software Engineering Terminology, 1991
5. E.B. Swanson, The dimensions of maintenance, Proceedings of the Second International Conference on Software Engineering, San Francisco, USA, August 1976, pp. 492-497.
6. Chapin, N. Software Maintenance Types – A Fresh View. Proceedings of the International Conference on Software Maintenance (ICSM’2000) pp 247-252 2000 7. A. Jahr Development and Maintenance of IT-systems in Norwegian Organizations, Master Thesis IFI, UIO 2005
8. K. K. Holgeid, J. Krogstie, and D. I. K. Sjøberg, A study of development and maintenance in Norway: Assessing the efficiency of information systems support using functional maintenance. Information and Software Technology, 2000. 42: p. 687-700.
9. B.P. Lientz, E.B. Swanson, G.E. Tompkins, Characteristics of application software maintenance, Communications of the ACM, 21 (6) (1978) 466-471.
10. B.P. Lientz, E.B. Swanson, Software Maintenance Management, Addison Wesley, 1980.
11. J.T. Nosek, P. Palvia, Software maintenance management: Changes in the last decade, Journal of Software Maintenance, 2 (1990) 157-174.
12. E.B. Swanson, C. M. Beath, Maintaining Information Systems in Organizations, Wiley Series in Information Systems, John Wiley & Sons, 1989.
13. J. Galtung, Theory and Method of Social Research, Universitetsforlaget, Oslo, Norway 1967.
14. L. Bergersen, Prosjektadministrasjon i systemutvikling: Aktiviteter i planleggingsfasen som påvirker suksess (In Norwegian), PhD thesis, ORAL, NTH, Trondheim, Norway 1990.
Conference on Software Maintenance (ICSM’94), IEEE Computer Society Press, Victoria, Canada, September 19-23 1994, pp. 304-313.
16. M. Kajko-Mattsson, Ahnlund, C. and Lundberg, E. CM3 : Service Level Agreement. Proceedings of the 20th IEEE International Conference on Software Maintenance (ICSM’04) 2004
17. Krogstie, J., Use of methods and CASE-tools in Norway: Results from a survey. Journal of Automated Software Engineering, 1996. 3: p. 347--367.
18. J. Krogstie. On the distinction between functional development and functional maintenance, Journal of Software Maintenance, 7 (1995) 383-403.
19. J. Krogstie, Process improvement as organizational development: A case study on the introduction and improvement of information system processes in a Norwegian organization. in Proceedings from NOKOBIT'2000. 2000. Bodø, Norway 20. H. M. Sneed and P. Brössler. Critical Factors in Software Maintenance: A Case Study Proceedings of the 19th IEEE International conference on Software Maintenance (ICSM’03) (2003)
21. L. B. Arfa, A. Mili and L. Sekhri Software maintenance management in Tunisia: A statistical study Proceedings of ICSM 1990 pages 124-129, IEEE 1990 22. M. Jørgensen, Empirical Studies of Software Maintenance, PhD Thesis University of Oslo, 1994, Research Report 188, ISBN 82-7368-098-3.
23. S.W.L. Yip, Software Maintenance in Hong Kong, in G. Caldiera, K. Bennett (Eds.) Proceedings of the International Conference on Software Maintenance (ICSM’95), IEEE Computer Society Press, Nice, France, October 17-20, 1995 pp. 88-97.