Open Access
Research article
Influence of continental history on the ecological specialization and
macroevolutionary processes in the mammalian assemblage of
South America: Differences between small and large mammals
Ana Moreno Bofarull
1,2, Antón Arias Royo
1,
Manuel Hernández Fernández*
3,4, Edgardo Ortiz-Jaureguizar
5and
Jorge Morales
6Address: 1Dept. Biología, Facultad de Ciencias, Universidad Autónoma de Madrid. C/Darwin 2, 28049 Cantoblanco, Madrid, Spain, 2Serv. Microbiología, Hospital Universitario Ramón y Cajal. Cr. Colmenar Viejo Km 9, 28034 Madrid, Spain, 3Dept. Paleontología, Facultad de Ciencias Geológicas, Universidad Complutense de Madrid. C/José Antonio Novais 2, 28040 Madrid, Spain, 4Unidad de Investigación de Paleontología, Instituto de Geología Económica, Consejo Superior de Investigaciones Científicas. C/José Antonio Novais 2, 28040 Madrid, Spain, 5Laboratorio de Sistemática y Biología Evolutiva (LASBE), Facultad de Ciencias Naturales y Museo, Universidad de la Plata. Paseo del Bosque s/n, B1900FWA La Plata, Argentina and 6Dept. Paleobiología, Museo Nacional de Ciencias Naturales, Consejo Superior de Investigaciones Científicas. C/José Gutiérrez Abascal 2, 28006 Madrid, Spain
Email: Ana Moreno Bofarull - anissha23@hotmail.com; Antón Arias Royo - anton_arias@hotmail.com; Manuel Hernández Fernández* - hdezfdez@geo.ucm.es; Edgardo Ortiz-Jaureguizar - eortiz@fcnym.unlp.edu.ar; Jorge Morales - mcnm166@mncn.csic.es
* Corresponding author
Abstract
Background: This paper tests Vrba's resource-use hypothesis, which predicts that generalist species have lower specialization and extinction rates than specialists, using the 879 species of South American mammals. We tested several predictions about this hypothesis using the biomic specialization index (BSI) for each species, which is based on its geographical range within different climate-zones. The four predictions tested are: (1) there is a high frequency of species restricted to a single biome, which henceforth are referred to as stenobiomic species, (2) certain clades are more stenobiomic than others, (3) there is a higher proportion of biomic specialists in biomes that underwent through major expansion-contraction alternation due to the glacial-interglacial cycles, (4) certain combinations of inhabited biomes occur more frequently among species than do others.
Results: Our results are consistent with these predictions. (1) We found that 42 % of the species inhabit only one biome. (2) There are more generalists among species of Carnivora than in clades of herbivores. However, Artiodactyla, shows a distribution along the specialization gradient different from the one expected. (3) Biomic specialists are predominant in tropical rainforest and desert biomes. Nevertheless, we found some differences between small and large mammals in relation to these results. Stenobiomic species of micromammalian clades are more abundant in most biomes than expected by chance, while in the case of macromammalian clades stenobiomic species are more frequent than expected in tropical rainforest, tropical deciduous woodland and desert biomes only. (4) The most frequent combinations of inhabited biomes among the South American mammals are those with few biomes, i.e., the ones that suffered a higher rate of vicariance due to climatic cycles.
Published: 26 March 2008
BMC Evolutionary Biology 2008, 8:97 doi:10.1186/1471-2148-8-97
Received: 4 June 2007 Accepted: 26 March 2008
This article is available from: http://www.biomedcentral.com/1471-2148/8/97 © 2008 Bofarull et al; licensee BioMed Central Ltd.
Conclusion: Our results agree with the resource-use hypothesis and, therefore, with a major role of the past climatic changes as drivers of mammalian evolution. Nevertheless, deviations from the expectations indicate the importance of differences in reproductive traits and paleobiogeographic history for the macroevolutionary processes involved. In the case of South American mammals, the Pliocene Great American Biotic Interchange strongly influences the ecological characteristics of this assemblage. Furthermore, the Andes have acted as a fertile ground for speciation in environments prone to vicariance. Finally, the micromammals appear as more prone to biomic specialization than larger species. These factors are responsible for some of the differences found between South America and Africa in the studied pattern. For example, the extensive South American mountain ranges favour a higher number of combinations of inhabited biomes in comparison with Africa.
Background
There are important connections between the global pat-terns on species biodiversity and current environmental conditions, but they are also influenced by past continen-tal geography and the macroevolutionary processes deter-mining speciation and extinction. According to the habitat theory on macroevolution [1-3], the main pro-moters of speciation and extinction are physical environ-mental changes (tectonics and climatic changes), instead of biotic interactions. Vrba's resource-use hypothesis [4,5], which is included as a part of this theory, stresses the role of the degree of specialization in biome-specific resources on the differences in speciation and extinction rates among clades. Generalists are less susceptible to withdrawal of their resources, to strong directional selec-tion and to vicariance as environments change. This causes lower speciation and extinction rates in generalist species, while they are higher in specialists, which are con-verse in all these respects. The term resource covers a wide range of physical and biotic factors including moisture, temperature, substrate, vegetation cover, food items, and any other environmental components than can be uti-lized by organism [5]. The resource-use hypothesis differs from others regarding how the character "specialist" or "generalist" in a species is related to its distribution on ter-restrial biomes. A species will be considered stenobiomic or eurybiomic according to the number of biomes it is able to inhabit, which are characterized by gross vegeta-tion physiognomy. Thus, a stenobiomic species is restricted to a particular biome, or narrow range of vegeta-tion physiognomy, and its lineage is predicted to have a high speciation rate if it suffers vicariance due to an envi-ronmental change that fragments the distribution of that biome. On the contrary, a linage of eurybiomic species shows a lower speciation rate because it can use resources in more than one biome and, therefore, it is not severely affected by fragmentation of the biomes it inhabits. Under this hypothesis, the faster rate of speciation in stenobi-omic species generates an average bias towards overrepre-sentation of biome specialists in clades and ecosystems over long time periods [5,6].
The resource-use hypothesis was originally conceived by Vrba in 1987 [5] after the study of the African fossil record on large mammalian clades. However, the information known on the fossil record of certain biological groups or geographical areas is far from complete. That is why Hernández Fernández and Vrba in 2005 [7] used the modern assemblage of African large mammals to test this hypothesis. Their analyses appeared to offer support for each of four subsidiary predictions of Vrba's resource-use hypothesis: (1) since clades of biomic specialist species generally have had a high incidence of vicariance, specia-tion and extincspecia-tion, these species should be clearly more numerous than eurybiomic species; (2) certain clades should be more eurybiomic than others because the resources they need to survive may be found in environ-ments which differ vastly in climate; (3) biomes that underwent a high degree of fragmentation during the recurrent environmental extremes of the climatic cycles should have a higher proportion of stenobiomic species than those that have not undergone extensive fragmenta-tion; and finally (4) from the previous prediction, it should be expected that certain combinations of inhab-ited biomes occur more frequently among species than do others. These combinations must be those that include few biomes [7].
maintained frequent terrestrial connections with Eurasia during the last 20 million years [8], South America was an isolated land mass which had no connections with other continents since the final opening of the Drake Passage ca. 30 Ma, which separated it from Western Antarctica, until the Late Pliocene, when the Panamanian land-bridge appeared [9]. Since that time, there was an unparalleled and continuous biotic interchange between South and North America, the so called Great American Biotic Inter-change (GABI) [10-14]. Many mammal groups migrated from one land mass into the other, although the final out-come of this event appears to be favorable to the groups of North American origin. This exchange produced signif-icant changes in the structure of the South American mammal communities [15,16]. The partial replacement of South American autochthonous species by North American immigrants has been attributed to three differ-ent reasons. First, during the GABI new ungulates and car-nivores arrived to South America. The native ungulates (notoungulates, litopterns, pyrotheres, etc.) declined under pressure from novel, placental predators [10]. Meanwhile, the northern ungulates that moved to the new continent found new habitats with the resources they needed [12]. Second, the unbalanced species interchange between the Americas was caused by the disparity in rich-ness of the original species pools due to the differences in size of both continents [17]. The equilibrium theory of island biogeography [18] predicts a migration wave favo-rable to the North American immigrants, which came from a larger continent with a larger species pool [17]. Third, the reason for the unbalance of the GABI has been also placed in the global climatic changes that produced variations in the environments from the isthmian Central America [1,19]. While during the warm and humid peri-ods the tropics were dominated by rainforests, in colder and more arid phases savanna habitats extended broadly through tropical latitudes. Therefore, as Cenozoic climate was getting colder a savanna corridor became increasingly stable between North and South America while the exten-sion of tropical forest shrunk. At the time of the GABI,
when modern glacial cycles were established, only gener-alist species or species specigener-alists of the savanna biome were favored when crossing the corridor between both continents [1]. This latter explanation of the unbalanced result of the GABI may be related to the outcome of some of the predictions of the resource-use hypothesis on the current mammal fauna of South America.
An additional difference between South America and Africa it is based on the incidence that the late Quaternary extinction event had on their mammalian faunas. During the latest Pleistocene-earliest Holocene, land-mammal faunas all around the world changed as a consequence of the so called "megafaunal extinction", an extinction event that mainly affected large mammals. Nevertheless, in spite of its world-wide extension, this event affected on a larger extent the mammalian faunas of North America, South America, and Australia [20-23]. Several hypotheses have been proposed for explain this megafaunal extinction but none has been recognized yet as having larger support than the others [24-31]. According to Cione et al. [30], in South America 80 % of those mammal species weighting over 44 kg (e.g., the horses Equus neogeus and Hippidion principale, the mylodontid Mylodon ibseni, and the bear Arctotherium bonariense), and 100 % of those mammal species weigthing over 1000 kg (e.g., the toxodontid Tox-odon platensis, the ground sloth Megatherium americanum,
and the camel Hemiauchenia paradoxa) became extinct.
[image:3.612.53.564.99.234.2]Consequently, mega-mammals (species > 1000 kg) do not exist in the present-day South American land-mam-mal fauna, and only some individuals of the tapirid Tapi-rus bairdii weighting over 300 kg [32,33]. Conversely, five mega-mammal species and several large mammal ones occur in Africa today [32,34]. Most South American large mammals extinct during this event were grazers or mixed-feeders (e.g., equids, camelids, notoungulates, glypto-donts) and only a few were browsers (e.g., megatheriids). Most of them, specially the mega-mammals, had low abundance, and females probably attained sexual matu-rity late and had a low number of offspring, born after a
Table 1: Climatic typology of Walter [66] and it's correspondence with world vegetation types
Climate zone Zonobiome
I Equatorial Evergreen tropical rain forest
II Tropical with summers rains Tropical deciduous woodland
II/III Transition tropical semiarid Savanna
III Subtropical arid Subtropical desert
IV Winter rain and summers drought Sclerophyllous woodland-shrubland
V Warm-temperate Temperate evergreen forest
VI Tropical temperate Nemoral broadleaf-deciduous forest
VII Arid-temperate Steppe to cold desert
VIII Cold temperate (boreal) Boreal coniferous forest (Taiga)
very long gestation time, i.e. they were k-strategist [30]. Thus, according to the record of disappeared species, it seems that although this event was mainly modulated by species size the ecology of these species could have had a certain role in it. Thus, since in this work we are dealing mainly with the ecological specialization degree of the species, we will discuss whether the megafaunal extinc-tion could have any significant influence in the patterns shown here.
Results and discussion
Distribution of the biomic specialization index (BSI) in South America
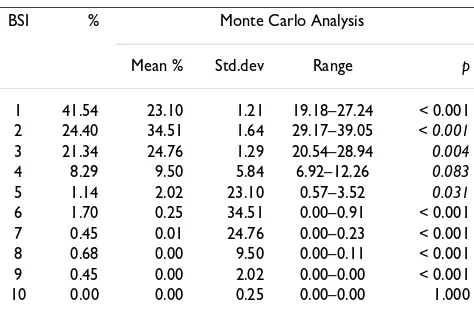
The general frequency distribution of BSI by South Amer-ican mammals is strongly right-skewed (Figure 1). Mean BSI is 2.16. We found that 65.8 % of species inhabit only one or two biomes (BSI = 1, 41.7 % and BSI = 2, 24.1 %). At the other extreme, only a few species inhabits five or more biomes (4.32 %) and none occupied all biomes. To occupy all extreme biomes require a very high degree of versatility, which probably precludes a species from occu-pying all biomes, as already reported Hernández Fernánd-ez & Vrba [7]. Thus, most South American mammal species live in a narrow range of ecological conditions (represented by biomes). Our assemblage shows a signif-icantly higher proportion of biomic specialist species (BSI
= 1) than expected by a random process as modeled by Monte Carlo analysis (Table 2). The proportions of spe-cies with BSI = 2–4 are significantly (or nearly significantly for BSI = 4) lower than estimated by the Monte Carlo model. Although significantly lower, the proportion of species with BSI = 5 is not very different from than expected from the modeled random distribution of spe-cies in biomes. Finally, the proportions of spespe-cies with BSI = 6–9 (there are no South American mammals with BSI = 10) are significantly higher than expected from the null hypothesis (Table 2). These results are broadly consistent with the resource-use hypothesis: a higher proportion of biomic specialist species than generalists. We also found that the proportions of extreme eurybiomic species are higher than expected by a random process. This coincides with the results of Hernández Fernández and Vrba [7] on the African large mammals. These authors argued that extreme eurybiomic species, thanks to their versatility, can survive in the biomes at both climatic extremes of the Milankovitch cycles, which are the cyclical variations in the Earth's eccentricity, axial tilt and precession, and pri-mary cause of the episodic nature of the Earth's climate. These eurybiomic species, therefore, may have propor-tionally lower extinction rates than semi-eurybiomic spe-cies. Thus, the extreme eurybiomic species may have experienced a net increase in species over time as sug-gested by Hernández Fernández and Vrba [7].
Distribution of BSI in mammalian clades
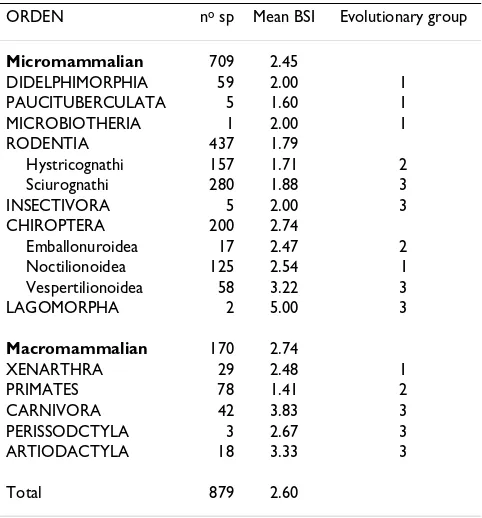
Table 3 shows the mean BSI value for each South Ameri-can mammal group. Figures 2 and 3 compare the BSI his-tograms among mammalian orders.
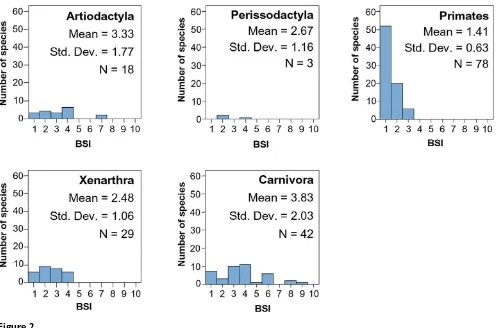
Carnivora is more eurybiomic and generalist than other clades (Figure 2), as suggested by the resource-use
hypoth-Table 2: Proportion of South American mammals species in each BSI and comparison with the Monte Carlo simulations
BSI % Monte Carlo Analysis
Mean % Std.dev Range p
1 41.54 23.10 1.21 19.18–27.24 < 0.001
2 24.40 34.51 1.64 29.17–39.05 < 0.001
3 21.34 24.76 1.29 20.54–28.94 0.004
4 8.29 9.50 5.84 6.92–12.26 0.083
5 1.14 2.02 23.10 0.57–3.52 0.031
6 1.70 0.25 34.51 0.00–0.91 < 0.001
7 0.45 0.01 24.76 0.00–0.23 < 0.001
8 0.68 0.00 9.50 0.00–0.11 < 0.001
9 0.45 0.00 2.02 0.00–0.00 < 0.001
10 0.00 0.00 0.25 0.00–0.00 1.000
N = 1000 simulations. %; proportion of the total number of species (879), p; probability of the proportion of species being greater than or equal to (plain) or lower than or equal to (italics) the observed proportion in the South American mammal fauna.
[image:4.612.58.295.407.637.2]Frequency distribution of biomic specialization index (BSI) for South American mammals
Figure 1
[image:4.612.315.552.536.694.2]esis [5]. Their feeding behavior is very characteristic; they can find their main food resource (meat) in environments which differ vastly in climate because generally they do not need a particular prey species [35].
Xenarthra is one of the most ancient orders in South America, and its histogram shows a distribution within one to four biomes (Figure 2). This is probably due to their differences in feeding. There are insectivore and omnivorous species, which show usually a more eurybi-omic behavior, while herbivore species are more stenobi-omic. Additionally, they show different locomotion adaptations. While Dasypodidae species are terrestrial and usually fossorial, Myrmecophagidae are terrestrial or scansorial, and Megalonychidae and Bradypodidae are arboreal. Obviously scansorial and arboreal species are linked to forest environments while terrestrial species do not have this limitation.
Distribution of BSI in Primates is as expected under the resource-use hypothesis, having a marked dominance of specialist species (Figure 2). It is an order whose species, which are either herbivores or insectivores-frugivores, are
usually restricted to a particular biome. Additionally, they are also strongly related to forested landscapes.
Ungulates are herbivore species and they tend to be spe-cialists restricted to a particular vegetation physiognomy. Therefore, according to the resource-use hypothesis, they should be stenobiomic [7]. Today there are only two South American orders of ungulates, Artiodactyla and Per-issodactyla, both immigrants from North America during the Great American Biotic Interchange (GABI). The spe-cies of both orders are displaced from the specialist extreme of the stenobiomic-eurybiomic gradient (Figure 2). This might be explained because of their very diverse feeding, including fruit, leaves and grasses [32]. Vrba [5] predicted that organisms that both graze and browse, or are omnivores, are likely to be eurybiomic.
The generalist ecological behavior of these ungulates might be due to the biogeographic and evolutionary his-tory of the South American mammalian assemblage and could be related with the differences in evolutionary suc-cess of the native southern ungulates and the northern immigrant ungulates. Four hypothesis proposed in the
[image:5.612.57.554.85.413.2]lit-BSI histograms for macrommamalian orders
Figure 2
erature might be possible explanations for this generalist pattern in ungulates:
(1) There was a savanna corridor between both continents during the GABI. Only generalist species or species spe-cialists of the savanna biome could cross the corridor between North and South America [1]. Many savanna spe-cialist species crossed from North to South America because this biome was abundant in the Northern hemi-sphere. Also North American generalist species crossed it. On the other hand, the appearance of steppe and grass-land habitats in this period reduced the number of native ungulate species [11] and few of them crossed into North America.
[image:6.612.60.553.87.405.2](2) Some studies attribute the loss of large-sized mammal lineages, like native South American ungulates, to the decrease of open vegetation area from the late Pleistocene last glacial maximum to the Holocene climatic optimum [31,36,37].
(3) Under the Blitzkrieg hypothesis [38], the human colo-nization in the late Pleistocene was especially lethal for large species. Nevertheless, human predation of large South American mammals had a marginal role, affecting only to small isolated populations [31]. Brook and Bow-man [39] support this idea of the huBow-man predator role worldwide, although the operational details remain uncertain.
(4) Finally, other hypotheses [30] explain that the extinc-tion of large-sized mammals was due to the combined action of the climatic changes that reduced the areas cov-ered by open vegetation during the latest Pleistocene-ear-liest Holocene, and the pressure exercised by the human hunters, who entered to the continent during the present interglacial.
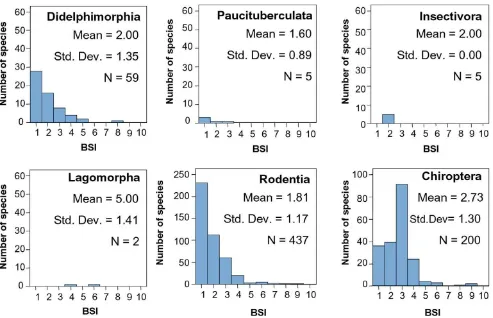
Didelphimorphia has a lot of species and there is a pre-dominance of specialists (Figure 3), despite their insectiv-orous diet. This might be due to their small body size and the characteristics associated to smaller species. Energetic and physiological constraints create a high degree of
spe-BSI histograms for micromammalian orders
Figure 3
cialization in small species [40,41]. Additionally, small-bodied species disperse more slowly and with lower rate of successful establishment in a new area [42], and there-fore they may come to occupy a smaller proportion of their inhabitable biomes. Finally, generation interval is correlated positively with body size [43], which could allow micromammal species to reach greater degrees of specialization in less time than macromammals.
The Rodentia frequency distribution of BSI is strongly right-skewed (Figure 3) due to the high number of species that inhabit in only one biome, which is probably related to their predominantly herbivore feeding. In this case, the difference in their evolutionary origin does not appear to influence the general trend of the order. The BSI propor-tions of each suborder of Rodentia (Figure 4) are very sim-ilar, although the American Hystricomorpha (caviomorphs) derived from Eocene/Oligocene African or Asian immigrants while the other suborders came from North America in the late Neogene. This is to say, they have a very similar distribution on the eurybiomic-steno-biomic gradient but the origins of their lineages are sepa-rated millions of years. However, focusing on the two main suborders, we should stress the fact that, although caviomorph and myomorph rodents are on average
simi-larly specialized, there are relatively large differences in the number of species in these two groups. Hystricomor-pha is an older inhabitant of the continent but now its species number is lower than in Myomorpha. This might be due to the size and reproductive behavior of species in these suborders. While Hystricomorpha includes the larg-est rodents in the world [11] and their growth rate is more similar to macromammals, Myomorpha has the typical growth rate of rodents. The higher reproductive potential of Myomorpha increases their evolutionary capacity. In this way, there are many South American species in the Myomorpha suborder in spite of their relatively recent colonization of the continent.
Chiropterans are moderately generalists (Figure 3). Most of the species have a BSI = 3. Probably, this is due to their flight capacity, which allows them almost free movement between biomes. There are three superfamilian groups of this order in South America (Figure 5). Noctilionoidea and Emballonuroidea are eurybiomic groups that inhabit the Neotropical region although they also have some spe-cialist species. Recent studies [44] suggest that Noctilio-noidea, confined to the Neotropics and the most numerous group of bats in the continent, is autoch-thonous of South America. On the other hand, the origin of Emballonuroidea superfamily is in Africa, coinciding with the arrival of other taxa during the Eocene/Oli-gocene, and its distribution is exclusively tropical on opposite sides of the Atlantic. It is the bat group with less species, which could be due to its more recent arriving to the continent and interspecific competition with Noctilio-noidea species. VespertilioNoctilio-noidea is the chiropteran superfamily with the largest gaps in its known fossil record [44]. This superfamily is Laurasian in origin and, thus, it is included in the third evolutionary phase of the South American Mammals faunas, the groups immigrated from North America during the Pliocene (see Table 3). Vespertilionoidea shows the highest mean BSI of all the bat groups, which is probably related to their North Amer-ican origin and recent colonization of South America.
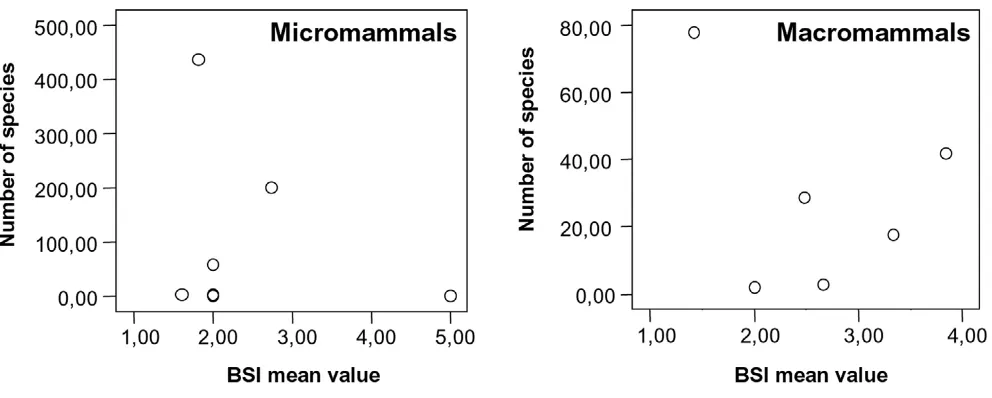
[image:7.612.55.296.109.368.2]The first prediction of the resource-use hypothesis said that generalist species have lower speciation and extinc-tion rates. Thus these species should be clearly less numer-ous than stenobiomic species. However there is no correlation between both variables (Figure 6). To be spe-cialist or generalist species is not the only factor that deter-mines the number of species in each clade. The emergence of the Panamanian land bridge and the climatic changes about 3 million years ago controlled what species crossed between both continents and the survival and adaptation of the native South American species. Furthermore the Andes ranges involve a series of altitudinal surfaces with strong tendency to vicariance due to climatic changes. Two other factors based in these arguments are very
Table 3: Mean BSI value and evolutionary group of each South American mammalian order.
ORDEN no sp Mean BSI Evolutionary group
Micromammalian 709 2.45
DIDELPHIMORPHIA 59 2.00 1
PAUCITUBERCULATA 5 1.60 1
MICROBIOTHERIA 1 2.00 1
RODENTIA 437 1.79
Hystricognathi 157 1.71 2
Sciurognathi 280 1.88 3
INSECTIVORA 5 2.00 3
CHIROPTERA 200 2.74
Emballonuroidea 17 2.47 2
Noctilionoidea 125 2.54 1
Vespertilionoidea 58 3.22 3
LAGOMORPHA 2 5.00 3
Macromammalian 170 2.74
XENARTHRA 29 2.48 1
PRIMATES 78 1.41 2
CARNIVORA 42 3.83 3
PERISSODCTYLA 3 2.67 3
ARTIODACTYLA 18 3.33 3
Total 879 2.60
important to analyze our results. First, the evolutionary origin of the taxon must be taken into account. This factor is composed for many other subsidiary factors like, the unequal biotic interchange between continents and their consequences in immigrants and endemic species, etc [1]. Second, macromammals (MAC) and micromammals (MIC) have very different behavior in relation to biomic specialization. Tectonic and paleoenvironmental changes favor the MIC speciation due to their higher capabilities for fast adaptive radiation [1] and usually smaller ranges [45]. This argument obtains support when comparing the number of MAC and MIC species in Africa and South America in relation to the continental size. South America is smaller than Africa but there is almost no difference between the numbers of MIC in both continents, 773 spe-cies in Africa and 709 in South America. Thus, it seems that in spite of the smaller size of South America their top-ographic characteristics have favored a fast radiation in
MIC species. Meanwhile the lower diversification rates in MAC orders are due to these tectonic and paleoenviron-mental changes and the important contribution of the recent North American immigrants. The gradual pattern of extinction of large mammals species during the Pliocene and the late Quaternary megafaunal extinction event were strong in South America and almost all conti-nents while it was restricted to some large mammals in Africa [46], allowing an increase in the richness of the rest of the large mammals [47]. Therefore, native large mam-mals are much more important herbivores in Africa than in South America. Finally, the post-Pleistocene differences between the abundances of large herbivore mammals on the two continents may be related to different frequencies of nutritionally sufficient habitats [48]. All this might explain the higher number of African MAC (250) and their differences with South America (170).
[image:8.612.146.483.83.471.2]BSI histograms of Rodentia suborders [74]
Figure 4
Proportion of biomic specialists in each biome
The third prediction associated to the resource-use hypothesis states that biomes that underwent major cycles of expansion-retraction and a high degree of fragmenta-tion during the recurrent environmental extremes of the astronomical cycles (Milankovitch cycles) should have a higher proportion of stenobiomic species (BSI = 1) than those that did not undergo extensive fragmentation. At the global scale, these biomes are located in extreme cli-matic conditions [7,49]: tropical rainforest (biome I), subtropical desert (biome III), steppe (biome VII) and tundra (biome IX). Nevertheless, at the continental scale the biomes that suffered such fragmentation may be dif-ferent in each continent, depending on the presence/
absence of these biomes, the biomes present at the geo-graphical extremes of that continent, the internal hetero-geneity of climatic dominions, or the biogeographic structure of the continent.
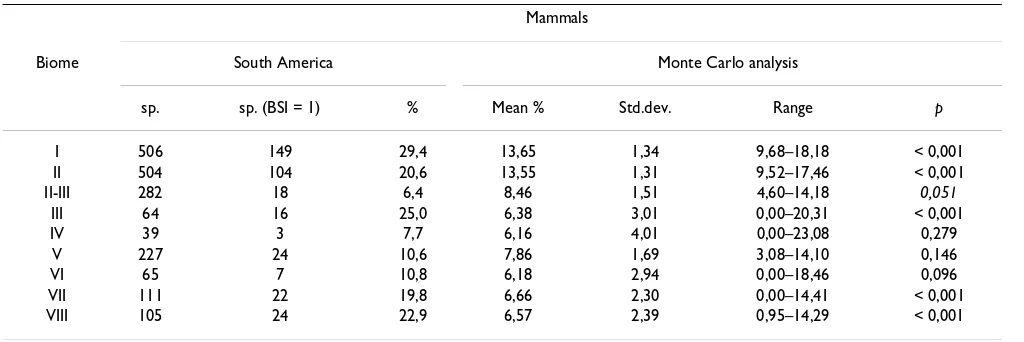
Table 4 shows the results for all South American mam-mals, which support this idea. We can see how the propor-tion of stenobiomic species (BSI = 1) is significantly higher than expected by chance in extreme biomes; tropi-cal rainforest, subtropitropi-cal desert and steppe. However, tropical deciduous woodland (Biome II, Table 1) and boreal coniferous forest (Biome VIII), which are not cli-matically extreme biomes, show also a significantly higher proportion of stenobiomic species than expected by
[image:9.612.60.553.88.262.2]BSI Histograms of Chiroptera superfamilies
Figure 5
BSI Histograms of Chiroptera superfamilies.
[image:9.612.58.554.493.692.2]Relationship between BSI mean value and number of species in each clade of micro- and macromammals
Figure 6
chance. South America suffered about 2.5 Ma a cooling trend with glacier formation and a cycle of expansion and reduction of grasslands and forests [1], species specialists of these biomes should have high extinction and specia-tion rates. Tropical deciduous woodland is mainly located around the equator and along the Andes, sites that suf-fered strongly this process. Additionally, tectonic changes during the late Neogene caused the elevation of the Andes from 2000 to 4000 meters, which allowed the formation of different vegetation belts more o less continuous, anal-ogous to the boreal coniferous forest (Podocarpus forest, VIII) or to the steppe (the montane grasslands so-called Puna, VII). Later on, during successive glacial periods, this Andean vegetation belts underwent extensive vicariance. Thus, the speciation rates increased in species that lived in these biomes [1].
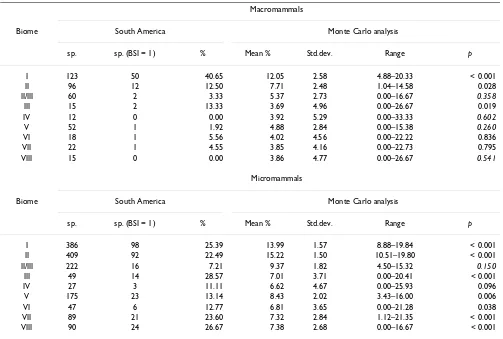
In order to compare our results with the previous ones for the African large mammals [7], we separated ours in mac-romammals (MAC) and micmac-romammals (MIC) (Table 5). The proportion of macromammalian stenobiomic species in South America is significantly higher than expected by chance in biomes I, II, and III, which is comparable to the results for the African faunas [7]. Our results support the resource-use hypothesis because these biomes underwent extensive fragmentation during the cycles of climatic changes along the Cenozoic as stated above. The rest of the biomes show a number of stenobiomic large mam-mals that is not significantly different of the proportion that may be obtained by chance. This might indicate that those biomes did not undergo fragmentation extensive enough for vicariance and speciation events of large mam-mals. It could also be argued that the important late Qua-ternary event of megafaunal extinction might have affected this pattern. Nevertheless, nearly all the South
American extinct large and mega-mammals were adapted to open environments, and many of them were even adapted to arid ones (see [30], and references therein). Therefore, they might have been included as representa-tives of the arid biomes in South America, which probably would give additional support to our conclusions. Any-how, since large organisms are constrained to have rela-tively low population densities, in order to maintain a minimum viable global population large species require large geographic ranges [41] frequently across several biomes, and thus the proportion of strict stenobiomic species within the subset of large and very species is usu-ally very small [34]. Therefore it would be difficult that these few biome specialist species could have statistical influence on our conclusions about the stenobiomic mac-romammals.
[image:10.612.53.565.99.270.2]Nevertheless, in the case of small mammals all the biomes present in South America, except II/III and IV, showed sig-nificantly more stenobiomic species than expected after the Monte Carlo modeling. This included not only the hypothetical extreme biomes but also climatically transi-tional biomes like II, V, VI and VIII. Differences in the physiology, adaptations and ecology of small mammals may be responsible for the differences found between small and large mammals. For example, the proportion of specialist species for MIC in the deserts (III) is 28.57 %, which is double than for MAC (13.33 %). Desert biome requires a high degree of specialization in morphology, physiology and behavior, which smaller species probably can get faster than large mammals, due to their lower gen-eration intervals [43]. Also, global climatic changes during the Plio-Pleistocene caused a higher degree of vicariance in the Andes region favoring the radiation of MIC orders, while MAC species had lower time to adapt and specialize
Table 4: Stenobiomic number species (BSI = 1) in South American mammals
Mammals
Biome South America Monte Carlo analysis
sp. sp. (BSI = 1) % Mean % Std.dev. Range p
I 506 149 29,4 13,65 1,34 9,68–18,18 < 0,001
II 504 104 20,6 13,55 1,31 9,52–17,46 < 0,001
II-III 282 18 6,4 8,46 1,51 4,60–14,18 0,051
III 64 16 25,0 6,38 3,01 0,00–20,31 < 0,001
IV 39 3 7,7 6,16 4,01 0,00–23,08 0,279
V 227 24 10,6 7,86 1,69 3,08–14,10 0,146
VI 65 7 10,8 6,18 2,94 0,00–18,46 0,096
VII 111 22 19,8 6,66 2,30 0,00–14,41 < 0,001
VIII 105 24 22,9 6,57 2,39 0,95–14,29 < 0,001
themselves in these areas. In this sense, the number of ste-nobiomic species in the Podocarpus forest (Biome VIII) is very high in MIC (26.67 %), while there are no MAC spe-cies exclusive of this biome. Along the Andes MIC moved faster to the south of the continent than MAC and, accord-ing to Ortiz-Jaureguizar and Cladera [50], the southern steppes (VII) underwent several pulses of expansion and retraction, due to the glacier formation, just like the nemoral broadleaf-deciduous forest (VI) in relation to their position in the continent. Hence, our MIC results show a high degree of specialist species in theses biomes. The proportion of stenobiomic MIC species in biome V is also higher than expected by chance, which may indicate a trend to contraction-expansion and associated fragmen-tation for this biome. This result could be associated to the fact that the South American climatic dominions of this biome are mainly surrounded by biomes with a drought period, which might influence in the capabilities of the species inhabiting this biome to occupy other neighbor-ing biomes.
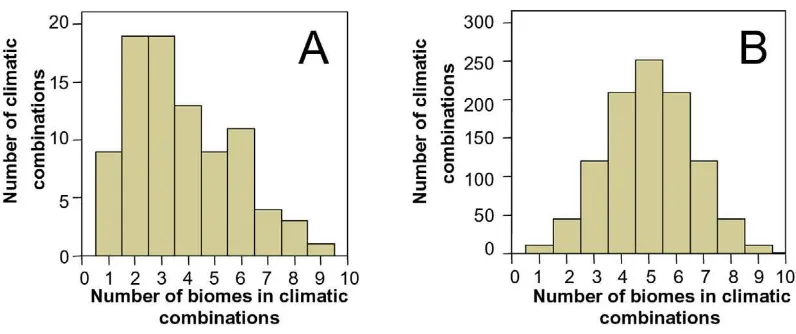
Climatic combinations
We can see a substantial difference between the number and distribution of potential total climatic combinations (PTCC) and the actual climatic combinations present in the assemblage of all South American mammals (Figure 7). We found 88 climatic combinations of the 1023 potential climatic combinations (Table 6). Our results indicate that there are significantly more combinations of few biomes than expected in a random selection of com-binations from the PTCC (χ2 = 860.4, d
0F = 9, p < 0.001).
[image:11.612.54.557.99.438.2]The most frequent combinations are I (147 species), I-II-II/III (118), I-II (112) and II (104). Other frequent com-binations are I-II-II/III-V (54), I-II-V (26), V (24), VIII (24), II-II/III (23), VII (22), II/III (18), VII-VIII (17), III (16), V-VIII (12), II-V (12) and I-V (11). Therefore, the most frequent combinations among South American mammals imply few biomes, and these are the biomes that suffered most fragmentation during the Milankovitch cycles.
Table 5: Stenobiomic number species (BSI = 1) in South American macromammals and micromammals
Macromammals
Biome South America Monte Carlo analysis
sp. sp. (BSI = 1) % Mean % Std.dev. Range p
I 123 50 40.65 12.05 2.58 4.88–20.33 < 0.001
II 96 12 12.50 7.71 2.48 1.04–14.58 0.028
II/III 60 2 3.33 5.37 2.73 0.00–16.67 0.358
III 15 2 13.33 3.69 4.96 0.00–26.67 0.019
IV 12 0 0.00 3.92 5.29 0.00–33.33 0.602
V 52 1 1.92 4.88 2.84 0.00–15.38 0.260
VI 18 1 5.56 4.02 4.56 0.00–22.22 0.836
VII 22 1 4.55 3.85 4.16 0.00–22.73 0.795
VIII 15 0 0.00 3.86 4.77 0.00–26.67 0.541
Micromammals
Biome South America Monte Carlo analysis
sp. sp. (BSI = 1) % Mean % Std.dev. Range p
I 386 98 25.39 13.99 1.57 8.88–19.84 < 0.001
II 409 92 22.49 15.22 1.50 10.51–19.80 < 0.001
II/III 222 16 7.21 9.37 1.82 4.50–15.32 0.150
III 49 14 28.57 7.01 3.71 0.00–20.41 < 0.001
IV 27 3 11.11 6.62 4.67 0.00–25.93 0.096
V 175 23 13.14 8.43 2.02 3.43–16.00 0.006
VI 47 6 12.77 6.81 3.65 0.00–21.28 0.038
VII 89 21 23.60 7.32 2.84 1.12–21.35 < 0.001
VIII 90 24 26.67 7.38 2.68 0.00–16.67 < 0.001
The four most eurybiomic species of the continent (BSI = 9) belong to three different orders and have the same cli-matic combination (I-II-II/III-III-IV-V-VI-VII-VIII), inhab-iting all the biomes present in South America. We should stress that, although this combination is the same for all of them, each species inhabits in different areas and their distribution is latitudinal or altitudinal around the Andes. So, their comparison is limited. These species are the red bat (Lasiurus borealis), big brown bat (Eptesicus fuscus),
puma (Puma concolor) and mountain vizcacha (Lagidium
viscacia). Both chiropterans are vespertilionoid insecti-vores taking a wide variety of flying arthropods [51]. Thus, their high BSI may be related to their origin as North American immigrants. The puma is a very adaptable car-nivorous species that can find food easily in any biome [52], tolerating almost any type of environment and land-scape [53]. Finally, the mountain vizcachia is a rodent with a generalist diet that allows it to eat almost any kind of plant, including lichens, moss, and grass [32]. Biome generalist species stand out for ecological versatility, either latitudinal like puma which has an extension from Canada (64° N) to the South of Argentina (53° S) cross-ing all climatic zones, or altitudinal like the guanaco (Lama guanicoe), ranging from sea level to an elevation of 4000 m [32] and with a BSI = 7.
All South American biomes show very similar values for the ratio between the number of extreme eurybiomic spe-cies and the number of extreme eurybiomic climatic com-binations (Table 7). One interesting issue arises when we compare our results about extreme generalist species (BSI
≥ 5) in South America with those for Africa [7]. To
com-pare with Africa we study the 170 macromammalian spe-cies in South America, of which only thirteen spespe-cies are
extreme generalists (7.6 %). The evergreen tropical rain-forest (I) in Africa had a lower number of extreme eurybi-omic species per climatic combination (1.6) than the other biomes in the same continent (all around 2.5). However, in South America our results are very different; there is a very low and similar number of eurybiomic spe-cies per climatic combination in all biomes, approxi-mately 1 (Table 7). These results appear to be against the previous interpretation of a possible lesser ecological overlapping among generalists in the rainforest than in other biomes [7]. This might be due to the fact that cavio-morph rodents are included among micromammals but the body size of many of their species is comparable to the one in macromammals. Therefore, they might be occupy-ing ecological niches that are occupied by some African ruminants. In this case, the late Quaternary extinction event might have influence on this pattern only if there was a selective extinction of extreme eurybiomic species
(BSI ≥ 5), which seems improbable because most of the
extinct South American large mammals were adapted to open environments instead of being very generalist spe-cies.
Conclusion
The resource-use hypothesis [4,5] explains a great deal of the habitat theory [1,2], which downplays the role of biotic interactions, like predation or competition, as initi-ating causes of extinctions and speciation events. It sug-gests as the main promoters of speciation and extinction the physical environmental changes due to tectonics and global climatic change [1], which through the associated vicariance effect induce to the speciation. Therefore, habi-tat and evolutionary changes are joined [3]. Several recent works have obtained results in agreement with this the
[image:12.612.105.503.88.255.2]Frequencies of climatic combinations, in terms of numbers of biomes inhabited by South American mammals species
Figure 7
Table 6: Climatic combinations in South America terrestrial mammals today
Climatic combinations No biomes Sp.
I 1 147
I-II 2 114
I-II-II/III 3 118
I-II-II/III-III 4 1
I-II-II/III-III-IV 5 1
I-II-II/III-III-IV-V 6 2
I-II-II/III-III-IV-V-VI-VII 8 2
I-II-II/III-III-IV-V-VI-VII-VIII 9 4
I-II-II/III-III-V 5 2
I-II-II/III-III-V-VI-VII 7 1
I-II-II/III-III-V-VII-VIII 7 1
I-II-II/III-III-V-VIII 6 1
I-II-II/III-III-VII 5 1
I-II-II/III-IV-V-VI-VII-VIII 8 1
I-II-II/III-IV-V-VII 6 1
I-II-II/III-V 4 54
I-II-II/III-V-VI-VII 6 1
I-II-II/III-V-VI-VII-VIII 7 1
I-II-II/III-V-VII-VIII 6 2
I-II-II/III-V-VIII 5 1
I-II-III-V-VII-VIII 6 1
I-II-V 3 26
I-II-V-VIII 4 2
I-II/III 2 1
I-II/III-V 3 4
I-V 2 11
I-V-VIII 3 2
II 1 104
II-II/III 2 23
II-II/III-III 3 2
II-II/III-III-IV-V 5 1
II-II/III-III-IV-V-VI-VII-VIII 8 3
II-II/III-III-IV-V-VII 6 1
II-II/III-III-IV-VI-VII 6 2
II-II/III-III-VII-VIII 5 1
II-II/III-IV-V-VII-VIII 6 1
II-II/III-V 3 4
II-II/III-V-VI-VII-VIII 6 1
II-II/III-V-VII-VIII 5 1
II-II/III-VII 3 1
II-II/III-VIII 3 1
II-III 2 1
II-V 2 12
II-V-VII-VIII 4 1
II-V-VIII 3 3
II-VII 2 1
II-VIII 2 1
II/III 1 18
II/III-III 2 1
II/III-III-IV 3 1
II/III-III-IV-V-VI-VII 6 1
II/III-III-IV-V-VI-VII-VIII 7 1
II/III-III-IV-VII 4 1
II/III-III-V 3 1
II/III-III-V-VI-VII-VIII 6 1
II/III-III-VI-VII 4 4
II/III-III-VII-VIII 4 1
ory. Jaramillo et al. [54] showed that plants diversity in the tropics is variable through time and correlates with long-term global climatic changes. Similar conclusions have been attained by van Dam et al. [55] when studying the changes in richness of the rodent faunas from the Ibe-rian Neogene.
Although our results on the South American mammal assemblage are roughly concordant with the premises of the resource-use hypothesis, we have found striking differ-ences with a previous study based on the African large mammal fauna [7]. To explain these differences between Africa and South America we should pay attention to three different aspects. First, the evolutionary and
biogeo-II/III-V 2 4
II/III-V-VII-VIII 4 1
II/III-VI-VII 3 2
II/III-VII 2 2
III 1 16
III-IV 2 1
III-IV-V-VI 4 2
III-IV-VII-VIII 4 1
III-V-VI-VII 4 1
III-VI 2 1
III-VII-VIII 3 2
IV 1 3
IV-V-VI 3 5
IV-V-VI-VII 4 1
IV-V-VI-VII-VIII 5 1
IV-VI-VIII 3 2
V 1 24
V-VI 2 4
V-VI-VII 3 5
V-VI-VII-VIII 4 3
V-VII 2 3
V-VII-VIII 3 7
V-VIII 2 12
VI 1 7
VI-VII 2 4
VI-VII-VIII 3 1
VI-VIII 2 1
VII 1 22
VII-VIII 2 17
VIII 1 24
Total species 879
[image:14.612.57.570.87.430.2]See Table 1 for roman numerals, which refer to biomes. No biomes, number of inhabited biomes; Sp., species number
Table 6: Climatic combinations in South America terrestrial mammals today (Continued)
Table 7: Number of extreme eurybiomic species (BSI ≥ 5) in south American biomes
All species Macromammalia
Biome sp (BSI ≥ 5) N.cc. (BSI ≥ 5) sp/n.cc sp (BSI ≥ 5) N.cc. (BSI ≥ 5) sp/n.cc
I 23 16 1.40 7 6 1.16
II 34 24 1.42 11 10 1.10
II/III 37 27 1.37 12 11 1.09
III 24 17 1.41 8 8 1.00
IV 23 15 1.53 9 8 1.12
V 34 25 1.36 12 11 1.09
VI 21 14 1.50 9 8 1.12
VII 30 22 1.36 12 11 1.09
VIII 23 17 1.35 8 8 1.00
[image:14.612.55.556.572.718.2]graphic histories of both continents are very different. South America's isolation during most of the Cenozoic and the late timing of connection with North America through the Panamanian land-bridge [56], which acted as an ecological filter that only favored the dispersal of gen-eralist species or species specialized in savanna biome [1], provoked a situation of unbalance in the modern assem-blage of South American mammals. This unbalance appears to be stronger in large herbivorous mammals than in other groups, because autochthonous ungulates disappeared in a large extent from South America due to changes in the continental environmental setting, and to the influence of the Pleistocene megafaunal extinction. This event was stronger in this continent with respect to Africa [46]. Second, the Andean orogeny and sub-Andean activity have helped to create a landscape of great eleva-tional, climatic, and edaphic complexity, especially in Western Amazonia [57]. The Andes mountain range has many elevations along the continent with differential environments from its nearby lowlands. Thus, the eleva-tion of the Andes is responsible for the high number of cli-matic combinations in South America in comparison with Africa, which has much less mountain ranges in its geog-raphy. Higher heterogeneity associated to mountain ranges is usually associated to higher species richness [58,59]. Third, small species show a behavior much more prone to specialization whatever the biome they inhabit, which is probably related to their higher reproductive rates, energetic and physiological constraints and gener-ally smaller geographical distributions. Fingener-ally, although data on biomic specialization of species extinct during the late Quaternary megafaunal extinction event are not avail-able, it seems improbable that its effect on the general pat-tern that we have shown here was significant enough to modify any of our conclusions, despite of the importance of this event on the assembly (or disassembly) of the modern South American mammalian fauna.
Methods
Data
The study area was the South American landmass. It excludes all offshore islands. The data represent the geo-graphical distributions of all the modern terrestrial mam-mals occurring within South America; 709 micromammal species (Didelphimorphia, Paucituberculata, Microbioth-eria, Insectivora, Chiroptera, Rodentia and Lagomorpha) and 170 macromammals (Xenarthra, Primates, Car-nivora, Perissodactyla and Artiodactyla). The extinct spe-cies and spespe-cies introduced by humans were omitted. For taxonomic consistency, we followed the species-level tax-onomy of Wilson & Reeder [60].
Distribution ranges for the species were obtained mainly from the literature [33,51,61] and completed with Nowak [32], Macdonald [62] and the data bases InfoNatura [63]
and World Wildlife Fund [64] for the species not present in the previous sources. For the species whose geographic range leaves South America we also used Hall [65].
Measure of biomic specialization
There exist diverse measures of ecological specialization, as number of habitats occupied by a taxon, number of types of food the taxon uses, body mass, and number of subtaxa per taxon (see references in [7]). However, the resource-use hypothesis suggests some predictions which require a measure linked to the biomes where a species inhabits [1]. Thus, we followed Hernández Fernández and Vrba [7], which suggested the biomic specialization index (BSI) as a new specialization measure that can be used at the global scale or in different taxa.
Climatic typology
We used the climatic classification of Walter [66], summa-rized in Table 1, which show 10 climatic zones that were mapped in Allué Andrade [67]. We use the terms biome and zonobiome synonymously, and we recognize that there is a one-to-one correspondence between these and the climatic zones (Table 1). South America has eight lat-itudinal climatic zones today, I-VIII.
[image:15.612.313.555.525.720.2]Sixteen climatic dominions, which are continuous terres-trial areas within one climate zone only [68], have been determined for the South American continent (Table 8, Figure 8). Since the altitudinal gradient represents a habi-tat series analogous to that of biomes in a latitudinal gra-dient [69-71], we also took into account latitudinal and altitudinal climatic zones.
Table 8: South American climatic dominions
Abbr. Name Climate zone
I (C) Amazon rainforest I
I (NO) Colombian Choco rainforest I
I (E) Brazilian Atlantic forest I
II (NO) Andean Tropical dry forest II
II (C) Brazilian Cerrado II
II (N) Llanos of Venezuela II
II/III (E) Caatinga shrubland II/III
II/III (S) Chaco and Pampa grassland and Shrubland II/III
II/III (N) Maracaibo shrubland II/III
III (N) Atacama desert III
III (S) Monte desert III
IV (SO) Sclerophyllous Chilean shrubland IV
V (SE) Guarani subtropical forest V
V (SO) Valdivian warm temperate forest V VI (SO) Magellanic subpolar forest VI
VII (SE) Patagonian grassland VII
Bioclimatic characterization of species
The degree of biomic specialization of all South American mammals was investigated using the biomic specializa-tion index (BSI) developed by Hernández Fernández and Vrba [7], which is the number of climate zones (biomes) inhabited by it. Thus, for most specialized species BSI equals 1, whereas for generalist species it could be as high as 10. The number of climate zones inhabited by a species is determined by the relative size of its geographical range [68]. If 15% or more of the geographical range of a species is situated within a climate zone, the species is considered to occupy that climate zone. It is also considered to occupy a specific climate zone when the species inhabits 50 % or more of one climatic dominion. The occurrence of each species in a climate zone or climatic dominion was determined by overlaying the mapped species distri-butions onto a base map of these biogeographical regions. Where a species occurred only very marginally in a region, it was not included. Finally, the presence in a mountain vegetation belt was also recorded as presence in the corre-sponding analogous climate zone [7].
We define biomic specialists, or stenobiomic species, as those with a BSI = 1. Thus generalist species are those with a BSI > 1. This latter category may be subdivided in two groups [7]: "semi-eurybiomic species" for those species with 1 < BSI < 5; and "extreme eurybiomic species" are those with BSI ≥ 5. BSI = 5 is considered the limit between semi-euribiomic and extreme eurybiomic species because those species that are able to inhabit five or more different biomes must confront very different environment condi-tions both in terms of temperature (e.g., from tropical rainforest to temperate evergreen forest) and rainfall (e.g., from rainforest to desert).
Analyses Monte Carlo
Using Monte Carlo simulations we tested the prediction that a non-random process has generated significantly more biomic specialist species than eurybiomic species. We set up a null hypothesis, which assumes that the observed presences-absences of each species are randomly placed among biomes. Nevertheless we fixed the number of species in each biome as the observed in South America today [7]. This process was repeated 1000 times for the total number of species in order to obtain null distribu-tions of the frequency estimates for the percentage of spe-cies at each BSI.
To test whether extreme biomes have a higher proportion of biomic specialist species than the rest of biomes, the Monte Carlo simulations were employed too. The null hypothesis states that any difference between the propor-tion of stenobiomic species (BSI = 1) in each biome could have been resulted by chance.
Climatic combinations
We studied the different combinations of biomes that are today inhabited by the South American mammals and recorded the number of species in each of these tions. The potential total number of climatic combina-tions (PTCC) that could be expected in the present world with 10 climate zones can be calculated with the formula:
In order to compare this potential number of climatic combinations with the observed frequencies in the South American mammals, we calculated a χ2.
Authors' contributions
AMB and AAR conducted the gathering of data and per-formed all the data analyses. AMB developed the idea for the manuscript, wrote and co-edited all drafts, and pre-pared the final version of the manuscript. AAR co-edited the final drafts. MHF conceived, designed and
coordi-PTCC= Ci= + + + + + + + + + =
=
∑
10 1 10 45 120 210 252 210 120 45 10 1023 110
[image:16.612.55.298.85.418.2]i Map of South American climatic dominions
Figure 8
nated the study, initiated the project, facilitated the gath-ering of contributors, co-refined the intellectual content, co-edited all drafts, and coordinated the authorship sur-vey. AMB and MHF are the guarantors for the integrity of the article as a whole. EO-J and JM co-edited the final drafts and co-refined the intellectual content and scope. All authors read and approved the final manuscript.
Acknowledgements
We thank Marta Andrés Rodrigo (University of Zaragoza) for assistance with mathematical grammar. Comments by three anonymous referees helped to improve the original manuscript. This study was partially sup-ported by the Complutensian University of Madrid (PR1/06-14470-B) and the Spanish Ministry of Education and Science (CGL2004-004000/BTE, CGL2005-03900/BTE, CGL2006-01773/BTE). The Complutensian Univer-sity of Madrid and the Madrid Autonomous Community provided a grant to the Research Group UCM-CAM 910607 on Evolution of Cenozoic Mammals and Continental Palaeoenvironments, which is directed by Marián Álvarez Sierra (UCM). M.H.F has an UCM research contract from the pro-gram "Ramón y Cajal" of the Spanish Ministry of Education and Science.
References
1. Vrba ES: Mammals as key to evolutionary theory. J Mammal
1992, 73:1-28.
2. Vrba ES: On the connections between Paleoclimate and evo-lution. In Paleoclimate and Evolution with Emphasis on Human Origins
Edited by: Vrba ES, Denton GH, Partridge TC, Burckle LH. New Haven: Yale University Press; 1995:24-45.
3. Vrba ES: Habitat theory in relation to the evolution in African Neogene biota and hominids. In African Biogeography, Climate change and Human evolution Edited by: Bromage TG, Schrenk F. New York: Oxford University Press; 1999:19-39.
4. Vrba ES: Evolution, species and fossils: How does life evolve? S Afr J Sci 1980, 76:61-84.
5. Vrba ES: Ecology in relation to speciation rates; some case his-tories of Miocene-Recent mammal Clades. Evol Ecol 1987,
1:283-300.
6. Vrba ES: What are the biotic hierarchies of integration and linkage? In Complex Organismal Functions: Integration and Evolution in Vertebrates Edited by: Wake DB, Roth G. New York: John Wiley & Sons; 1989:379-401.
7. Hernández Fernández M, Vrba ES: Macroevolutionary processes and biomic specialization: testing the resource-use hypothe-sis. Evol Ecol 2005, 19:199-219.
8. van der Made J: Intercontinental relationship Europe-Africa and the Indian subcontinent. In The Miocene Land Mammals of Europe Edited by: Rössner GE, Heissig K. Munich: Dr. Friedrich Pfeil; 1999:457-472.
9. Mikolajewicz U, Maier-Reimer E: Effect of Drake and Panama-nian gateways on the circulation of an ocean model. Paleoce-anography 1993, 8:409-426.
10. Webb SD: Mammalian faunal dynamics of the Great Ameri-can Interchange. Paleobiology 1976, 2:216-234.
11. Marshall LG: The Great American Interchange – An invasion induced crisis for south American Mammals. In Biotic Crises in Ecological and Evolutionary Time Edited by: Nitecki MH. New York: Academic Press; 1981:133-229.
12. Stehli FG, Webb SD: The Great American Interchange New York: Ple-num Press; 1985.
13. Marshall LG: Land Mammals and the Great American Inter-change. Am Sci 1988, 76:380-388.
14. Pascual R, Ortiz-Jaureguizar E, Prado JL: Land mammals: para-digm for Cenozoic South American geobiotic evolution. Münchner Geowissenschaftliche Abhandlungen 1996, 30:265-319. 15. Alberdi MT, Ortiz-Jaureguizar E, Prado JL: Evolución de las
comu-nidades de mamíferos continentales del Cenozóico Superior de la provincia de Buenos Aires, Argentina. Revista Española de Paleontología 1995, 10:30-36.
16. Croft DA: Cenozoic environmental change in South America as indicated by mammalian body size distributions (ceno-grams). Divers Distrib 2001, 7:271-287.
17. Marshall LG, Webb SD, Sepkoski JJ, Raup DM: Mammalian Evolu-tion and the Great American Interchange. Science 1982,
215:1351-1357.
18. MacArthur RH, Wilson EO: An equilibrium theory of insular zoogeography. Evolution 1963, 17:73-387.
19. Webb SD: Ecogeography and the Great American Inter-change. Paleobiology 1991, 17:266-280.
20. Martin PS, Klein RG: Quaternary Extinctions: A Prehistoric Revolution Tuc-son: University of Arizona Press; 1984.
21. Beck MW: On discerning the cause of Pleistocene megafaunal extinctions. Paleobiology 1996, 22:91-103.
22. Brook BW, Bowmann MJS: Explaining the Pleistocene megafau-nal extinctions: Models, chronologies, and assumptions. P Natl Acad Sci USA 2004, 99(23):14624-14627.
23. Barnosky AD, Koch PL, Feranec RS, Wing SL, Shabel AB: Assesing the causes of Late Pleistocene extinctyions on the conti-nents. Science 2004, 306:70-75.
24. Marshall LG: Who killed cock robin? An investigation of the extinction controversy. In Quaternary Extinctions: A Prehistoric Rev-olution Edited by: Martin PS, Klein RG. Tucson: University of Arizona Press; 1984:785-809.
25. Martin PS: Prehistoric overkill: the global model. In Quaternary Extinctions: A Prehistoric Revolution Edited by: Martin PS, Klein RG. Tuc-son: University of Arizona Press; 1984:354-403.
26. Webb SD: Late Cenozoic mammal dispersals between the Americas. In The Great American Biotic Interchange Edited by: Stheli F, Webb SD. New York: Plenum Press; 1985:357-386.
27. Politis GG, Prado JL, Beukens RP: The human impact in Pleis-tocene-Holocene extinction in South America: the Pampean case. In Ancient Peoples and Landscapes Edited by: Johnson E. Lubbok: Museum of Texas Tech University; 1995:187-205.
28. MacPhee RDE, Marx PA: The 40,000-year plague: humans, hyperdisease, and first-contact extinctions. In Natural Change and Human Impact in Madagascar Edited by: Goodman SM, Patterson BD. Washington, DC: Smithsonian Institution Press; 1997:169-217. 29. Owen-Smith N: Pleistocene extinction: the pivotal role of
megaherbivores. Paleobiology 1997, 13:351-362.
30. Cione AL, Tonni EP, Soibelzon L: The broken zig-zag: Late Ceno-zoic large mammal and tortoise extinction in South Amer-ica. Revista del Museo Argentino de Ciencias Naturales 2003, 5:1-19. 31. de Vivo M, Carmignotto P: Holocene vegetation change and the
mammal faunas of South America and Africa. J Biogeogr 2004,
31:943-957.
32. Nowak RM: Walker's Mammals ot the WorldVolume 1–2. Baltimore: The Johns Hopkins University Press; 1999.
33. Eisenberg JF, Redford KH: Mammals of the Neotropics, Ecuador, Bolivia, BrazilVolume 3. Chicago: The University of Chicago Press; 1999. 34. Hernández Fernández M, Vrba ES: Body size, biomic
specializa-tion and range size of African large mammals. J Biogeogr 2005,
32:1243-1256.
35. Malo AF, Lozano J, Huertas DL, Virgós E: A change of diet from rodents to rabbits (Oryctolagus cuniculus). Is the wildcat (Felis silvestris) a specialist predator? J Zool 2004, 263:401-407. 36. Menegaz AN, Goin FJ, Ortiz-Jaureguizar E: Análisis morfológico y
morfométrico multivariado de los representantes fósiles y vivientes del género Lama (Artiodactyla, Camelidae). Sus implicancias sistemáticas, biogeográficas, ecológicas y biocronológicas. Ameghiniana 1989, 26:153-172.
37. Alberdi MT, Leone G, Tonni EP: Evolución biológica y climática de la Región Pampeana durante los últimos cinco millones de años. Un ensayo de correlación con el Mediterráneo Occidental Madrid: Museo Nacional de Ciencias Naturales, CSIC; 1995.
38. Martin PS: The Discovery of America – The first Americans may have swept the western Hemisphere and decimated its fauna within 1000 years. Science 1973, 179:969-974.
39. Brook BW, Bowman DMJS: The uncertain blitzkrieg of Pleis-tocene megafauna. J Biogeogr 2004, 31:517-523.
40. Brown JH, Nicoletto PF: Spatial scaling of species composition: body masses of North American land mammals. Am Nat 1991,
138:1478-1512.
41. Brown JH, Maurer BA: Macroecology: the division of food and space among species on continents. Science 1989,
Publish with BioMed Central and every scientist can read your work free of charge
"BioMed Central will be the most significant development for disseminating the results of biomedical researc h in our lifetime."
Sir Paul Nurse, Cancer Research UK
Your research papers will be:
available free of charge to the entire biomedical community
peer reviewed and published immediately upon acceptance
cited in PubMed and archived on PubMed Central
yours — you keep the copyright
Submit your manuscript here:
http://www.biomedcentral.com/info/publishing_adv.asp
BioMedcentral 42. Gaston KJ, Blackburn TM: Conservation implications of
geo-graphic range size-body size relationships. Conserv Biol 1996,
10:638-646.
43. Eisenberg JF: The behavioral/ecological significance of body size in the Mammalia. In Body size in Mammalian Paleobiology: Esti-mation and Biological Implications Edited by: Damuth J, MacFadden BJ. Cambridge: Cambridge University Press; 1990:25-37.
44. Teeling EC, Springer MS, Madsen O, Bates P, O'Brien SJ, Murphy WJ:
A Molecular Phylogeny for Bats illuminates Biogeography and the fossil Record. Science 2005, 307:580-584.
45. Brown JH: Macroecology Chicago: The University of Chicago Press; 1995.
46. Lyons SK, Smith FA, Brown JH: Of mice, mastodons and men: human-mediated extinctions on four continents. Evol Ecol Res
2004, 6:339-358.
47. Nieto M, Hortal J, Martínez-Maza C, Morales J, Ortiz-Jaureguizar E, Pelaez.Campomanes P, Pickford M, Prado JL, Rodríguez J, Senut B, Soria D, Varela S: Historical determinants of mammals diver-sity in Africa: Evolution of mammalian body mass distribu-tion in Africa and South America during Neogene and Quaternary times. In African Biodiversity: Molecules, Organisms, Eco-systems Edited by: Huber BA, Sinclair BJ, Lampe KH. Berlin: Springer; 2005:287-295.
48. McNaughton SJ, Sala OE, Oesterheld M: Comparative ecology of Africa and South America Arid to Suhumid Ecosystems. In
Biological Relations between Africa and South America Edited by: Gold-blatt P. New Haven: Yale University Press; 1993:548-567.
49. Hernández Fernández M: Análisis paleoclimático y paleoecológico de las sucesiones de mamíferos del Plio-Pleistoceno de la Península Ibérica
Madrid: Servicio de Publicaciones de la Universidad Complutense de Madrid; 2005.
50. Ortiz-Jaureguizar E, Cladera GA: Paleoenvironmental evolution of southern South America during the Cenozoic. J Arid Environ
2006, 66:498-532.
51. Eisenberg JF: Mammals of the Neotropics, The Northern Neotropics: Pan-ama, Colombia, Venezuela, Guyana, Suriname, French GuianaVolume 1. Chicago: The University of Chicago Press; 1989.
52. Logan KA: Desert Puma: Evolutionary Ecology and Conservation of an Enduring Carnivore Washington DC: Island Press; 2001.
53. Grzimek B: Grzimek's Encyclopedia of MammalsVolume 3. New York: Mc Graw Hill; 1988.
54. Jaramillo C, Rueda Milton J, Mora G: Cenozoic Plant Diversity in the Neotropics. Science 2006, 311:1893-1896.
55. van Dam JA, Abdul Aziz H, Álvarez Sierra MA, Hilgen FJ, van den Hoek Ostende LW, Lourens LJ, Mein P, van der Meulen AJ, Peláez-Campomanes P: Long-period astronomical forcing of mammal turnover. Nature 2006, 443:687-691.
56. Flynn JJ, Wyss AR: Recent advances in South American mam-malian paleontology. Tree 1998, 13:449-454.
57. Mckey D, Davidson DW: Ant-Plant sycioses in Africa and the Neotropics: History, Biogeography and Diversity. In Biological Relations between Africa and South America Edited by: Goldblatt P. New Haven: Yale University Press; 1993:568-606.
58. Rahbek C, Graves GR: Multiscale assessment of patterns of avian species richness. P Natl Acad Sci USA 2001, 98:4534-4539. 59. Ruggiero A, Kitzberger T: Environmental correlates of mammal
especies richness in South America: effects of spatial struc-ture, taxonomy and geographic range. Ecography 2004,
27:401-416.
60. Wilson DE, Reeder DM: Mammal species of the World; A taxonomic and geographic reference Washington: Smithsonian Institution Press; 1993. 61. Redford KH, Eisenberg JF: Mammals of the Neotropics, The Southern Cone: Chile, Argentina, Uruguay, ParaguayVolume 2. Chicago: The Uni-versity of Chicago Press; 1992.
62. Macdonald D: The New Encyclopedia of Mammals Oxford: Oxford Uni-versity Press; 2001.
63. InfoNatura: Aves, Mamíferos y Anfibios de América Latina
[http://www.natureserve.org/infonatura]
64. WildFinder: World Wildlife Fund Database [http:// www.worldwildlife.org/wildfinder]
65. Hall R: The Mammals of North America New York: John Wiley and Sons; 1981.
66. Walter H: Vegetationszonen undKlima Stuttgart: Eugen Ulmer; 1970. 67. Allué Andrade JL: Atlas fitoclimático de España. Monografías del
Instituto Nacional de Investigaciones Agrarias 1990, 69:1-223.
68. Hernández Fernández M: Bioclimatic discriminant capacity of terrestrial mammal faunas. Global Ecol Biogeogr 2001,
10:189-204.
69. Walter H, Breckle S-W: Ecological Systems of the Geobiosphere. Ecolog-ical Principles in Global PerspectiveVolume 1. Berlin: Springer-Verlag; 1985.
70. Walter H, Breckle S-W: Ecological Systems of the Geobiosphere. Tropical and Subtropical ZonobiomesVolume 2. Berlin: Springer-Verlag; 1986. 71. Walter H, Breckle S-W: Ökologie der Erde. Geo-Biosphäre. Band 4
Spe-zielle der Germäßigten und Artischen zonen außerhalb Euro-Nordasiens
Stuttgart, Gustav Fischer Verlag; 1991.
72. Marshall LG: Geochronogy and Land-Mammal biochronology of the Transamerican faunal interchange. In The Great American Interchange Edited by: Stehli FG, Webb SD. New York: Plenum Press; 1985:49-85.
73. MacFadden BJ: Extinct mammalian biodiversity of the ancient New World tropics. Trends Ecol Evol 2006, 21:157-165.
![Table 1: Climatic typology of Walter [66] and it's correspondence with world vegetation types](https://thumb-us.123doks.com/thumbv2/123dok_es/4778412.63298/3.612.53.564.99.234/table-climatic-typology-walter-correspondence-world-vegetation-types.webp)
![Figure 4BSI histograms of Rodentia suborders [74]](https://thumb-us.123doks.com/thumbv2/123dok_es/4778412.63298/8.612.146.483.83.471/figure-bsi-histograms-of-rodentia-suborders.webp)