Predicting the communication pattern evolution
for scalability analysis
Javier Panadero⋆, Alvaro Wong, Dolores Rexachs, and Emilio Luque
Computer Architecture and Operating System Department, Universitat Autonoma of Barcelona, Barcelona, SPAIN.
{javier.panadero, alvaro.wong}@caos.uab.es,
{dolores.rexachs, emilio.luque}@uab.es
Abstract. The performance of the message-passing applications on a
parallel system can vary and cause inefficiencies as the applications grow. With the aim of providing scalability behavior information of these ap-plications on a specific system, we propose a methodology that allows to analyze and predict the application behavior in a bounded time and using a limited number of resources. The proposed methodology is based on the fact that most scientific applications have been developed using specific communicational and computational patterns, which have cer-tain behavior rules. As the number of application processes increases, these patterns change their behavior following specific rules, being func-tionally constants. Our methodology is focused on characterizing these patterns to find its general behavior rules, in order to build a logical application trace to predict its performance. The methodology uses the PAS2P tool to obtain the application behavior information, that allow us to analyze quickly a set of relevant phases covering approximately 95% of the total application. In this paper, we present the entire methodology while the experimental validation, that has been validated for the NAS benchmarks, is focused on characterizing the communication pattern for each phase and to model its general behavior rules to predict the pattern as the number of processes increases.
Keywords: Prediction Scalability, Communication Pattern, MPI
appli-cations
1
Introduction
During the last years, due to constant hardware evolution, high performance computers have increased the number of cores significantly. Users of these sys-tems want to get the maximum benefit of the number of cores and scale their applications, either by reducing the execution time or increasing the workload.
⋆This research has been supported by the MICINN Spain under contract
To achieve an efficient use of high performance systems, it would be impor-tant to consider the analysis of the application behavior, before executing an application in a large system, since the ideal number of processes and resources required to run the application may vary from one system to another, due to hardware differences. The lack of this information may cause an inefficient use, causing problems at different levels, such as not achieving the expected speed up, or increasing the economic and energy cost. To avoid these problems and make an efficient system use, users and system administrators use predictive performance models selecting the most appropriate resources to run the application.
In this paper, we propose a methodology that will allow us to analyze and predict the scalability behavior for message-passing applications on a given sys-tem, in a bounded time and using a reduced set of resources. The objective of the methodology is to predict the application performance when increasing the number of processes, characterizing and analyzing the behavior of the commu-nication and computation patterns.
The methodology is based on the fact that most scientific applications have been developed using specific patterns, which have functional similarity accor-ding to the number of processes, following behavior rules. To characterize these rules, we used the PAS2P methodology [1]. PAS2P identifies the application phases, which contain a specific communication pattern and allows us to reduce the complexity of the application analysis by creating the application signature, which contains the relevant communication and computation patterns of the application (phases), and their repetition rates (weights).
The application phases can be observed and analyzed during the execution time dynamically, this is without having the source codes, to relate them by functional similarity increasing the application processes, with the objective to model their general behavior rules, to build an application logical trace that will be independent of the machine. Once we have the logical trace, the last step is to convert this trace in machine dependent, through the machine parameters to get the physical trace This new trace will be used to predict the performance of the application.
This paper is organized as follows: Section II presents the related work, Sec-tion III presents an overview of the PAS2P methodology, SecSec-tion IV presents the proposed methodology, Section V presents the experimental validation, which is focused in the communication pattern modeling, and finally Section VI presents the conclusions and future work.
2
Related Work
mes-sage sizes. This work differs from our proposal in that we model the general rules of the communication pattern and communication volume.
R. Preissl et al [4] presents an algorithm for extracting communication pa-tterns. The algorithm finds locally repeated sequences on each node using a suffix tree algorithm and matches these local repetitions with other sequences on other nodes to generate a global pattern. This approach differs of our work in that we use a functional similarity algorithm, instead of the suffix tree algorithm.
M. Chao et al [5] proposes a methodology to determine the communication pattern similarities between two programs using two metrics to form a coordinate on a 2-dimensional Cartesian Space. Our work differs of this, because we search the similarity as the number of processes increases.
3
Overview about PAS2P methodology
The PAS2P methodology [1] is composed by two steps. The first step is done on a base machine and consists on analyzing the application, building the application model to extract its phases and weights that will use to construct the signature, which is an executable that contains the application phases. The second step consists on executing the signature on a target system, to measure the execution time of each phase. Once these times have been measured, equation 1 is used to predict the application execution time in the target system, where PET is the Predicted Execution Time, n is the number of phases, TEPhasei is the Phase i Execution Time and Wi is the weight of the phase i.
P ET =
n X
i=1
(T EP hasei)(W i) (1)
4
Proposed Methodology
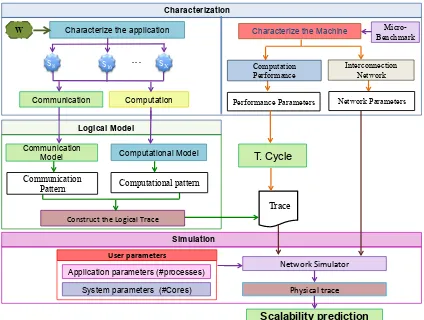
Fig. 1 shows the proposed methodology, which is based on the fact that most message-passing applications have been developed using specific communication and computation patterns, which have functional similarity when the number of processes increases, following specific rules of behavior. These patterns compose the application phases, that can be observed and traced to relate them when the number of processes increases, in order to find and model their general behavior rules. Once the patterns have been modeled, it is possible to generate the logical trace, which will provide the communication and computation times to predict the application performance.
In this section, we will describe each of the methodology stages, focusing on the characterization and modeling of the communication pattern, which is the objective of this paper.
4.1 Characterization
Characterization
Characterize the application
Communication Computation
Simulation
Network Simulator
User parameters
Application parameters (#processes) System parameters (#Cores)
Scalability prediction S16
S8 . . . SX
Physical trace
Characterize the Machine
Interconnection Network Computation
Performance
Network Parameters Performance Parameters
Logical Model
Trace
Computational Model Communication
Model
Construct the Logical Trace
W
Micro-Benchmark
Communication
Pattern Computational pattern
[image:4.595.201.413.111.271.2]T. Cycle
Fig. 1: Proposed Methodology
Machine Characterization. Consists on characterizing the machine
perfor-mance in computation and communication. First of all, the perforperfor-mance is ana-lyzed to obtain the real cycle time, when the processor is executing floating-point instructions and there are not misses on any level of the memory hierarchy. We characterize instead of using the theoretical time provided by the manufacturer, because there may be differences between them. In order to obtain the real cy-cle, a micro-benchmark was developed. On the other hand, the interconnection network is characterized using benchmarks.
Application characterization. Consists on analyzing the application
beha-vior (communication and computation) to obtain information and build its log-ical trace. We carry out a set of signature executions for a small and different number of processes, that will be analyzed to extract information of each phase of the signature. Each phase identifies a repetitive computation and communi-cation behavior. The applicommuni-cation signatures are obtained with PAS2P tool [2], which is a tool that applies the PAS2P methodology in an automatic and trans-parent way. It was decided to work with the signature rather than the whole application, since the signature contains only the relevant application phases. By analyzing this small set of relevant phases, we cover about 95% of the whole application. For this work, we integrated PAS2P with PAPI hardware perfor-mance tool [6] to obtain low-level perforperfor-mance information, such as the number of instructions and the number of cycles of each phase.
4.2 Logical trace generation
The parameters of the general behavioral rules will define the trace for a specific number of processes. Once the logical trace has been generated, the predicted computation and communication times are provided to generate the physical application trace, which will be dependent on the machine and will allow us to predict the application performance.
Communication pattern modeling. The communication pattern comprises
the general behavior equations, which predict the destination from the source, and the data volume for each phase. The phases will be related by functional similarity between the signatures with different number of processes, in order to model their behaviors. It should be mentioned that a phase can have 1 to N communications, depending on the application. The predicted data volume of each communication will be obtained by mathematical regression models, while for obtaining the general communication rules (source - destination), we propose an algorithm, based on obtaining the communication equations that calculate the destination from the source (eq.processes.phase) for each phase of the signatures
(local equations). From these equations, using functional similarity, the general equation behavior is modeled. We show an example of this algorithm, which considers that each phase (Fi ) has only one communication, and therefore one
local equation, as shown in fig. 2(a) for the phase 1 for 8 processes. Once the local equations have been obtained for each phase of each signature, these are analyzed by functional similarity to model the general behavior equation (GEF i
) as shown in fig. 2(b) for phase 1.
P0
P2
P3 P1
P4 P5
P6
P7
Phase 1 (F1) for 8 processes
Eq.Processes.Phase
Eq.8.1
(a) F1 for 8 processes
F4 F1
F2
F3 Signature for
8 processes
F4 F1
F2
F3
F4 F1
F2
F3
F4 F1
F2
F3
eq.8.1 eq.16.1 GEf1
eq.8.2
eq.8.3
eq.8.4
eq.16.2
eq.16.3
eq.16.4
Signature for 64 processes Signature for
32 processes Signature for
16 processes
eq.64.1
eq.64.2
eq.64.3
eq.64.4
eq.32.1
eq.32.2
eq.32.3
eq.32.4
[image:5.595.154.461.424.531.2](b) Comparison of phases by functional similarity
Fig. 2: Obtaining general equations by functional similarity
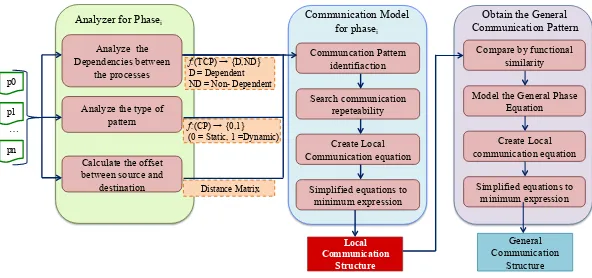
The algorithm to obtain the behavior rules is divided in two stages, in the first stage the local equations are generated for each phase, and in the second stage the general equations are obtained, as shown in fig. 3. Noteworthy that for both steps, the process identifier (process number) is converted to binary in order to work at bit level.
Local Communication
Structure Analyze the
Dependencies between the processes
Analyze the type of pattern
Calculate the offset between source and
destination
Analyzer for Phasei Communication Model for phasei
Communcation Pattern identifiaction
Search communication repeteability
Create Local Communication equation
Simplified equations to minimum expression Distance Matrix
f:(CP) → {0,1} (0 = Static, 1 =Dynamic) f:(TCP) → {D,ND} D = Dependent ND = Non- Dependent p0
p1
pn …
General Communication
Structure Obtain the General Communication Pattern
Compare by functional similarity
Model the General Phase Equation
Create Local communication equation
[image:6.595.159.455.110.249.2]Simplified equations to minimum expression
Fig. 3: Proposed algorithm to model the communication pattern
Ring, ...) or Dynamic (Exchange or Permutation), and the distance matrix be-tween processes are obtained for each phase of the signatures.
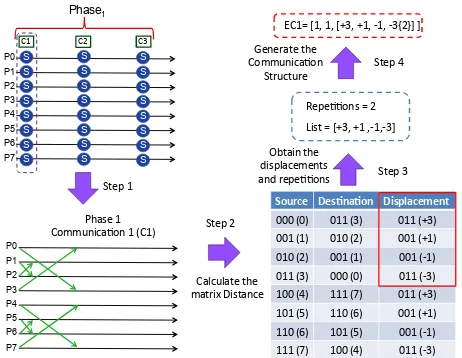
All this information is provided to the modeling phase to generate the local equations. In this second sub-stage, the communication pattern of each phase is identified. Moreover, the repeatability of the communication is sought to gener-ate a more structured equation model. Once this information has been identified, the local equation for each communication is generated and applied in a compres-sion method to simplify the next step of modeling. The output of this module is a communication structure that identifies each local equation. The algorithm uses two different structures because the way to predict the communication pattern is different depending on the pattern type. If the pattern is dynamic, the obten-tion of the destinaobten-tion process is based on the exchange of a certain number of source bits, which are called bits involved. For this type of algorithm, the first structure (EC1) is used. In case of a static pattern, to obtain the destination process we search the repeatability of the communications, for example, in a 4 x 4 mesh, the first three processes in the first row have a displacement of 1, while the fourth process connects with the first and has a displacement of 3. This behavior is repeated for the remaining rows of the mesh. For this type of patterns, the second structure (EC2) is used.
The structure EC1 has the number of phase (#Phase), the communication number of the phase (#Comm), the algorithm type ( Exchange, Permutation ) and a vector with the bits involved in the pattern as parameters, while the structure EC2 has the number of phase, the communication number of the phase, and a list of communication and number of repetitions as parameters.
1. EC1 = {#Phase, #Comm, Algorithm Type , List of bits involved}
2. EC2 = {#Phase, #Comm, list[ communication list[#repetition] ]}
S S S S S
S
S
S S S S S S
S
S
S S S S S S
S
S
S
P0
P2 P3 P1
P4 P5 P6 P7
Phase
1
P0
P2 P3 P1
P4 P5 P6 P7
Source Des*na*on Displacement
000 (0) 011 (3) 011 (+3)
001 (1) 010 (2) 001 (+1)
010 (2) 001 (1) 001 (‐1)
011 (3) 000 (0) 011 (‐3)
100 (4) 111 (7) 011 (+3)
101 (5) 110 (6) 001 (+1)
110 (6) 101 (5) 001 (‐1)
111 (7) 100 (4) 011 (‐3)
Repe11ons = 2
List = [+3, +1 ,‐1,‐3]
Step 1
Phase 1
Communica1on 1 (C1) Step 2
Calculate the matrix Distance
Step 3 Obtain the
displacements and repe11ons
Step 4 Generate the
Communica1on Structure
EC1= [1, 1, [+3, +1, ‐1, ‐3{2}] ]
[image:7.595.192.423.112.291.2]C1 C2 C3
Fig. 4: Example of generating the Communication Structure
destination. The algorithm is static, then we search for repetitions, in this case, we have two, therefore the sequence {+3,+1,-1,-3} is repeated two times, once for processes from 0 to 3 and then for processes from 4 to 7. Once we have the sequences and repeatability, we create the local equation and generate the structure of communication EC1.
Once the communication structure has been obtained, it is submitted to the second algorithm stage with the purpose of obtaining the general equations, which model the general behavior of the communication pattern. To model the general equations of each phase, the local equations are analyzed by functional similarity. When the similarity has been identified, the general equations are modeled. The general equation has as variables the number of processes to pre-dict, the displacements between the source and destination for the number of processes to predict, and the hops between the processes executed and the num-ber of processes to predict. Finally, the last step that compresses the general equation in order to simplify the expression used to predict the communication pattern for a greater number of processes.
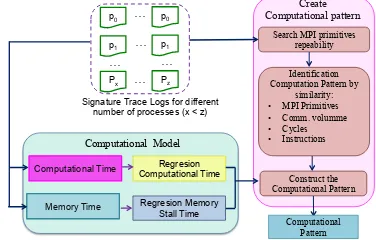
Computation pattern modeling. As shown in fig. 5, the algorithm is based
time in: execution time, the time it takes the processor to execute instructions, the stall time and the time that the processor waits for memory accesses. We decided to separate computation times as they may have different trends when the number of processes increases. In order to separate these times, the model uses information from the hardware counter, obtained in the characterization stage. Then, the computation time will be predicted using statistical regression models .
Computational Model
Computational Time
Memory Time
Regresion Computational Time
Regresion Memory Stall Time
Search MPI primitives repeability
Create Computational pattern
Identification Computation Pattern by
similarity: • MPI Primitives • Comm. volumme • Cycles • Instructions
Construct the Computational Pattern
Computational Pattern p0
p1
Px
…
p0
p1
Pz
… …
…
…
[image:8.595.211.399.213.333.2]Signature Trace Logs for different number of processes (x < z)
Fig. 5: Procedure to model the computation pattern
4.3 Simulation
Finally, in the last stage of the methodology we carried out a simulation of the trace in order to obtain the communication times of the messages from the trace on the physical machine. After the simulation, we obtained the runtime of each predicted phase that comprises the trace. Each phase time will be multiplied by the predicted weight of the phase to obtain the run time of the application for the number of processes we want to predict, as shown in Equation 1.
5
Experimental Validation
This section shows the experimental validation of the communication pattern modeling using the BT from the NPB class D. As experimental environment, we used a cluster of 16 nodes with 16 processors Intel Xeon quad-core.
So
u
rce
Destination
D
a
ta
V
o
lu
me
(KB)
0 KB 3.000 KB 0
8 0
8
(a) BT for 9 processes
So
u
rce
Destination
D
a
ta
V
o
lu
me
(KB)
0 KB 3.000 KB
0 15
0
15
(b) BT for 16 processes
So
u
rce
Destination
D
a
ta
V
o
lu
me
(KB)
0 KB 3.000 KB
0 24
0
24
(c) BT for 25 processes
So
u
rce
Destination
D
a
ta
V
o
lu
me
(KB)
0 KB 3.000 KB
0
35 0
35
[image:9.595.171.447.116.364.2](d) BT for 36 processes
[image:9.595.162.450.413.489.2]Fig. 6: Characterization of the communication pattern and volume data
Table 1: Sumary of commnications for the different signatures
Signature Phase Com. Local Communication
(#Processes) Equation Volume (KB)
9 1 1 [+1{+2,+3}], [-2{+1,+3}] 2892
16 1 1 [+1{+3,+4}], [-3{+1,+4}] 2496
25 1 1 [+1{+4,+5}], [-4{+1,+5}] 2132
36 1 1 [+1{+5,+6}], [-5{+1,+6}] 1849
!491,1 = 1!6,7!, 6!!1,7 !
So
u
rce
Destination
D
a
ta
V
o
lu
me
(KB)
0 KB 3.000 KB
0 49
49
Comm. Vol.(X) = 5965* X-0,322
Comm. Vol. (49) = 5965* 49-0,322
Comm. Vol. = 1703,59 KB
!"(!,!"#$%)=! 1 !"#$%!,6+ !"#$%!] !
!!!!! !
!!!!!
!, −5+ !"#$% !
!!!!!
!!5+ !"#$% !
!!!!!
,6!+! !"#$% !
!!!!! !
[image:10.595.182.436.112.280.2]0
Fig. 7: Prediction of communication pattern and data volume for BT 49
6
Conclusions and future work
This paper proposes a methodology to analyze and predict the scalability beha-vior in message-passing applications in a given system, using a limited number of resources and bounded time. The methodology was presented and the model-ing communication was experimentally validated. Currently, we are workmodel-ing on finishing the computational model validation and generating the logical trace, in order to insert it in a network simulator and obtain the physical trace, which will predict the application performance.
References
1. Wong, A., Rexachs, D., Luque, E.: Extraction of parallel application signatures for performance prediction. HPCC 10th (2010) 223–230
2. Panadero, J., Wong, A., Rexachs, D., Luque, E.: A tool for selecting the right target
machine for parallel scientific applications. ICCS18(0) (2013) 1824 – 1833
3. Lee, I.: Characterizing communication patterns of nas-mpi benchmark programs. In: Southeastcon, 2009. SOUTHEASTCON ’09. IEEE. (2009) 158–163
4. Preissl, R., Kockerbauer, T., Schulz, M., Kranzlmuller, D., Supinski, B., Quinlan, D.: Detecting patterns in mpi communication traces. In: Parallel Processing, 2008. ICPP ’08. 37th International Conference on. (2008) 230–237
5. Ma, C., Teo, Y.M., March, V., Xiong, N., Pop, I., He, Y.X., See, S.: An approach for matching communication patterns in parallel applications. In: Parallel Distributed Processing, 2009. IPDPS 2009. IEEE International Symposium on. (2009) 1–12 6. Dongarra, J., Malony, A.D., Moore, S., Mucci, P., Shende, S.: Performance