Serum Electrolyte Levels
and Outcomes in Patients Hospitalized
with Hepatic Encephalopathy
Ali A. Alsaad,* Fernando F. Stancampiano,* William C. Palmer,† April M. Henry,‡ Jillian K. Jackson,‡ Michael G. Heckman, MS,§ Nancy N. Diehl,§ Andrew P. Keaveny†,||
* Department of Internal Medicine, Mayo Clinic, Jacksonville, Florida, USA.
† Department of Gastroenterology and Hepatology, Mayo Clinic, Jacksonville, Florida, USA. ‡ CRISP Program, Mayo Clinic, Jacksonville, Florida, USA. § Division of Biomedical Statistics and Informatics, Mayo Clinic, Jacksonville, Florida, USA. || Department of Transplant, Mayo Clinic, Jacksonville, Florida, USA.
September-October, Vol. 17 No. 5, 2018: 836-842
INTRODUCTION
Hepatic encephalopathy (HE) is a neurometabolic syn-drome characterized by impaired brain function in pa-tients with decompensated cirrhosis.1-3 The pathogenesis of HE is not completely understood and several proposed pathways are implicated in the initiation and exacerbation of this syndrome.3,4 Ammonia plays a central role in HE as it crosses the blood brain barrier causing neurological in-sult mediated by a decrease in excitatory neurotransmis-sion.3-5 Multiple precipitating factors for HE have been recognized and if controlled, may alter the disease acuity and improve mental status.6 The most common precipitat-ing factors for HE include dehydration, acute kidney inju-ry, non-adherence to medications (particularly
non-absorbable disaccharides), constipation and infec-tions.7-9 HE is associated with a mortality risk of up to 54% in the first 12 months of initial presentation.3,10,11 Many pa-tients with acute HE require hospitalization and intensive care unit (ICU) admission, which may be associated with worse outcomes. Fichet and colleagues studied the prog-nosis and one-year mortality in patients with HE and found that arterial hypotension, mechanical ventilation, va-sopressor use, acute renal failure, and sepsis were among the most common factors associated with mortality in the ICU.10 Another study found that diabetes mellitus, hyper-tension, prior transjugular intrahepatic portosystemic shunt (TIPS) placement, prior HE, and prior use of lactu-lose were associated with increased 90-day readmission rates.12
The Official Journal of the Mexican Association of Hepatology, the Latin-American Association for Study of the Liver and
the Canadian Association for the Study of the Liver
Manuscript received: Manuscript received: Manuscript received: Manuscript received:
Manuscript received: November 28, 2017. Manuscript accepted:Manuscript accepted:Manuscript accepted:Manuscript accepted:Manuscript accepted: March 12, 2018.
DOI:10.5604/01.3001.0012.3144 A B S T R A C T A B S T R A C T A B S T R A C T A B S T R A C T A B S T R A C T
Introduction and aims. Introduction and aims.Introduction and aims. Introduction and aims.
Introduction and aims. Serum electrolyte derangements are common in patients with decompensated cirrhosis hospitalized for hepatic encephalopathy. There are limited data describing the association between electrolyte levels and outcomes in hepatic en-cephalopathy. We assessed the association between initial serum electrolyte values and outcomes in patients with hepatic encepha-lopathy. Material and methods.Material and methods.Material and methods.Material and methods. A total of 385 consecutive patients hospitalized with encephalopathy were included in the study.Material and methods. Baseline electrolyte levels (sodium, potassium, chloride, bicarbonate, calcium and phosphorus) were measured at the time of admis-sion and assessed for association with outcomes, which included survival, admisadmis-sion to the intensive care unit, requirement for me-chanical ventilation, and length of hospital stay. P-values ≤ 0.0083 were considered significant after adjustment for multiple testing. Results.
Results.Results. Results.
Results. In unadjusted analysis, significant associations were identified regarding both bicarbonate and phosphorus (admission to intensive care unit), and calcium (mechanical ventilation); however these findings weakened and no longer approached statistical sig-nificance when adjusting for confounding variables. No other significant associations between serum electrolyte measurements and outcomes were observed. Conclusions.Conclusions.Conclusions.Conclusions.Conclusions. Our findings suggest that in patients hospitalized with encephalopathy, serum electrolyte measurements are not strong predictors of patient outcome.
Key words. Key words.Key words. Key words.
Electrolyte derangements, mainly hyponatremia and hypokalemia, represent major precipitating factors for HE.7,8,13,14 Guevara, et al. reported an association between the occurrence of HE and hyponatremia in 70 patients.15,16 However, no studies have examined the relationship be-tween serum electrolyte levels and outcomes in patients hospitalized with HE. In this study we evaluated the asso-ciations of serum electrolyte levels obtained at the time of hospital admission for HE with separate outcomes in a co-hort of patients admitted with HE.
MATERIAL AND METHODS
Study design and participants
A total of 385 consecutive patients hospitalized with HE at the Mayo Clinic in Jacksonville, Florida between April 2010 and January 2016 were included in this retro-spective study. Information was collected regarding base-line patient characteristics, basebase-line laboratory measurements, hospitalization, and outcomes. The prima-ry serum electrolyte measurements were sodium, potassi-um, chloride, bicarbonate, calcipotassi-um, and phosphorus. Ionized calcium and ionized magnesium were also exam-ined but were considered as secondary serum electrolyte parameters due to the presence of a relatively large amount of missing data for these two variables (N = 183 and N = 207 missing, respectively). All serum electrolyte pa-rameters were measured at baseline at the time of hospital admission. HE was defined as altered mental status from the patient’s baseline and was graded according to the New-Haven classification (grades I-IV) using clinical as-sessment at the time of hospital admission. As an overall measure of patient comorbidities, the Charlson comor-bidity index was recorded for each patient. The Model for End-Stage Liver Disease (MELD) score was calculated using the formula in figure 1, with and without adjustment for serum sodium level. Precipitating factors for HE were recorded based on clinical documentation at the time of hospital admission.
Outcome measures
A total of four outcomes (survival, admission to the ICU, mechanical ventilation, and length of hospital stay) were assessed. For survival, the baseline time point was considered to be the date of hospital admission, and deaths that occurred both during hospitalization and after
discharge were considered. Of note, calculation of length of hospital stay included the 39 patients who died during hospitalization; median length of stay in these 39 patients was 9 days (Range: 1-48 days).
Statistical analysis
Continuous variables were summarized with the sam-ple median and range. Categorical variables were summa-rized with number and percentage of patients. A number of variables (phosphorus, white blood count [WBC], platelets, INR, total bilirubin, creatinine, BUN, and am-monia) were examined on the logarithm scale for use in association analysis due to their skewed distributions. As-sociations of serum electrolyte parameters with the sepa-rate outcomes of survival, admission to the ICU, mechanical ventilation, and length of hospital stay were evaluated using single-variable (i.e. unadjusted) and multi-variable regression models appropriate for the nature of the given outcome measure. More specifically, associa-tions of serum electrolyte parameters with survival after hospital admission were evaluated using Cox proportional hazards regression models; hazard ratios (HRs) and 95% confidence intervals (CIs) were estimated. For the binary outcomes of admission to the ICU and mechanical venti-lation, logistic regression models were used, and odds ra-tios (ORs) and 95% confidence intervals (CI) were estimated. For length of hospital stay, associations with se-rum electrolyte parameters were assessed using negative binomial regression models;17 multiplicative increases and 95% CI were estimated and were interpreted as the ef-fect on mean length of hospital stay corresponding to a specified increase in the given serum electrolyte parame-ters. Associations of other baseline variables with the aforementioned four outcomes were assessed using the previously described Cox, logistic, and negative binomial regression models.
In evaluation of associations involving primary serum electrolyte parameters only, multivariable analysis was performed and models were adjusted for the pre-specified potential confounding baseline variables (in order of im-portance) of INR, creatinine, total bilirubin, albumin, TIPS, age, Charlson comorbidity index, hepatocellular carcinoma (HCC) at admission, platelet and WBC counts, hemoglobin level, and grade of HE. In accordance with recommended guidelines, multivariable adjustment for all of these pre-specified variables was only possible for sur-vival after admission, length of stay, and for the most
com-Figure 1. Figure 1. Figure 1.
Figure 1. Figure 1. The Model for End-Stage Liver Disease (MELD) score, with and without adjustment for serum sodium level.
mon dichotomous outcome of admission to ICU. For the less common dichotomous outcome of mechanical venti-lation, multivariable models were adjusted for as many of the pre-specified confounding variables as possible while including no more than one variable in given model for every 10 patients who experienced the outcome.18 Multi-variable analysis was not performed for secondary serum electrolyte parameters due to the extent of missing data for these parameters (and resulting exploratory nature of the analysis), and was also not performed when evaluating as-sociations of other baseline variables with outcomes and these analyses were not the focus of the study.
Separately for each outcome measure, we adjusted for the six statistical tests of association that were performed for the primary serum electrolyte parameters using a Bon-ferroni correction, after which p-values of 0.0083 or lower are considered statistically significant. All other analyses were considered to be secondary and therefore of a more exploratory nature, with p-values of 0.05 or lower consid-ered statistically significant. All statistical tests were two-sided. All statistical analysis was performed using SAS (version 9.4; SAS Institute, Inc., Cary, North Carolina) and R Statistical Software (version 3.2.3; R Foundation for Statistical Computing, Vienna, Austria).
RESULTS
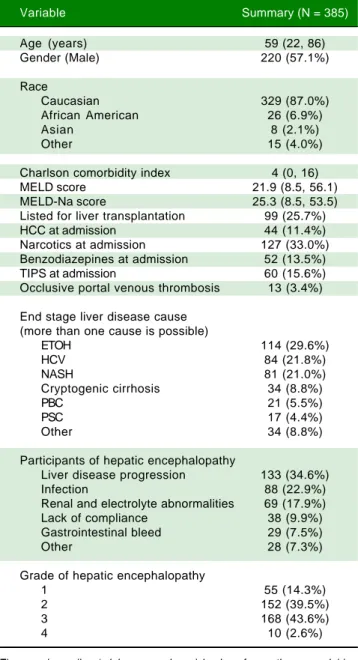
A summary of patient baseline characteristics is provid-ed in table 1. Mprovid-edian age was 59 years (Range: 22-86 years) and 220 patients (57%) were male. The majority of patients (87%) were Caucasian. Median Charlson comorbidity score was 4 (Range: 0-16) while median MELD-sodium score was 25.3 (Range: 8.5-53.5). A total of 99 patients (26%) were listed for liver transplantation (LT) and 44 pa-tients (11%) had HCC at admission. The most common causes of end-stage liver disease (ESLD) were alcohol use (30%), hepatitis C infection (HCV) (22%), and non-alco-holic steatohepatitis (NASH) (21%), while the most com-mon diagnoses were liver disease progression (35%), infection (23%), and renal and electrolyte abnormalities (18)%.
Table 2 displays baseline laboratory values, hospitaliza-tion informahospitaliza-tion, and outcomes. Median follow-up length after admission was 6.5 months (Range: 1 day-86.4 months) and 185 patients (48.1%) died. Slightly more than one-third of patients (36%) were admitted to the ICU and one-quarter (25%) required mechanical ventilation. The median length of hospital stay after admission was 4 days (Range: 0-113 days).
An evaluation of the association between the six primary serum electrolyte measured (sodium, potassi-um, chloride, bicarbonate, calcipotassi-um, and phosphorus) and outcomes is shown in table 3. In single-variable (i.e.
Table 1. Baseline characteristics of the study population.
Variable Summary (N = 385)
Age (years) 59 (22, 86) Gender (Male) 220 (57.1%)
Race
Caucasian 329 (87.0%) African American 26 (6.9%)
Asian 8 (2.1%)
Other 15 (4.0%)
Charlson comorbidity index 4 (0, 16) MELD score 21.9 (8.5, 56.1) MELD-Na score 25.3 (8.5, 53.5) Listed for liver transplantation 99 (25.7%) HCC at admission 44 (11.4%) Narcotics at admission 127 (33.0%) Benzodiazepines at admission 52 (13.5%) TIPS at admission 60 (15.6%) Occlusive portal venous thrombosis 13 (3.4%)
End stage liver disease cause (more than one cause is possible)
ETOH 114 (29.6%)
HCV 84 (21.8%)
NASH 81 (21.0%)
Cryptogenic cirrhosis 34 (8.8%)
PBC 21 (5.5%)
PSC 17 (4.4%)
Other 34 (8.8%)
Participants of hepatic encephalopathy
Liver disease progression 133 (34.6%)
Infection 88 (22.9%)
Renal and electrolyte abnormalities 69 (17.9%) Lack of compliance 38 (9.9%) Gastrointestinal bleed 29 (7.5%)
Other 28 (7.3%)
Grade of hepatic encephalopathy
1 55 (14.3%)
2 152 (39.5%)
3 168 (43.6%)
4 10 (2.6%)
comorbidity index) and the subsequent reduction in sample size that this caused.
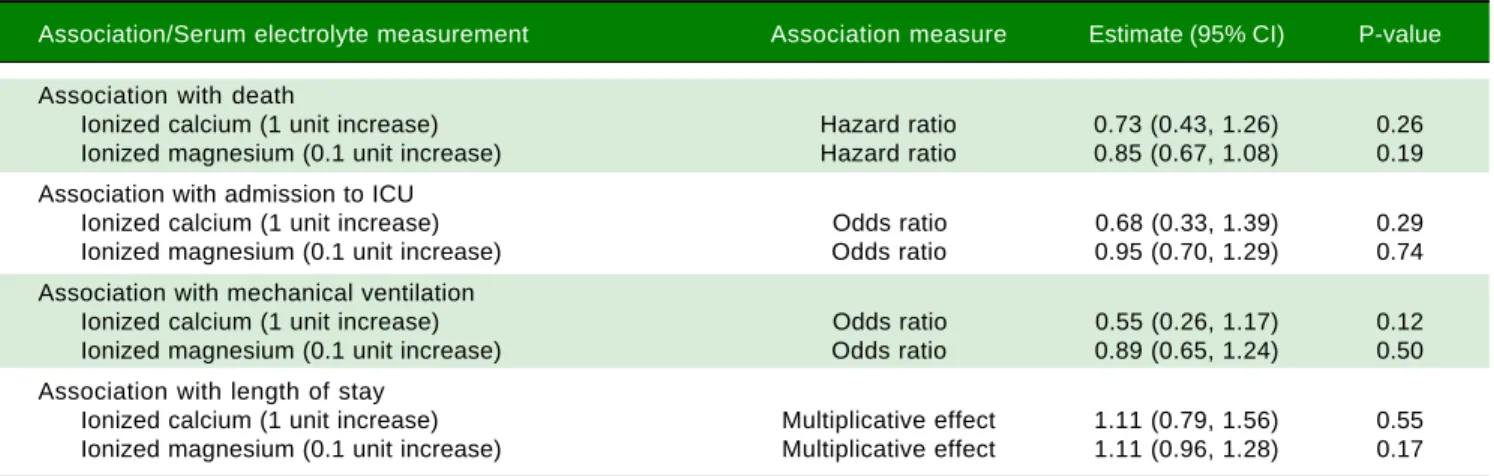
There were no statistically significant associations be-tween either ionized calcium or ionized magnesium and any of the five outcome measures that were assessed (all P ≥ 0.12, Table 4). Although not of primary interest for the evaluation of the aims of this study, associations between other baseline variables and outcomes are shown in Supplemental Tables 1-4.
DISCUSSION
Our study found that in a large cohort of patients hospi-talized with HE, there was no association between initial electrolyte levels and outcomes after adjustment for key factors including patients’ age, underlying kidney function, and progression of liver disease (as measured by the MELD-sodium score). Associations between electrolyte levels and outcomes in unadjusted analysis included bicar-bonate and admission to ICU, phosphorus and admission to ICU, phosphorus and 30-day mortality, and calcium and mechanical ventilation. However, these findings weak-ened notably when adjusting for confounding variables in multivariable analysis. No other notable associations be-tween serum electrolyte measurements and outcomes were observed.
To our knowledge, this is the first study to evaluate as-sociations between initial serum electrolyte levels and outcomes in patients hospitalized with HE. Several stud-ies have described an association between hyponatremia and HE. Guevara et al found in a study population of 61 patients with cirrhosis that serum sodium of < 130 mmol/L was predictive of developing overt HE due to low brain concentration of organic osmolytes.19 Subsequently, the same investigators reported that in 70 patients with refrac-tory ascites, the occurrence of HE was independently asso-ciated with serum sodium, bilirubin and creatinine levels in a time dependent analysis that accounted for variables that could change over time.16 Qureshi, et al. found that a serum sodium concentration of < 135 mmol/L was asso-ciated with a greater frequency of HE compared to pa-tients whose serum sodium was > 135 mmol/L.20 In our study, we analyzed data in patients hospitalized with HE at a single time point. There were only 62 patients (16.1%) who were on diuretics on admission, while 87 pa-tients (22.6%) had a sodium level < 130 mmol/L. We did not account for changes in sodium level prior to admis-sion, which may be more significant than the actual level on admission.
Our study is not free of limitations. First, its retro-spective design may have introduced a data collection bias. Second, although the sample size was not small, the possi-bility of type II error (i.e. a false-negative finding) is still
Table 2. Baseline laboratory values, hospitalization information, and outcomes.
Variable Summary (N = 385)
Baseline laboratory values
Serum electrolyte measures
Sodium (mEq/L) 135 (110, 165) Potassium (mEq/L) 4.1 (1.7, 7.8) Chloride (mEq/L) 102 (78, 126) Bicarbonate (mEq/L) 22 (8, 37) Calcium (mg/dL) 8.7 (5.3, 11.2) Phosphorus (mg/dL) 3.5 (0.4, 24.0) Ionized calcium (mg/dL) 4.9 (3.5, 6.1) Ionized magnesium (mEq/L) 0.56 (0.32, 0.87)
Other laboratory values
Hemoglobin (g/dL) 9.9 (5.8, 16.2) WBC (thousands) 6.8 (1.0, 34.7) Platelets (thousands) 86 (8, 506)
INR 1.7 (0.9, 26.4)
Albumin (g/dL) 2.9 (1.6, 4.7) Total bilirubin (mg/dL) 4.3 (0.2, 59.0) Creatinine (mg/dL) 1.2 (0.4, 8.2) BUN (mg/dL) 26 (4, 162) Ammonia (mcg/dL) 124 (11, 729)
Hospitalization information
Dialysis during hospitalization 52 (13.5%) Lactulose 106 (27.5%)
Rifaximin 76 (19.7%)
Lactulose and Rifamixin 68 (17.7%) Furosemide 40 (10.4%) Spironolactone 44 (11.4%)
Zinc 65 (16.9%)
Liver transplantation after admission 148 (38.4%) Outcomes
Death 185 (48.1%)
Admitted to ICU 138 (35.8%) Mechanical ventilation 95 (24.7%) Length of hospital stay (days) 4 (0, 113)
The sample median (minimum, maximum) is given for continuous variables. Information was unavailable regarding INR (N = 23), albumin (N = 3), total bilirubin (N = 18), creatinine (N = 4), BUN (N = 5), ammonia (N = 123), calcium (N = 25), phosphorus (N = 24), ionized calcium (N = 183), ionized magnesium (N = 207), 30-day mortality (N = 18), and 30-day readmission (N = 55). WBC: white blood cells. INR: international normalized ration. BUN: blood urea nitrogen. ICU: Intensive Care Unit.
Table 4. Association between secondary serum electrolyte measurements and outcomes.
Association/Serum electrolyte measurement Association measure Estimate (95% CI) P-value
Association with death
Ionized calcium (1 unit increase) Hazard ratio 0.73 (0.43, 1.26) 0.26 Ionized magnesium (0.1 unit increase) Hazard ratio 0.85 (0.67, 1.08) 0.19 Association with admission to ICU
Ionized calcium (1 unit increase) Odds ratio 0.68 (0.33, 1.39) 0.29 Ionized magnesium (0.1 unit increase) Odds ratio 0.95 (0.70, 1.29) 0.74 Association with mechanical ventilation
Ionized calcium (1 unit increase) Odds ratio 0.55 (0.26, 1.17) 0.12 Ionized magnesium (0.1 unit increase) Odds ratio 0.89 (0.65, 1.24) 0.50 Association with length of stay
Ionized calcium (1 unit increase) Multiplicative effect 1.11 (0.79, 1.56) 0.55 Ionized magnesium (0.1 unit increase) Multiplicative effect 1.11 (0.96, 1.28) 0.17
CI: confidence interval. Hazard ratios, 95% CIs, and p-values result from single-variable (i.e. unadjusted) Cox proportional hazards regression models. Odds ratios, 95% CIs, and p-values result from single-variable (i.e. unadjusted) logistic regression models. Multiplicative effects, 95% CIs, and p-values result from single-variable (i.e. unadjusted) negative binomial regression models and are interpreted as the multiplicative increase on mean length of stay corresponding to the increase shown in parenthesis for the given serum electrolyte measure. ICU: Intensive Care Unit.
Table 3. Association between primary serum electrolyte measurements and outcomes.
Association/Serum electrolyte Association Single variable analysis Multivariable analysis measurement measure Estimate (95%CI) P-value Estimate (95% CI) P-value
Association with death
Sodium (10 unit increase) Hazard ratio 0.85 (0.69, 1.04) 0.11 0.93 (0.73, 1.20) 0.59 Potassium (1 unit increase) Hazard ratio 1.09 (0.91, 1.30) 0.34 0.96 (0.78, 1.18) 0.69 Chloride (10 unit increase) Hazard ratio 0.85 (0.70, 1.03) 0.092 0.85 (0.67, 1.06) 0.15 Bicarbonate (5 unit increase) Hazard ratio 1.02 (0.88, 1.19) 0.78 1.07 (0.90, 1.27) 0.42 Calcium (1 unit increase) Hazard ratio 0.88 (0.73, 1.06) 0.17 0.99 (0.80, 1.23) 0.93 Phosphorus (doubling) Hazard ratio 1.36 (1.03, 1.80) 0.029 1.36 (0.93, 1.99) 0.12 Association with admission to ICU
Sodium (10 unit increase) Odds ratio 1.09 (0.81, 1.48) 0.56 1.57 (1.05, 2.33) 0.027 Potassium (1 unit increase) Odds ratio 1.03 (0.80, 1.33) 0.82 0.99 (0.73, 1.36) 0.97 Chloride (10 unit increase) Odds ratio 0.97 (0.74, 1.28) 0.85 1.30 (0.90, 1.88) 0.16 Bicarbonate (5 unit increase) Odds ratio 0.69 (0.55, 0.86) 0.0009 0.81 (0.62, 1.07) 0.14 Calcium (1 unit increase) Odds ratio 0.71 (0.54, 0.92) 0.010 0.73 (0.51, 1.04) 0.085 Phosphorus (doubling) Odds ratio 2.43 (1.35, 4.38) 0.0031 1.11 (0.66, 1.86) 0.71 Association with mechanical ventilation
Sodium (10 unit increase) Odds ratio 1.14 (0.82, 1.59) 0.45 1.43 (0.96, 2.14) 0.083 Potassium (1 unit increase) Odds ratio 0.94 (0.70, 1.25) 0.65 0.93 (0.67, 1.28) 0.64 Chloride (10 unit increase) Odds ratio 1.00 (0.74, 1.36) 0.99 1.25 (0.86, 1.81) 0.24 Bicarbonate (5 unit increase) Odds ratio 0.77 (0.61, 0.98) 0.037 0.90 (0.67, 1.20) 0.46 Calcium (1 unit increase) Odds ratio 0.63 (0.47, 0.85) 0.0021 0.64 (0.44, 0.93) 0.020 Phosphorus (doubling) Odds ratio 2.31 (1.21, 4.39) 0.011 1.56 (0.69, 3.51) 0.29 Association with length of stay
Sodium (10 unit increase) Multiplicative effect 1.06 (0.92, 1.23) 0.41 1.15 (0.99, 1.34) 0.071 Potassium (1 unit increase) Multiplicative effect 0.92 (0.82, 1.04) 0.17 0.93 (0.82, 1.05) 0.23 Chloride (10 unit increase) Multiplicative effect 1.00 (0.88, 1.14) 0.98 1.06 (0.91, 1.22) 0.46 Bicarbonate (5 unit increase) Multiplicative effect 0.92 (0.84, 1.02) 0.098 1.03 (0.93, 1.15) 0.56 Calcium (1 unit increase) Multiplicative effect 1.00 (0.89, 1.12) 0.98 1.09 (0.97, 1.24) 0.15 Phosphorus (doubling) Multiplicative effect 1.29 (1.01, 1.65) 0.043 1.02 (0.82, 1.28) 0.85
important to consider, particularly after adjustment for multiple testing. Finally, the outcome of length of hospital stay is inherently biased to some degree due to the patient population being studied in which death during or shortly after hospitalization is common. For example, a patient who was discharged one day after admission (a positive outcome) was treated exactly the same as a patient who died one day after admission. However, the bias is less-ened to a degree for length of stay since this was generally long (median=9 days) in patients who died during hospi-talization compared to the remaining group who survived until discharge (median = 4 days). Although an alternative analysis could be considered, our approach to the length of stay offers a measure of burden to the hospital in addi-tion to the patient, which seems reasonable given that we assessed three other meaningful outcomes (survival, ICU admission, mechanical ventilation).
The role of electrolytes in HE and patients with de-compensated cirrhosis remains understudied and under-represented in the medical literature. Studying one time point as compared to serial measurements may underesti-mate the importance of changes in values that could im-pact clinical events such as the development of HE, and the lack of serial electrolyte measurements is an additional limitation of our study.
In conclusion, our findings suggest that in patients hos-pitalized with HE, initial serum electrolyte measurements are not strong predictors of patient outcomes. Further studies are needed to define the association between serial electrolyte measurements during hospitalization and out-comes in patients with HE.
ABBREVIATIONS
• BUN: blood urea nitrogen.
• CI: confidence intervals. • ESLD: end stage liver disease. • HCC: hepatocellular carcinoma. • HCV: hepatitis-C virus.
• HE: hepatic encephalopathy.
• ICU: Intensive Care Unit.
• INR: International Normalized Ratio. • LT: liver transplantation.
• MELD: model for end-stage liver disease.
• NASH: nonalcoholic steatohepatitis.
• OR: odds ratios.
• TIPS: transjugular intrahepatic portosystemic shunt. • WBC: white blood cells.
CONFLICT OF INTEREST
None of the authors have a conflict of interest to dis-close.
AUTHOR CONTRIBUTION
Ali Alsaad, Fernando Stancampiano, William Palmer and Andrew Keaveny authored the manuscript. Ali Alsaad, Fernando Stancampiano, April Henry, Jillian Jackson con-tributed to data acquisition. Michael Heckman and Nancy Diehl conducted the statistical analysis. All authors re-viewed and approved the manuscript prior to submission.
SOURCE OF SUPPORT
Mayo Clinic Departmental Resources and approved by the Mayo Clinic Institutional Review Board.
REFERENCES
1. Aldworth G. Hepatic encephalopathy. Ann Clin Biochem 2017; 54: 416.
2. Weiss N, Jalan R, Thabut D. Understanding hepatic encepha-lopathy. Intensive Care Med 2018; 44: 231-4.
3. Wijdicks EF. Hepatic Encephalopathy. N Engl J Med 2016; 375: 1660-70.
4. Tapper EB, Jiang ZG, Patwardhan VR. Refining the ammonia hypothesis: a physiology-driven approach to the treatment of hepatic encephalopathy. Mayo Clin Proc 2015; 90: 646-58. 5. Tamaoki S, Suzuki H, Okada M, Fukui N, Isobe M, Saito T.
De-velopment of an experimental rat model of hyperammonemic encephalopathy and evaluation of the effects of rifaximin. Eur J Pharmacol 2016; 779: 168-76.
6. Vilstrup H, Amodio P, Bajaj J, Cordoba J, Ferenci P, Mullen KD, Weissenborn K, et al. Hepatic encephalopathy in chronic liver disease: 2014 Practice Guideline by the American As-sociation for the Study of Liver Diseases and the European Association for the Study of the Liver. Hepatology 2014; 60: 715-35.
7. Han KH. Mechanisms of the effects of acidosis and hypoka-lemia on renal ammonia metabolism. Electrolyte Blood Press 2011; 9: 45-9.
8. Iwasa M, Sugimoto R, Mifuji-Moroka R, Hara N, Yoshikawa K, Tanaka H, Eguchi A, et al. Factors contributing to the devel-opment of overt encephalopathy in liver cirrhosis patients. Metab Brain Dis 2016; 31: 1151-6.
9. Pantham G, Post A, Venkat D, Einstadter D, Mullen KD. A New Look at Precipitants of Overt Hepatic Encephalopathy in Cirrhosis. Dig Dis Sci 2017; 62: 2166-73.
10. Fichet J, Mercier E, Genee O, Garot D, Legras A, Dequin PF, Perrotin D. Prognosis and 1-year mortality of intensive care unit patients with severe hepatic encephalopathy. J Crit Care 2009; 24: 364-70.
11. Bajaj JS, O’Leary JG, Tandon P, Wong F, Garcia-Tsao G, Kamath PS, Maliakkal B, et al. Hepatic Encephalopathy Is As-sociated With Mortality in Patients With Cirrhosis Independent of Other Extrahepatic Organ Failures. Clin Gastroenterol Hepatol 2017; 15: 565-74 e564.
12. Rassameehiran S, Mankongpaisarnrung C, Sutamtewagul G, Klomjit S, Rakvit A. Predictor of 90-Day Readmission Rate for Hepatic Encephalopathy. South Med J 2016; 109: 365-9. 13. Cordoba J, Garcia-Martinez R, Simon-Talero M.
Hyponatrem-ic and hepatHyponatrem-ic encephalopathies: similarities, differences and coexistence. Metab Brain Dis 2010; 25: 73-80.
manage-ment of hepatic encephalopathy in 201 Italian specialist cen-tres. Dig Liver Dis 2017; 49: 828-30.
15. Guevara M, Baccaro ME, Rios J, Martin-Llahi M, Uriz J, Ruiz del Arbol L, Planas R, et al. Risk factors for hepatic enceph-alopathy in patients with cirrhosis and refractory ascites: relevance of serum sodium concentration. Liver Int 2010; 30: 1137-42.
16. Guevara M, Gines P. [Hyponatremia in liver cirrhosis: patho-genesis and treatment]. Endocrinol Nutr 2010; 57(Suppl. 2): 15-21.
17. Categorical Data Analysis With SAS and SPSS Applications (Book). Sci-Tech News 2003; 57: 66.
18. Harrell FE. Regression modeling strategies: with applications to linear models, logistic regression, and survival analysis. New York: Springer; 2001; xxii, p. 568.
19. Guevara M, Baccaro ME, Torre A, Gomez-Anson B, Rios J, Torres F, Rami L, et al. Hyponatremia is a risk factor of he-patic encephalopathy in patients with cirrhosis: a prospec-tive study with time-dependent analysis. Am J Gastroenterol 2009; 104: 1382-9.
20. Qureshi MO, Khokhar N, Saleem A, Niazi TK. Correlation of hyponatremia with hepatic encephalopathy and severity of liver disease. J Coll Physicians Surg Pak 2014; 24: 135-7.
Correspondence and reprint request: Andrew P. Keaveny, M.D.
Associate Professor of Medicine, College of Medicine, Mayo Clinic 4500 San Pablo Road S, Jacksonville, FL 32224,