Adoption of business strategies to provide analytical systems for teachers in the context of universities
7
0
0
Texto completo
(2) SPECIAL FOCUS PAPER ADOPTION OF BUSINESS STRATEGIES TO PROVIDE ANALYTICAL SYSTEMS FOR TEACHERS IN THE CONTEXT OF … academic managers basically) and will be temporaldependent (the relevant indicators for the start of the course are different than the ones at the end of the course). With the proposed system, teachers will have quick and integrated view of students’ progress and classrooms evolution. Academic managers will have information about course evolution, teachers’ activities and student progress. The paper is structured as follows: Section 2 describes the information systems at university and comments why such systems should be different to those used in the business. Section 3 indicates the data that exist in a university and its analytical possibilities. Section 4 describes business intelligence systems and shows how to classify companies (and universities) according to its analytical activity. Subsequently, Section 5 proposes a BI system that takes into account VLE data in order to support the decision-making of teachers in the university. Finally, last section concludes the paper and outlines ongoing and future work. II. FACTORS TO TAKE INTO ACCOUNT WHEN ADOPTING BUSINESS STRATEGIES AT THE UNIVERSITY In the last decade, higher education sector is experiencing a reform. This is driven by external factors such as government pressure, increased competition, decreased number of students, economic crisis and globalization. Hence, higher education sector is considering new strategies to improve the academic and research quality within a sustainable environment, including the adoption of some business strategies. A. Economic versus social Universities have the mission of contributing to the universal knowledge [5], making individuals more educated, more prepared and self-sufficient regarding the professional knowledge. However, the main objective of business companies is financial gains. So, the purpose of both kinds of organizations is different. In this paper we will use the terms company and business indistinctly to name organizations whose main goal is the financial gain. Companies define strategic objectives and key indicators known as KPIs (Key Performance Indicators), which are metrics to quantify the achievement of objectives. The major financial indicators used by companies are the ROI (Return On Investment), which measures the benefit in relation to the investment, and Payback, which calculates the time it will take to recover an investment. Universities also define indicators to measure the achievement of the objectives. However, they are not usually based on financial values but on the quality of teaching, academic programs and research. In the future, investments made by companies affect directly to their economic benefit. However, university investments are focused to transfer knowledge, experience and aptitudes during the teaching-learning process, impacting directly on the society and indirectly on the university. Therefore, return of the investment is different in universities and, therefore, the indicators to measure the success in achieving the objectives must also be different. B. For-profit universities: How they differ from traditional universities? There is another kind of educative institutions with a clear lucrative purpose [6] and focused to higher educa-. iJET ‒ Volume 11, Issue 7, 2016. tion. Some authors [6, 7, 8, and 9] define for-profit university as a business with shareholders, focused mainly to adult students who are interested in educational programs that are professionally, technically and business oriented. Some of these organizations use online education to provide flexible schedules and accessibility to their students. The only similarity between traditional and for-profit universities is that they both deal with higher education. However they differ in their management, culture, processes and mission. According to [6, 7] traditional (or nonprofit) university, without a lucrative purpose, contributes to the formation and comprehension of the society and also produce innovation and research. In addition, their mission usually is focused to work for a common good. On the contrary, forprofit university provides higher education teaching focused to the labor market and usually not produces research [6]. In addition, as a business, their main mission is to maximize benefits and share them between the shareholders. They must be sustainable and their success depends on the evaluation they receive from students (clients). Therefore, they tend to focus the efforts in order to offer (sell) the product that students want to buy. Another main difference between the two kinds of organizations is the origin of their incomes [6, 10]. In traditional universities, the main source of incomes comes from government and private donations, while the main incomes in for-profit universities come from students’ enrollment. Therefore, in order to guaranty sustainability, for-profit universities should offer products with a good ratio cost/benefit. In traditional universities however, academic offer may not be profitable but even so, they can maintain the offer anyway because they have other incomes, apart from students, and their offer do depends on their mission and not on their benefits. Both kind of universities have pros and cons [7, 11]. As pros, for-profit universities provide a competitive spirit in the public educational institutions and make them more readiness to evolve, focused to students and basically more competitive; they offer more opportunities to students in the more demanded areas of the labor market, increasing their students’ employability. As cons, there are the lack of transparency and the fact that the externalization of education constrains the resources to manage education to service fees and benefits. Other cons related to the government are their few involvement in for-profit universities and the waive ex-ante control of education. In this paper when we discuss about universities, we mean nonprofit universities, not lucrative. However, the proposed system would be beneficial for all kind of universities. C. University paradigm shift Currently, the university is experiencing a paradigm shift [12]. Universities should gain academic excellence to survive in an economically sustainable environment. Accordingly, universities have defined new management strategies to reduce costs and improve the organizational processes to be sustainable. When defining their strategic actions, universities should not forget that their main objective is the quality of the academic programs to ensure academic rigor, as well as to improve satisfaction and students loyalty.. 35.
(3) SPECIAL FOCUS PAPER ADOPTION OF BUSINESS STRATEGIES TO PROVIDE ANALYTICAL SYSTEMS FOR TEACHERS IN THE CONTEXT OF … In the last decade, the university has adapted the strategies of business in their management and organization. Among other strategic actions there is the acquisition of management information systems [13]. In the new environment, it is important to rethink about the information systems that exist in universities at global and departmental levels. We may ask questions as: Is the university getting the expected benefit when investing in the adoption/development of information systems? Are information systems and information technologies aligned with the university strategy? Is the university investing in information systems and information technologies to solve isolated problems as they emerge? Before investing in information systems and information technologies, are their economic feasibility, advantages and risks properly analyzed? Is it shown that competitive advantage can be obtained by incorporating information systems and information technologies in university strategic approach? Overall, universities acquire information systems mainly to manage administrative functional units of the university, such as accounting and human resources [13], which supports the basic and operational tasks. However, there is a lack of analytical systems to fully support the global management of universities [14]. Under our humble opinion, there is also lack of analytical tools to support teachers in the decision-making process related with the teaching activities in VLE. Since the value chain of universities is teaching and research, we can conclude that information systems do not fully support the value chain of universities. D. Iniciatives of BI system at the university The interest in analytical systems on academic and institutional environments is not new. The institutional initiatives are concerned with improving organizational processes, such as personnel management or resource allocation, improving efficiency within the university and also measuring and monitoring external indicators defined by the third evaluation parties (government or external quality agencies) and internal indicators related to the strategic objectives of the university [3,14,15]. There are also initiatives where BI systems are used to improve academic aspects of universities, such as tracking students in educational platforms [16,17,18]. In addition, international research centers such as EDUCAUSE, have defined concepts such as Learning Analytics [19] and Academic Analytics [20] to define analytical systems in the context of education. These systems may use BI techniques to deal with different aspects of education, such as understanding the learning process of students, finding out the students at risk of dropping out or calculating the satisfaction of students at institutional and departmental level. Even though there are several cases where BI techniques have been applied to deal with specific aspects of the academic environment, as far as we know, there is not a solution, using BI techniques, that provide a complete and integrated view at all levels of the university (university, department, academic program, minor, subject coordination, course, classroom) to improve academic decisions based on data and evidence. III. UNIVERSE OF DATA Data are a great asset for organizations, which can create knowledge as a result of their analysis [2]. Currently, universities also have large volumes of data but little ana-. 36. lytical culture [19]. Then they cannot accumulate great amounts of knowledge from such data. Universities usually provide simple and routine reports to their teachers, obtained from their academic management information systems. However, these reports do not tend to provide thorough analysis of data, being of little relevance for taking academic decisions. A BI system requires great volumes of data to extract knowledge. The key factor for having success with these systems is not to have large quantities of data, but to know how to analyze and organize the data correctly to answer the analytical questions of each user [21]. Teaching performed in VLE generates digital traces of the tasks performed for all VLE users, generating quickly huge amounts of data, very heterogeneous and of different type: structured, semi-structured and unstructured [19]. In these systems, all possible communications among students and between students and teachers are done within the VLE and therefore can be stored. Furthermore, VLE can gather navigational data, describing the way students learn and the way teachers teach. The stored data does not contain personal information about students and teachers, but about the way they navigate through the VLE, the services they use, the resources they consume, etc. In addition any data should be anonymized. There is an open debate about the ethical and legal use of VLE data, addressing this issue is beyond the scope of this paper. Thus, interactions performed within the VLE generate a great amount of data, allowing the use BI techniques [19] to extract, manipulate and analyze data. Such analysis may have several benefits to universities, such as providing a whole picture of the university or its departments, detecting and identifying students at risk of dropping out, estimating student satisfaction or detecting improvements in teaching. IV. ARCHITECTURE BI SYSTEM A BI system represents a broad category of applications, technologies and processes that are designed to collect, store, access and analyze data to help users in making better decisions [23]. This definition of BI system shows the relevance of collecting data from different sources (ERP, CRM, departmental information systems, external data, among others), of storing data conveniently (data warehouse or data mart) and of analyzing data through technologies and business intelligence applications to achieve the objective of the business [21]. Figure 1 presents the main components of BI architecture: • Data warehouse (DW) is a data repository that provides a global, common and integrated vision to the organization. • Data Mart (DM) contains subsets of data DW to a particular department, a set of users or to perform certain analysis. • Processes that Extract, transform and integrate data (also known as ETL processes) into the data warehouse or other analytic data stores. • Metadata provides information about the data within business intelligence system. They describe the contents of the data, their semantics and how the data is created. • Online Analytical Processing (OLAP) is a tool that enable users to analyze multidimensional data interactively from multiple perspectives.. http://www.i-jet.org.
(4) SPECIAL FOCUS PAPER ADOPTION OF BUSINESS STRATEGIES TO PROVIDE ANALYTICAL SYSTEMS FOR TEACHERS IN THE CONTEXT OF … • Business analytics is a set of software tools designed for reporting, querying and analyzing data, such as queries, data mining, text mining, web mining, and advanced statistical and mathematical tools. • Dashboards are visualization tools. They use graphics and interactive elements to enhance the in-depth analysis and understanding of information. • Data Mining is a process of discovering patterns in large data sets involving methods at the intersection of artificial intelligence, machine learning, statistics and database systems. A business intelligence system can be composed of only one component (such as a DW) or may be constructed by a set of components that go from the extraction of data to the visualization of the analysis results on a dashboard. Companies that adopt a BI system can pass through different stages of maturity. A. Maturity model of business intelligence There exist a variety of models to measure the analytical maturity of organizations. In this paper we focus on the model of Thomas Davenport that classifies organizations according to their degree of maturity in five stages [25] (see Figure 2). At the base of the pyramid there are analytical impaired organizations. As we go up into the pyramid, we find organizations using analytics more often, in more areas, for more purposes and in a more integrated way. Analytically impaired organizations, which are the poorest organizations in terms of analytics, do not have quality data (data may be duplicated, incomplete, etc.), analytical skills or senior management interest. At the stage of localized analytical the organization collects data efficiently, but does not effectively use the data for global decision-making. At the stage of analytical aspirations, organizations have many BI systems but they are not integrated. At the stage of analytical companies, organizations have both quality data, analytical skills and analytical enterprise-wide systems. These organizations are able to take decisions at different levels based on data and evidences, but their strategy is not focused on analytics and do not use analytics to provide a competitive advantage. Finally, at the higher stage, the analytical competitors are organizations that have a BI architecture consolidated enterprise-wide and are able, not only to take decisions based in data, but also to make predictions based on previous data. Davenport also define five assets and capabilities for analytics, summarized by the acronym DELTA. They are • Data, which should be accessible, clean, common and high-quality. • Enterprise, an enterprise-orientation of analytics allows to leverage analytic results across the organization and get global benefits. • Leadership, leaders have influence in the organization and are able to mobilize people, time and money to get an organization focused on analytics. • Targets, since resources are limited it is important to define targets with a good return of investment and valuable. • Analysts, who are the persons and their skills to develop analytical projects and interpret the results of analytics.. iJET ‒ Volume 11, Issue 7, 2016. Figure 1. Architecture Business Intelligence System. Figure 2. Davenport’s analytical model. Davenport’s model is generic and therefore not focused to universities. There other models that can be of interest in this context, such as [28], which provides a similar model but focused to educational institutions. In this case, different indicators are used: Culture/Process, Data/Reporting/Tools, Investment, Expertise, and Governance/Infrastructure, but with similar semantics with DELTA factors. The only novelty of this model against the DELTA model is the factor of investment, which is not contemplated in Davenport’s model [29]. By using Davenport’s model to measure the maturity stage of universities we have a devastating panorama, even when dealing with universities that use VLE, which are supposed to be more technologically advanced. Many universities do not use business intelligence systems to improve teaching, ranking first level of the pyramid. Other universities use business intelligence systems to analyze specific aspects, such as the detection of plagiarism or identify at-risk students; but actions are isolated and uncoordinated, placing these universities on the second level of the pyramid. Although universities have professionals with analytical skills, even some researchers publishing high quality papers about analytics, there are few universities that regularly analyze their data in order to improve the overall performance of the university (operational and academic). Thus, there are few universities on the third level of the pyramid. It is difficult to think about universities that exist above the third stage of the pyramid. V. BI SYSTEM FOR TEACHERS In this work we propose a BI system that analyzes VLE data to support academics in the following decisionmaking processes: • Maintaining teaching: it should support the academic coordinators of subjects and teachers in their teaching activities. • Managing teaching: it should provide to managers a complete and integrated view of academic programs (masters and degrees) and their subjects.. 37.
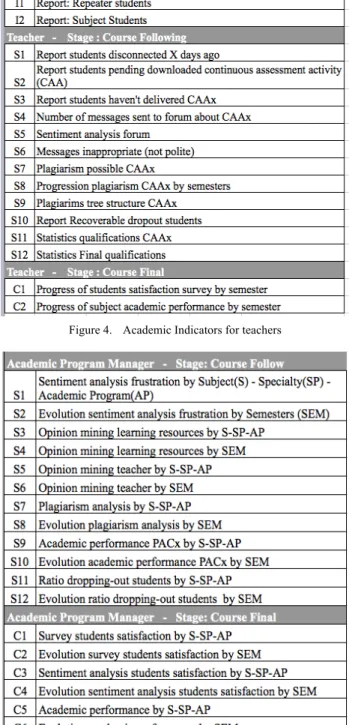
(5) SPECIAL FOCUS PAPER ADOPTION OF BUSINESS STRATEGIES TO PROVIDE ANALYTICAL SYSTEMS FOR TEACHERS IN THE CONTEXT OF … The prototype system is designed based on the functional requirements of the teachers from the faculty of computer science of our university. However, we believe the systems can be easily adapted to any academic program. Next subsection presents the proposed business intelligence system. Later, we will present some academic indicators and will describe how they were identified. Then, the DW will be presented and, finally, the defined dashboards that display the academic indicators are shown. A. Description of a potential BI system for teachers BI system collects and analyzes academic data of VLE. It displays in several dashboards a set of academic indicators (KPIs) based on quantitative data (subject performances) and qualitative data (sentiment virtual classroom). Dashboards are focused to analyze the degree of fulfillment of the university’ educational goals. The business intelligence system for teachers is composed of (see Figure 3): • ETL processes that extract, transform and load data: academic data is composed of student, teacher and subject information. Interaction data is composed of communication forums, learning resources and VLE access information. Application data is composed of plagiarism and sentiment analysis information infered from the text in communication forums. • Data warehouse that stores the data needed for decision-making of the teachers. The data comes from different information systems (academic, virtual classroom, learning resources, classroom messages, etc) and are of different types (structured or unstructured). • Dashboards displaying the previously defined educational indicators. There are two different dashboards: one for subject coordinators and teachers, and the other to program managers (managers of degrees and masters). Both dashboards will provide graphics and interactive elements to facilitate understanding the requested information and to provide such information at different detail levels. B. Academic Indicators Teachers, within their daily activities, should perform several activities related with the analysis of data generated during teaching and learning processes. The academic indicators defined are focused to give support to these activities. The indicators relevant by the teacher and by the academic program managers are different. Indicators are also different according to the time the teachinglearning process is in the semester (at the beginning of the course, during the course, at the end of the course). In defining the set of indicators several interviews were conducted over several teachers of computer-science degree and computer-science master of our university. Subsequently, an online survey was conducted for all teachers of our university in order to validate the academic indicators. The figures 4 and 5 are a sample of the indicators defined for teachers and academic program managers, as result from interviews and surveys conducted. Regarding to teacher indicators (see figure 4), S1, S2 and S3 show information about students who are at risk of dropping in the context of a subject (e.g., the student has not connected to the VLE days ago, the student has pend-. 38. Figure 3. Architecture of a BI system for academics. Figure 4. Academic Indicators for teachers. Figure 5. Academic Indicators for Academic Program Manager. http://www.i-jet.org.
(6) SPECIAL FOCUS PAPER ADOPTION OF BUSINESS STRATEGIES TO PROVIDE ANALYTICAL SYSTEMS FOR TEACHERS IN THE CONTEXT OF … ing downloads of continuous assessment activities, the student has not submitted an assessment activity). S4, S5 and S6 indicators show information about the VLE forums (gathered by using opinion mining techniques on the messages of VLE). S7, S8 and S9 indicators analyze data about potential plagiarisms between student assessment activities. S10 indicator presents the list of students who have not submitted the first continuous evaluation activity (possible dropout) but continue accessing the VLE to download learning resources or read the messages posted on VLE forum. We identified these students as dropout recoverable, because they still have interest and there is a change or recovering them if providing a personalized attention. Finally, indicators S10, S11 and S12 show academic information about students. Academic indicators of academic program managers (see Figure 5) show information about the academic performance (S9, S10, S11, S12), student plagiarism (S7, S8) and analysis of the forum messages in the VLE (S1, S2, S3, S4, S5, S6). Note that this information is presented at different temporal levels (current semester and past semesters) and program levels (at a level of academic program –which may be a degree or a master–, minors and subjects). In order to define the indicators it is necessary to gather information related to educative experiences of teachers and students satisfaction. These indicators can be applied to any academic program realized in a full virtual university or university which complements face-to-face classes with online learning. A significant indicator is the student satisfaction. Knowing the student satisfaction is important to design the improvement actions for academics. Usually the mechanisms to determine the satisfaction of the students are surveys. However, their trustworthiness is arguable; the reasons are that they are usually performed too late (at the end of the semester when it is impossible to change things), few surveys are done (is unfeasible to make surveys anytime to determine the satisfaction of the students), they are not mandatory (information is lost) and their interpretation and therefore their results can be subjective. For all these factors we believe that, although surveys are useful mechanisms for getting feedback from students, they should not be the only source of information for discovering student satisfaction. In universities based on a fully online learning, teachers have lost the visual contact, making it difficult to them to estimate the student satisfaction. However when using VLE, students communications can be analyzed automatically [19], using data generated during the learning process to discover new information about students satisfaction. Students communicate with each other and with teachers through messages sent to the VLE. In the VLE forum the students comment on their learning experience, course content, learning resources, timing, evaluation activities and teachers. So, we can use traditional means such as interviews or surveys to determinate the level of student satisfaction, and we can also use techniques opinion mining and natural language processing to focus the satisfaction of students on different educative aspects. Opinion mining and sentiment analysis techniques [19, 20] are based on a set of algorithms that detect the feelings and opinions in a text, namely, what felt / opined who wrote the text when he did it. The use of these techniques in. iJET ‒ Volume 11, Issue 7, 2016. VLE [19, 20, 21] helps to detect specific problems within the teaching-learning process that can be solved in a short time, such as non-accessible web resource or identify comprehension problems of a topic that difficult to student progress by sending mass forum post. Opinion mining techniques can be used in universities who make a percentage of their teaching in a VLE. C. Data Warehouse DW provides a centralization of the different data relevant for analytics in a single repository to provide: (a) a single gateway to information, (b) current and historical data needed for decision-making. The DW is a business intelligence tool that will store a large volume of data, in different formats and types (structured and unstructured). The sources of data DW are: data users (students, teachers and academic program managers), academic data (students), interaction data (messages of VLE forum) and navigation data (timestamp of access, learning resources downloaded, messages read, answered and deleted, and so on). D. Dashboards In dashboards, information is presented using various elements, such as alarms or graphics. They show in a useful and summarized way a set of indicators that gives analytical information of a given domain. Dashboards may be interactive and allow navigating data through either different abstraction levels or different aggregation of data. The proposed teacher’s dashboard (see Figure 6) presents the indicators defined. To make it easy the understanding of the dashboard information, indicators have been grouped by categories in different tabs: performance, continuous assessment activities, plagiarism and teaching. Snapshot of Figure 6 shows the graphical representation of S10, S11 and S12 indicators in the teacher’s dashboard. The academic program manager’s dashboard has the same structure as the teacher’s dashboard but with different indicators. The dashboard also aggregates information of different subjects according to their belonging academic program and present historical information. VI. CONCLUSIONS AND ONGOING WORK Currently, higher education is experiencing a paradigm shift. Society changes and the university should also change. In the evolution of industrial society to knowledge society, the university responded by incorporating new academic programs, updating their courses or contents and developing new methodologies to place the student at the center of the teaching process. Today, universities should continue to react to the current economic crisis, the saturation of job market in some countries and the new innovations in learning, such as MOOC. The university institution is looking for solutions to sustain educational excellence with a reduction of financial and personal resources. If this situation is to perpetuate in the time, university will need tools that easy the achievement of their excellence goals in a more sustainable way. In this article we propose an analytical system for educational decision-making of the teaching process performed on VLE. We humbly believe that systems such as the proposed one, when extended, supported by the university direction and used in the whole university, can help universities to improve quality in a more sustainable fashion.. 39.
(7) SPECIAL FOCUS PAPER ADOPTION OF BUSINESS STRATEGIES TO PROVIDE ANALYTICAL SYSTEMS FOR TEACHERS IN THE CONTEXT OF … Most universities use a VLE as Moodle and Blackboard, where they perform a percentage of their teaching and learning process. So, teachers need time to manage information generated from the VLE. Moreover, it would be necessary to make decisions about educational data obtained from the VLE with intuitive graphical tools that allow seeing, at first glance, the actual performance of subjects, the student opinion about teaching or resources, and detecting educational aspects to improve. Even though the visualization should be simple and intuitive, the presented data should be based on facts and evidences, not perceptions. The large volume of data, extracted from the interactions of the students with the VLE when learning, can be used to provide such information to teachers. Providing analytical systems for teachers of VLE, we are innovating and projecting universities to a higher level in the analytical pyramid, but we are also reducing the time spent for teachers in the information management of VLE to create knowledge about the teaching process. That does not mean that the goal of this research is to “steal” the work of teachers, but to give them more time to address the relevant and value-added processes: improve teaching, research and innovation. REFERENCES [1] [2] [3]. [4]. [5]. [6] [7] [8]. [9] [10] [11]. [12]. [13]. 40. K.C. Laudon, and J.P. Laudon, Management information systems: managing the digital firm, New Jersey, 2014. S. Sieber, J. Valor and V. Porta, Los sistemas de información en la empresa actual. McGrawHill, 2006. M. Muntean et al., “Business intelligence systems in support of university strategy”, Recent Researches in Educational Technologies, in Proceedings of the 7th WSEAS/IASME International Conference on Educational Technologies, EDUTE’11, 2011, pp.118– 123. K. E. Arnold and M. D. Pistilli, “Course signals at purdue: using learning analytics to increase student success”, in Proc. of the 2nd Int. Conf. on Learning Analytics and Knowledge, New York: ACM, 2012, pp. 267–270 http://dx.doi.org/10.1145/23306 01.2330666 R. Lukman, P. Glavic, “What are the key elements of a sustainable university?”, in Clean Technologies and Environmental Policy, 2007, vol.9, n.2, pp 103-114. http://dx.doi.org/10.1007/s10098006-0070-7 D. L. Bennett, A. R. Lucchesi and R. K. Vedder, “For-Profit Higher Education: Growth, Innovation and Regulation”, Center for College Affordability and Productivity, 2010. T. Bailey, N. Badway and P. J. Gumport, For-Profit Higher Education and Community Colleges, CA: Stanford University, 2001. B. K. F. Garrity, M. J. Garrison, and R. C. Fiedler, Access for whom, access to what? The role of the “disadvantaged student” market in the rise of for-profit higher education in the United States, Journal for Critical Education Policy Studies, 2010, vol.8, n.1, pp. 202-244. A. I. Morey, Globalization and the emergence of for-profit higher education. Higher Education, 2004, vol.48, n.1, pp.131-150. http://dx.doi.org/10.1023/B:HIGH.0000033768.76084.a0 S. R. Cellini, For-profit higher education: An assessment of costs and benefits. National Tax Journal, 2012, vol.65, n.1, pp.153-180. http://dx.doi.org/10.17310/ntj.2012.1.06 G. Miron et al., “Profiles of For-Profit and Nonprofit Education Management Organizations: Thirteenth Annual Report-20102011”, Boulder, CO: National Education Policy Center, May 2012. S. Sterling, “Higher education, sustainability, and the role of systemic learning”, in Higher education and the challenge of sustainability, The Netherlands: Kluwer Academic Publishers, 2004, pp. 49-70, http://dx.doi.org/10.1007/0-306-48515-X_5 R. Addo-Tenkorang, and P. Helo, “Enterprise resource planning (ERP): A review literature report”, in Proc. of the World Congress on Engineering and Computer Science, 2011,vol.2, pp.19-21.. [14] C. Dell’Aquila, et al., “Business intelligence solution for university management”, in Proc. of the 10th WSEAS Int. Conf on Mathematical Methods and Computational Techniques in Electrical Engineering. World Scientific and Engineering Academy and Society (WSEAS), 2008. pp. 318-324. [15] V. Sakys, R. Butleris, “Business Intelligence tools and technologies for the analysis of university studies management”. Transformation in Business & Economics, 2011, vol. 10, n.2, pp.125136. [16] M. B. Piedade and M. Y. Santos, “Business intelligence in higher education: Enhancing the teaching-learning process with a SRM system”, in Information Systems and Technologies (CISTI), 2010, 5th Iberian Conference on’, IEEE, pp. 1–5. [17] M. H. Falakmasir, et al., “Business intelligence in e-learning: case Study on the Iran University of Science and Technology Data Set”, in Software Engineering and Data Mining (SEDM), 2010 2nd International Conference, IEEE, 2010, pp.473-477. [18] F. Di Tria, E. Lefons, and F. Tangorra, “Research data mart in an academic system”, in Engineering and Technology (S-CET), Spring Congress on, IEEE, 2012, pp. 1–5. http://dx.doi.org/10.1109/scet.2012.6341952 [19] P. Long, G. Siemens, Penetrating the FOG: Analytics in Learning and Education. EDUCAUSE review, 2011, vol.46, n.5. [20] John P. Campbell, Peter B. DeBlois and Diana G. Oblinger, Academic Analytics: A new Tool for a new era. EDUCAUSE review, July/August 2007, pp. 41-47. [21] J. Conesa and J. Curto. Introducción al Business Intelligence. EditorialUOC, May 2010. [22] H. Chen, Roger H. L. Chiang, and Veda C. Storey. Business Intelligence and Analytics: From big data to big impact. MIS Quarterly, 2012, vol. 36, n.4, pp. 1165-1188. [23] J. L. Roldán, G. Cepeda and J. L. Galán, Los sistemas de inteligencia de negocio como soporte a los procesos de toma de decisiones en las organizaciones, Papeles de Economía Española, 2012, n.132, pp. 246. [24] T.H. Davenport, J.G. Harris and R. Morison. Analytics at work: Smarter decisions, Better results. Harvard Business Press, marzo 2009. [25] Haji H. Binali, Chen Wu and P. Potdar. “A new significant area: emotion detection in e-learning using opinion mining techniques”, in Digital Ecosystems and Technologies. DEST’09, 3rd IEEE International Conference on IEEE, 2009, pp. 259-264. [26] Dan Song, Hongfei Lin and Zhihao Yang, “Opinion Mining in eLearning System”, in Network and Parallel Computing Workshops. NPC Workshops, IFIP International Conference on, IEEE, 2007, pp. 788-79. http://dx.doi.org/10.1109/npc.2007.51 [27] I. Guitart, et al., “Opinion Mining on Educational Resources at the Open University of Catalonia”, in Complex, Intelligent, and Software Intensive Systems (CISIS), 2013 Seventh International Conference on IEEE, pp. 385-390. http://dx.doi.org/10.1109/cisis. 2013.70 [28] J. Bichsel, Analytics in higher education: Benefits, barriers, progress, and recommendations, EDUCAUSE Center for Applied Research, 2012. [29] M. van Harmelen and D. Workman, Analytics for learning and teaching. CETIS Analytics Series, 2012, vol.1, n.3, pp.1-40.. AUTHORS Isabel Guitart and Jordi Conesa are with the Department of Computer Science, Multimedia, and Telecommunication, Open University of Catalonia, Barcelona, Spain ({iguitarth, jconesac}@uoc.edu). This research was partly funded by the eLearn Center from the UOC, the SmartLEARN research group and the Spanish Government through the project TIN2013-45303-P "ICT-FLAG" (Enhancing ICT education through Formative assessment, Learning Analytics and Gamification). This article is an extended and modified version of a paper presented at the Fifth International Workshop on Adaptive Learning via Interactive, Collaborative and Emotional approaches (ALICE 2015) in conjunction with the Seventh International Conference on Intelligent Networking and Collaborative Systems (INCOS 2015), held in Taipei, Taiwan, September 2-4, 2015. Submitted 25 June 2016. Published as resubmitted by the authors 29 June 2016.. http://www.i-jet.org.
(8)
Figure

Documento similar