Laser Phase noise Cancellation in Chirped pulse Distributed Acoustic Sensors
9
0
0
Texto completo
(2) Journal of Lightwave Technology. Laser Phase-noise Cancelation in Chirped-pulse Distributed Acoustic Sensors. Journal of Lightwave Technology. r Fo. Journal:. Manuscript ID. Manuscript Type: Date Submitted by the Author:. Fernández-Ruiz, María; Universidad de Alcalá, Electronics Pastor-Graells, Juan; University of Alcalá, Electronics Martins, Hugo; FOCUS S.L., R&D Garcia-Ruiz, Andres; Universidad de Alcala de Henares, Electronics Martin-Lopez, Sonia; Alcala University, Electronics Gonzalez-Herraez, Miguel; Alcala University, Electronics Rayleigh scattering, Phase noise, Chirp modulation, Optical time domain reflectometry, Remote sensing. ew. Category:. 28-Jul-2017. vi. Key Words:. OFS25. Re. Complete List of Authors:. JLT-21008-2017. Detectors and Sensors. ly. On.
(3) Page 1 of 7 Journal of Lightwave Technology > REPLACE THIS LINE WITH YOUR PAPER IDENTIFICATION NUMBER (DOUBLE-CLICK HERE TO EDIT) <. Laser Phase-noise Cancelation in Chirped-pulse Distributed Acoustic Sensors María R. Fernández-Ruiz, Juan Pastor-Graells, Hugo F. Martins, Andres Garcia-Ruiz, Sonia MartinLopez, and Miguel Gonzalez-Herraez Abstract— Distributed acoustic sensors (DAS) based on chirped-pulse phase sensitive-optical time-domain reflectometry (chirped-pulse ΦOTDR) have proven capable of performing fully distributed, single shot measurements of true strain or temperature perturbations, with no need for frequency scanning or phase detection methods. The corresponding refractive index variations in the fiber are revealed in the chirped-pulse ΦOTDR trace through a local temporal shift, which is evaluated using trace-to-trace correlations. The accuracy in the detection of this perturbation depends upon the correlation noise and the coherence of the laser source. In this work, we theoretically and experimentally analyze the impact of the laser phase noise in chirped-pulse ΦOTDR. In particular, it is shown that the noise in the readings of strain/temperature variations scale directly with the frequency noise power spectral density of the laser. To validate the developed model, an experimental study has been performed using three lasers with different static linewidths (5 MHz, 50 kHz and 25 kHz), i.e., with different phase noise. Besides, we present a simple technique to mitigate the effect of the laser phase noise in chirped-pulse ΦOTDR measurements. The proposed procedure enables to detect perturbations with high signal-to-noise ratio even when using relatively broad linewidth (i.e. comparatively high phase noise) lasers. Up to 17 dB increase in SNR has been experimentally achieved by applying the proposed noise cancellation technique.. r Fo. evolution towards a competitive, cost-effective distributed acoustic sensing (DAS) tool of high interest for a wide range of applications, such as intrusion monitoring over long perimeters, structure health monitoring, distributed birefringence measurements, among others [3-6]. The operation principle of ΦOTDR is similar to traditional OTDR technology [7], i.e., it consists of launching a train of optical pulses into the fiber under test (FUT) and comparing consecutive traces received at the input end of the fiber via Rayleigh backscattering. The fundamental difference between both technologies is the fact that ΦOTDR employs a coherent source to generate the probe pulses, instead of an incoherent source as employed in OTDR. Several analyses have been performed to evaluate the effect of the coherence of the probe light source on the performance of this sensing system [8-11]. As general conclusion, the coherence length of the source has to be at least longer than the probe pulse width for vibration monitoring via direct detection of the backscattered trace (typically ranging from 1 to 10 meters) [9,10]. However, the detected power trace varies nonlinearly with the undergone change and therefore, the perturbation applied onto the FUT cannot be properly quantified. If the absolute value of the perturbation needs to be obtained, the most effective method is to acquire the trace phase using coherent detection methods [12]. In those cases, the sensing range will be related to the coherence length of the laser and highly coherent lasers (i.e., with very narrow linewidth) are desired [11-13], substantially increasing the system cost. Recently, a novel methodology to achieve high-resolution, quantitative dynamic temperature or strain variation measurements using ΦOTDR has been proposed and demonstrated by the authors [14]. It relies on the linear modulation of the instantaneous frequency of the probe pulse (i.e., linear chirp). It has been demonstrated that using a linearly chirped probe pulse, a perturbation in the refractive index of the FUT is translated into a localized, controlled temporal shift of the backscattered trace. This temporal shift is proportional to the applied perturbation, allowing a systematic quantification of the refractive index variation with no need for phase detection systems or time-consuming frequency sweeping strategies [15]. Hence, by calculating local correlations of trace segments between two consecutive power measurements, the absolute value of the applied perturbation can be readily obtained. The accuracy in the correlation measurements broadly depends on two factors: (i) the. ew. vi. Re. Index Terms— Rayleigh scattering, phase noise, chirp modulation, optical time domain reflectometry, remote sensing.. P. HASE-SENSITIVE. optical time-domain reflectometry (ΦOTDR) sensing technology was first proposed over two decades ago [1,2] and since then, it has suffered a major Manuscript received Month xx, xxxx; revised Month xx, xxxx; accepted Month xx, xxxx. Date of publication Month xx, xxxx; date of current version Mont xx, xxxx. This work was supported in part by: The European Research Council through project U-FINE (Grant 307441); the EC Horizon 2020 program through the FINESSE project MSCA-ITN-ETN-722509; the DOMINO Water JPI project, under the WaterWorks2014 co-founded call by EC Horizon 2020 and Spanish MINECO; the Spanish MINECO (projects TEC2013-45265-R and TEC2015-71127-C2-2-R); and the regional program SINFOTON-CM: S2013/MIT-2790. The work of JPG and SML was supported by the Spanish MINECO (FPI and “Ramón y Cajal” contracts, respectively) The work of AGR was supported by the UAH (FPI contract). M. R. Fernández-Ruiz, J. Pastor-Graells, A. Garcia-Ruiz, S. Martin-Lopez and M. Gonzalez-Herraez are with the Departamento de Electrónica, Universidad de Alcalá, 28805 Madrid, Spain (e-mail: [email protected], [email protected]; [email protected]; [email protected]; [email protected]). H. F. Martins is with FOCUS S. L., C/ Orellana, 1, 1º Izqda, 28804 Madrid, Spain (email: [email protected]).. ly. I. INTRODUCTION. On. 1 2 3 4 5 6 7 8 9 10 11 12 13 14 15 16 17 18 19 20 21 22 23 24 25 26 27 28 29 30 31 32 33 34 35 36 37 38 39 40 41 42 43 44 45 46 47 48 49 50 51 52 53 54 55 56 57 58 59 60. 1.
(4) Journal of Lightwave Technology > REPLACE THIS LINE WITH YOUR PAPER IDENTIFICATION NUMBER (DOUBLE-CLICK HERE TO EDIT) < correlation noise, which is in turn related to the linear chirp applied to the probe signal, the correlation window, and the signal-to-noise ratio of the trace; and (ii) the phase noise of the light source. In this manuscript, we carry out an analysis of the impact of the laser phase noise on the detection of strain perturbations applied to an FUT, and to what extent the applied linear chirp can affect the signal-to-noise ratio (SNR) of the measurements for a particular laser source. Besides, we propose a simple technique to mitigate the laser phase noise in chirped-pulse ΦOTDR-based DAS. In particular, we demonstrate that an improvement of up to 17 dB in the SNR of the temporal shift calculation can be readily achieved using the proposed technique. II. ANALYSIS OF THE EFFECT OF LASER PHASE-NOISE IN CHIRPED-PULSE ΦOTDR A. Operation principle of chirped-pulse ΦOTDR Before presenting the theoretical analysis of the impact of the laser phase noise in the sensor, several basic relations in chirped-pulse ΦOTDR are reviewed in this sub-section. A comprehensive description of the fundamentals of this sensing technology can be found in [14]. As in traditional ΦOTDR, any uniform perturbation (caused by a temperature or strain change) in a section of the FUT can be treated as a refractive index change, which induces a change in the optical path difference between scattering centers. Such refractive index change can be compensated by a shift of the pulse frequency (assuming small index changes, n n where n is the effective refractive index of the fiber). When a linearly chirped pulse is launched into the FUT, that refractive index variation translates into a proportional temporal shift t in the corresponding section of the detected power trace. The relationship between n and with t is related to the amount of chirp applied as [14] 1 p n (1) t , n 0 0 p where 0 is the central frequency of the probe pulse, p is its. r Fo. whose. frequency profile is given by (t) 0 p 2 p t p . The expression of P(t, z). instantaneous. . . can be written as j 2 t t t j t P t , z E0 rect t t z p e z e r ,. (2). where t z is considered to be the time taken by the pulse to reach the position z in the fiber and r t is the random phase noise induced by the laser. The random instantaneous frequency due to the phase noise r t is defined as. r t . 1 d r t . 2 dt. (3). According to (1), it can be easily demonstrated that, to first order, the frequency noise of the laser r t induces a local temporal shift in the trace p tr t t . (4) r p Hence, the temporal shift induced in the trace will be then associated to a variation in the refractive index of the FUT, inducing an error in the strain measurement. Thereby, this induced error is related with r t as. S . vi. Re. Sr. 0.78 0 . 2. f ,. (5). where S and Sr are the strain and the random instantaneous. ew. above expression, p. , so that there is a linear. relationship between temporal shift and refractive index (or frequency shift) variation [14]. This leads to the requirement that t has to be much shorter than p (namely within 2-3%, as observed experimentally), imposing a limit to the maximum measurable perturbation for a particular value of chirp. The induced temporal shift t can be obtained by means of traceto-trace temporal correlations. Once n is known, it can be directly related with the temperature change T or strain with the expressions provided by Y. Koyamada in [16], i.e., n n 6.92 106 T 0.78 . B. Impact of the laser phase noise in the system Let us assume that probe pulse P(t, z) has a rectangular intensity profile of amplitude E0 and temporal length p , and. proportional to Sr [17]. From (5), it can be concluded that the strain uncertainty of the sensor is also proportional to the laser static linewidth. Hence, choosing a laser with low phase noise is, in principle, essential to realize low uncertainty measurements [18]. Equation (4) shows the inverse relationship between the chirped pulse bandwidth and the tr error induced by the laser phase noise. Thus, when the laser phase noise is the limiting factor, the higher the probe pulse chirp, the lower the uncertainty in the determination of the delay. However, the nominal delay induced by the refractive index variation to be measured is also inversely proportional to the pulse chirp (1) [14]. Eventually, the chosen pulse chirp will have no effect on the accuracy of the measurand in chirped-pulse ΦOTDR schemes (i.e. both signal amplitude and laser phase noise effects scale inversely with the chirp). Still, it is important to consider that, due to the relationship between delay and probe pulse width inherent to the system ( t 0.03 p ) [14], a higher. ly. temporal length, and p is the chirp spectral content. In the. frequency noise power spectral densities (PSD), respectively, and f is the laser static linewidth, which is directly. On. 1 2 3 4 5 6 7 8 9 10 11 12 13 14 15 16 17 18 19 20 21 22 23 24 25 26 27 28 29 30 31 32 33 34 35 36 37 38 39 40 41 42 43 44 45 46 47 48 49 50 51 52 53 54 55 56 57 58 59 60. Page 2 of 7 2. pulse chirp will enable the proper measurement of higher vibration amplitude between two consecutive traces, see (1). As such, the most convenient choice in terms of chirp values appears to be the higher chirp value allowed by the available system detection bandwidth..
(5) Page 3 of 7 Journal of Lightwave Technology > REPLACE THIS LINE WITH YOUR PAPER IDENTIFICATION NUMBER (DOUBLE-CLICK HERE TO EDIT) <. Fig. 1. Experimental setup used for the analysis of phase noise in chirpedpulse ΦOTDR. For that purpose, a strain perturbation applied in a piezoelectric transducer (PZT) is detected using three lasers with different linewidth and the resulting measurement SNR is compared. The acronyms in the setup are explained in the body of the manuscript.. III. EXPERIMENTAL ANALYSIS. r Fo. The conclusions reached in the previous section are experimentally validated in what follows. The setup employed to carry out the analysis of the phase noise is shown in Fig. 1, which can be divided in three main blocks. The first block accounts for the generation of the chirped probe pulse. Here, a laser diode (LD) working in continuous emission is driven by a current and temperature (I&T) controller to select the central wavelength. A secondary current control applies a repetitive electric ramp signal to the laser driver, inducing a linear chirp at certain times in the outputted light. Then, a semiconductor optical amplifier (SOA) gates the chirped signal creating square optical pulses of 100 ns width with an extinction ratio > 50 dB and a repetition rate of 40 kHz. The chirp spectral content of the pulses is controlled by the peak voltage of the ramp, which is varied to induce spectral contents of 350 MHz, 590 MHz and 860 MHz, corresponding to chirp values of 3.5 1015 s-2, 5.9 1015 s-2 and 8.6 1015 s-2, respectively. An erbium-doped fiber amplifier (EDFA) boosts the power of the optical pulses before injecting them into the fiber. A dense wavelength division multiplexer (DWDM) follows the EDFA to filter out part of the generated amplified spontaneous emission (ASE). The bandwidth of this DWDM is 0.8 nm. Finally, a tunable attenuator is used to control the peak power of the pulses so that nonlinear effects along the FUT are avoided. The second block corresponds to the FUT. It consists of a fiber spool of 1 km whose last 20 m are coiled around a piezoelectric transducer (PZT). The PZT is connected to an electrical signal generator and allows us to apply controlled vibrations on the fiber. The third block handles the detection of the backscattered trace. For this purpose, the signal is first amplified and filtered in. Then, the resulting signal is directly detected using a p-i-n photo-detector with a bandwidth of 1 GHz and a high-speed digitizer with 40 GSps sampling rate. To study the relationship between the measurement uncertainties and the laser phase noise, three LDs with different linewidths, namely 5 MHz, 50 kHz and 25 kHz, have been employed. The PZT induces a sinusoidal perturbation of 2 kHz and amplitude of 40 nε, which is first detected using the three lasers and the chirped pulses of 860 MHz. In this case, the resolution of the measurement is 1 nε. The three strain. ew. vi. Re. ly. On. 1 2 3 4 5 6 7 8 9 10 11 12 13 14 15 16 17 18 19 20 21 22 23 24 25 26 27 28 29 30 31 32 33 34 35 36 37 38 39 40 41 42 43 44 45 46 47 48 49 50 51 52 53 54 55 56 57 58 59 60. 3. Fig. 2. Strain measurements from the last 100 m of the FUT, employing three lasers with different linewidths: (a) ∆f = 5 MHz (b) ∆f = 50 kHz (c) ∆f = 25 kHz.. measurements are presented in Fig. 2, which shows the last 100 m of FUT. In the remainder of this paper, we refer all the mentioned fiber positions to those last 100 m. In the figure, the noise level difference between measurements is clearly noticeable. In particular, Fig. 2(a) shows the measurement obtained when using the laser with the highest linewidth, i.e., 5 MHz. The region affected by the vibration, between 70 m and 90 m in the figure, can be discerned but it is slightly diffuse due to the high level of noise covering the measurement. In contrast, the lasers with lower linewidths (lower phase noise) present better results, as observed in Fig. 2(b) and (c). Here, the region affected by the vibration is clearly defined and the non-affected region is almost totally flat. As expected, the laser with lowest linewidth (25 kHz) presents the best results. In order to quantify the SNR improvement in the.
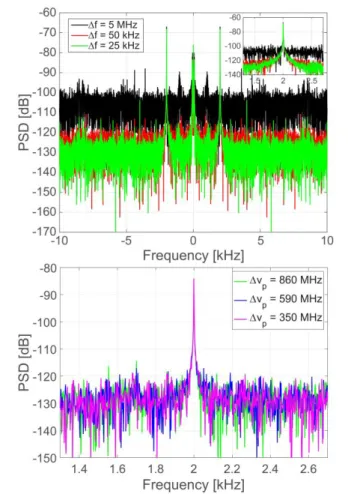
(6) Journal of Lightwave Technology > REPLACE THIS LINE WITH YOUR PAPER IDENTIFICATION NUMBER (DOUBLE-CLICK HERE TO EDIT) <. Besides, we also experimentally verify that the chosen pulse chirp does not affect the measurement SNR. For this purpose, the recovered strain variation is obtained for three different chirp values, corresponding to pulse spectral contents of 350 MHz, 590 MHz and 860 MHz, respectively, using the laser with lowest phase noise (i.e., 25 kHz static linewidth). To carry out these measurements, we have reduced the amplitude of the applied sinusoidal perturbation to match with a value of properly measurable strain when using the lowest pulse chirp [14]. The PSD of the obtained results is plotted in Fig. 3(b). As it can be observed from the figure, the strain amplitudes and noise levels are independent on the employed chirp. Note that, although lower values of chirp lead to higher measures of delay (1), the strain amplitude is adequately attained in all cases. Similarly, the level of noise has scaled proportionally, in good agreement with the expected outcome.. r Fo vi. Re Fig. 3. Power spectral density (PSD) of 2 kHz vibrations detected along 0.4 s recording time. (a) Results obtained when using a probe pulse with chirp spectral content of 860 MHz, generated from the laser with linewidth of 5MHz (black line), 50 kHz (red line) and 25 kHz (green line). The inset shows a detail of the 2 kHz frequency peak. (b) Results obtained when using the laser with 25 kHz linewidth and different values of chirp, namely 860 MHz (green line), 590 MHz (blue line), and 350 MHz (pink line).. ew ly. measurements obtained from the different lasers, we compare the power spectral density (PSD) of the recorded vibrations, namely at 78 m (point of maximum amplitude), over a recording time of 0.4 s. The obtained PSDs are plotted in Fig. 3, from which we can verify that the 2 kHz vibration has been correctly detected. A low frequency, noise of about <100 Hz is also present in the measurements, which is mainly attributed to mechanical and thermal fluctuations along the measurements. The frequency peak has almost the same amplitude (-68 dB) in the three curves while the background noise is substantially different in each case, leading to an SNR of 34.4 dB when using the laser with 5 MHz linewidth (black line); while the SNR increases to 54.7 dB and 56.7 dB for the lasers of 50 kHz (red line) and 25 kHz (green line), respectively. Thus, an SNR increase of 20.3 dB (laser with linewidth of 50 kHz) and 22.3 dB (laser with linewidth of 25 kHz) is obtained as compared with the results obtained from the 5 MHz-linewidth laser. The experimental results show a good agreement with the theoretical model: according to Eq. 4, the expected SNR increase between the 5 MHz-linewidth laser and the 50 kHz and 25 kHz-linewidth lasers should be of 20 dB (20.3 dB experimental) and 23 dB (22.3 dB experimental), respectively.. On. 1 2 3 4 5 6 7 8 9 10 11 12 13 14 15 16 17 18 19 20 21 22 23 24 25 26 27 28 29 30 31 32 33 34 35 36 37 38 39 40 41 42 43 44 45 46 47 48 49 50 51 52 53 54 55 56 57 58 59 60. Page 4 of 7 4. Fig. 4. Strain measurements after laser phase-noise compensation using the laser with linewidth of (a) 5 MHz; (b) 50 kHz; and (c) 25 kHz..
(7) Page 5 of 7 Journal of Lightwave Technology > REPLACE THIS LINE WITH YOUR PAPER IDENTIFICATION NUMBER (DOUBLE-CLICK HERE TO EDIT) < IV. PHASE-NOISE CANCELLATION METHOD As explained in Section II.B, in chirped-pulse ΦOTDRbased sensors the phase noise directly induces an error in the strain measurement, which is proportional to the laser frequency fluctuations (3,4). In this Section, we present a simple methodology to significantly reduce the error induced by the laser phase noise in this sensing technology. The finite linewidth of commercially available lasers produces a deviation in the emitting frequency over the nominal central frequency 0 . This variation must be slower than the pulse width, as this is a general restriction of ΦOTDR setups (i.e., the laser source must have a coherence time longer than the pulse width). However, the central frequency of each pulse may differ from pulse to pulse, 0 r , k , where the subscript k stands for each different pulse within the input pulse train. Under these considerations, it is inferred that each detected backscattered trace may suffer a particular deviation (i.e. a local delay) that is maintained along the whole trace, but different from the other traces. This phenomenon is clearly observed in Fig. 2(a), in which horizontal lines, corresponding to a noise pattern which is constant along the fiber position but varying in time, appear superimposed to the signal. This means that the frequency fluctuations of the input laser can be, to some extent, measured with the chirped-pulse ΦOTDR scheme. This is the basis that allows compensation of this noise. Hence, to mitigate the effect of that laser phase noise in ΦOTDR measurements, we propose the following simple strategy. A portion of FUT must be kept unperturbed. The trace resulting from this fiber section will only contain low frequency environmental fluctuations (which can be minimized e.g., by introducing this section of fiber under a water bath or in a soundproof box) and the frequency fluctuations caused by the laser linewidth. By averaging the temporal shift induced in the trace along this unperturbed fiber section, it is possible to obtain the temporal pattern of laser frequency fluctuations ( r , k ) and compensate them along the. r Fo. ew. vi. Re. Fig. 5. Power spectral density (PSD) of 2 kHz vibrations when using a probe pulse with chirp spectral content of 860 MHz, generated from the laser with linewidth of (a) 5MHz (black line), (b) 50 kHz (red line) and (c) 25 kHz (green line), before and after laser phase-noise compensation.. ly. complete fiber length. The length of the unperturbed section has to be chosen long enough so that fast phase noise fluctuations plus additional terms of thermal and optical noise are completely averaged. To prove the validity of the proposed technique, we have calculated the laser frequency-noise fluctuations from the first 20 m of FUT shown in Fig. 2 (recall that the figure shows the last 100 m of fiber). We have subtracted the fluctuation average obtained from these 20 m to the whole detected traces. The obtained results are plotted in Fig. 4, from which we can observe a substantial improvement in the detection of the sinusoidal vibrations. This improvement is particularly evident in the case in which the 5 MHz-linewidth laser is employed (Fig. 4(a)). In this case, the background noise has been almost completely eliminated, in such a way that the sinusoidal perturbation is now clearly distinguishable. To quantify the attained improvement, we have measured the SNR from the PSD of the resulting curves. Fig. 5 presents the PSD of the compensated measurements at 78 m, over 0.4 s. The SNR. On. 1 2 3 4 5 6 7 8 9 10 11 12 13 14 15 16 17 18 19 20 21 22 23 24 25 26 27 28 29 30 31 32 33 34 35 36 37 38 39 40 41 42 43 44 45 46 47 48 49 50 51 52 53 54 55 56 57 58 59 60. 5. improvement achieved from the proposed frequency-noise compensation method is 14.1 dB for the 5 MHz-linewidth laser (Fig. 5(a)); 17.1 dB for the 50 kHz-linewidth laser (Fig. 5(b)); and 16.4 dB for the 25 kHz-linewidth laser (Fig. 5(c)). The fact that the noisiest laser presents the lowest frequencynoise compensation can be due to the fact that the proposed technique only compensates for the instantaneous frequency fluctuation (i.e., the first derivative of the laser phase noise, see (3)). In general, a noisier laser will have higher values of higher-order phase noise components, which cannot be compensated by the proposed methodology. In addition, in Fig. 5, we can also observe that the low frequency fluctuations (< 100 Hz) are maintained after the laser frequency-noise compensation, which corroborates the fact that we have only affected the frequency noise fluctuations of the laser, but not the small thermal and mechanical drifts of the reference fiber section. Also, in the PSD obtained from the lasers with 50 kHz.
(8) Journal of Lightwave Technology > REPLACE THIS LINE WITH YOUR PAPER IDENTIFICATION NUMBER (DOUBLE-CLICK HERE TO EDIT) < and 25 kHz bandwidth it is possible to observe harmonics of the fundamental vibration frequency that could be barely observed prior to the frequency noise compensation. It is worth mentioning that those harmonics have an amplitude about 25 dB below the fundamental peak, attesting for the high linearity of the chirped-pulse ΦOTDR sensing technology. The obtained results expose the strong potential of chirped-pulse ΦOTDR for high SNR strain measurements even when using relatively low coherence lasers (although always much longer than the probe pulse width).. [5]. [6]. [7]. [8]. V. CONCLUSIONS The negative impact of the laser phase-noise in chirpedpulse ΦOTDR-based sensors has been studied both theoretically and experimentally. In particular, we have proven that the laser phase-noise induces an uncertainty in the temperature/strain measurement which is directly proportional to the laser frequency fluctuations. This is owing to the fact that the random frequency drifts of the laser generate different temporal shifts in the traces, which are readily associated with variations in the refractive index of the FUT. Hence, we have shown that narrower laser linewidths allow a significant increase in the SNR of the strain recording. The experimental analysis has been performed using three different lasers with linewidths of 5 MHz, 50 kHz and 25 kHz, respectively. An SNR enhancement of ~22 dB has been obtained when decreasing the linewidth from 5 MHz to 25 kHz, in good agreement with the expected theoretical trend. Additionally, considering the way the laser phase-noise impacts on the detected traces, we have presented a simple technique to mitigate the induced temperature/strain uncertainty. The basis of the technique lies on the fact that small frequency deviations in the input laser can be quantified in a section of fiber that is mechanically and thermally isolated. This unperturbed fiber section allows us to measure the pulse-topulse frequency deviation, and therefore compensate for this deviation in each trace by simple subtraction of the corresponding delay. By using this method, up to 17 dB SNR enhancement has been achieved (14 dB when using the noisiest laser, i.e., that one with 5 MHz linewidth). The presented results reveal the robustness of chirped-pulse ΦOTDR, since it allows single shot, quantitative, high SNR strain measurements with relatively low coherent laser sources (still always with much longer coherence times than the pulse width) and direct detection schemes.. r Fo. [9]. [10]. [11]. [12]. [13]. vi. Re. [14]. M. A. Soto, X. Lu, H. F. Martins, M. Gonzalez-Herraez, and L. Thévenaz, “Distributed phase birefringence measurements based on polarization correlation in phase-sensitive optical time-domain reflectometers,” Opt. Express, vol. 23, no. 19, pp. 24923-24936, Sept. 2015. J. Tejedor, H. F. Martins, D. Piote, J. Macias-Guarasa, J. PastorGraells, S. Martin-Lopez, P. Corredera Guillén, F. De Smet, W. Postvoll, and M. Gonzalez-Herraez, “Toward prevention of pipeline integrity threats using a smart fiber-optic surveillance system,” J. Lightw. Technol., vol. 34, no. 19, pp. 4445-4453, Mar. 2016. M. K. Barnoski, M. D. Rourke, S. M. Jensen, and R. T. Melville, “Optical time domain reflectometer,” Appl. Opt., vol. 16, no. 9, pp. 2375-2379, (1977). H. F. Martins, S. Martin-Lopez, P. Corredera, M. L. Filograno, O. Frazão, M. Gonzalez-Herraez, “Coherence noise reduction in high visibility phase-sensitive optical time domain reflectometer for distributed sensing of ultrasonic waves,” J. Lightw. Technol., vol. 31, no. 23, pp. 3631-3637, Oct. 2013. Y. Muanenda, C. J. Oton, S. Faralli, T. Nannipieri, A. Signorini, and F. Di Pasquale, “Hybrid distributed acoustic and temperature sensor using a commercial off-the-shelf DFB laser and direct detection,” Opt. Lett., vol. 41, no. 3, pp. 587-590, 2016. H. F. Martins, S. Martin-Lopez, P. Corredera, J. D. Ania-Castañon, O. Frazão, and M. Gonzalez-Herraez, “Distributed vibration sensing over 125 km with enhanced SNR using phi-OTDR over a URFL cavity,” J. Lightw. Technol., vol. 33, no. 12, pp. 2628-2632, Jun. 2015. Z. Wang, L. Zhang, S. Wang, N. Xue, F. Peng, M. Fan, W. Sun, X. Qian, J. Rao, and Y. Rao, “Coherent Φ-OTDR based on I/Q demodulation and homodyne detection,” Opt. Express, vol. 24, no. 2, pp. 853-858, Jan. 2016. Ezra Ip, Alan Pak Tao Lau, Daniel J. F. Barros, and Joseph M. Kahn, "Coherent detection in optical fiber systems," Opt. Express, vol. 16, no. 2, pp. 753-791, Jan. 2008. B. Moslehi, “Analysis of optical phase noise in fiber-optic systems employing a laser source with arbitrary coherence time,” J. Lightw. Technol., vol. 4, no. 9, pp. 1334–1351, 1986. J. Pastor-Graells, H. F. Martins, A. Garcia-Ruiz, S. Martin-Lopez, and M. Gonzalez-Herraez, "Single-shot distributed temperature and strain tracking using direct detection phase-sensitive OTDR with chirped pulses," Opt. Express, vol. 24, no. 12, pp. 13121-13133, Jun. 2016. H. Iida, Y. Koshikiya, F. Ito, and K. Tanaka, “High-sensitivity coherent optical time domain reflectometry employing frequency-division multiplexing,” J. Lightw. Technol., vol. 30, no. 8, pp. 1121-1126, Oct. 2011. Y, Koyamada, M. Imahama, K. Kubota, and K. Hogari, "Fiber-optic distributed strain and temperature sensing with very high measurand resolution over long range using coherent OTDR," J. Lightw. Technol., vol. 27, no. 9, pp. 1142-1146, Apr. 2009. S. Camatel, and V. Ferrero, “Narrow linewidth CW laser phase noise characterization methods for coherent transmission system applications,” J. Lightw. Technol., vol. 26, no. 17, pp. 3048-3055, Sep. 2008. J. Pastor-Graells, M. R. Fernández-Ruiz, H. F. Martins, A. Garcia-Ruiz, S. Martin-Lopez and M Gonzalez-Herraez, “Impact of the laser phase noise on chirped-pulse phase-sensitive OTDR,” in 25th Optical Fiber Sensors Conference (OFS), 2017, pp. 1-4.. ew. [1] [2]. [3]. [4]. C. E. Lee, and F. T. Henry, “Apparatus and Method for Fiber Optic Intrusion Sensing,” U.S. Patent 5 194 847, March, 16, 1993. J. Park, L. Wanku, and F. T. Henry, “Fiber optic intrusion sensor with the configuration of an optical time-domain reflectometer using coherent interference of Rayleigh backscattering,” in Proc. SPIE, 1998, pp. 49–56. Z. Qin, L. Chen, and X. Bao, “Wavelet denoising method for improving detection performance of distributed vibration sensor,” IEEE Photonic Technol. Lett., vol. 24, no. 7, pp. 542–544, Jan. 2012. Z. N. Wang, J. Li, M. Q. Fan, L. Zhang, F. Peng, H. Wu, J. J. Zeng, Y. Zhou, and Y. J. Rao, "Phase-sensitive optical time-domain reflectometry with Brillouin amplification," Opt. Lett., vol. 39, no. 15, pp. 4313–4316, Aug. 2014.. [16]. [17]. [18]. ly. REFERENCES. [15]. On. 1 2 3 4 5 6 7 8 9 10 11 12 13 14 15 16 17 18 19 20 21 22 23 24 25 26 27 28 29 30 31 32 33 34 35 36 37 38 39 40 41 42 43 44 45 46 47 48 49 50 51 52 53 54 55 56 57 58 59 60. Page 6 of 7 6. María R. Fernández-Ruiz received her M.S. degree in Electronic Systems and Signal Processing from the University of Seville, Spain, in 2011. She received her PhD degree in Telecommunications from the University of Quebec, Canada, in 2016. Her research focused on advanced photonic signal processing techniques inspired by the space-time duality for ultrafast optical signals, and new, ultra-broadband optical processors based on fiber Bragg gratings. Currently, she is a postdoctoral research fellow at the Photonics Engineering Group at the University of Alcalá, Spain, under the supervision of Prof. Miguel GonzalezHerraez. Her research activities focus on the development of novel techniques for enhancing the performance (resolution, range) of distributed optical sensing systems based on phase-.
(9) Page 7 of 7 Journal of Lightwave Technology > REPLACE THIS LINE WITH YOUR PAPER IDENTIFICATION NUMBER (DOUBLE-CLICK HERE TO EDIT) < sensitive optical time-domain reflectometry, and simple, energy efficient techniques for characterization of complexenvelope optical signals. Juan Pastor-Graells received the physics degree from the University of Valencia, Valencia, Spain, in 2013 and the Master’s degree in advanced electronics systems from the University of Alcala, Madrid, Spain, in 2014. Since 2013, he has been working toward the Ph.D. degree in the Photonics Engineering Group, University of Alcala, Madrid, Spain. His current research interests include nonlinear fiber optics and fiber optic sensors. Andres Garcia-Ruiz received the physics degree from the University of Valencia, Valencia, Spain, in 2013 and the Master degree in Advanced Electronics Systems from the University of Alcalá, Madrid, Spain, in 2014. Since 2013, he has been working toward the Ph.D. degree in the Photonics Engineering Group, University of Alcalá, Madrid, Spain. His current research interests include nonlinear fiber optics and fiber optic sensors.. r Fo. Hugo F. Martins received his Ph.D. degree in Physics under jointly-awarded PhD program in the University of Porto, Porto, Portugal and the University of Alcalá, Madrid, Spain, in 2014. The topic of the doctoral dissertation was the use of Raman effect to assist distributed and remote fiber sensing. His research career was mainly focused on distributed optical fiber sensing, mainly the use of phase-sensitive optical time domain reflectometry for distributed vibration/intrusions and temperature/strain detection along large structures/perimeters. Dr. Hugo F. Martins is currently the technical director at FOCUS S.L., a company specialized fiber optic distributed sensing applications. Dr. Hugo F. Martins is an author or coauthor of more than 50 papers in international refereed journals and conference contributions and has received several important scientific recognitions, including the award of best PhD Thesis in Optics and Photonics of 2014 in Portugal by the “Sociedade Portuguesa de Óptica e Fotónica” (Portuguese Society of Optics and Photonics).. Miguel Gonzalez-Herraez received the M.Eng. and D.Eng. degrees from the Polytechnic University of Madrid, Madrid, Spain, in 2000 and 2004, respectively. While working toward the D.Eng. degree, he worked first as a Research Assistant and then as a Postdoctoral Fellow in the Applied Physics Institute, Spanish Council for Research, Madrid, Spain, and had several long stays in the Nanophotonics and Metrology Laboratory, École Polytechnique Fédérale de Lausanne, Switzerland. In October 2004, he was appointed as an Assistant Professor in the Department of Electronics, University of Alcalá, Madrid, Spain, where he was promoted to an Associate Professor in June 2006. He is the author or coauthor of more than 200 papers in international refereed journals and conference contributions and has given several invited talks at international conferences. His research interests include the wide field of nonlinear interactions in optical fibers. Dr. Gonzalez-Herraez has received several important recognitions to his research career, including the European Research Council Starting Grant and the “Agustin de Betancourt” prize of the Spanish Royal Academy of Engineering. He is also a Senior Member of the Optical Society of America.. ew. vi. Re. ly. Sonia Martin-Lopez received the Ph.D. degree from the Universidad Complutense de Madrid, Madrid, Spain, in May 2006. The topic of her doctoral dissertation was on experimental and theoretical understanding of continuouswave pumped supercontinuum generation in optical fibers. She had a pre-doctoral stay in the Nanophotonics and Metrology Laboratory, École Polytechnique Fédérale de Lausanne, Switzerland. She has been engaged as a Postdoctoral Researcher in the Applied Physics Institute and in the Optics Institute at the Spanish Council for Research during six years. She is currently a Postdoctoral Researcher in the Photonics Engineering Group, University of Alcalá, Madrid, Spain. She is author or coauthor of more than 140 papers in international refereed journals and conference contributions. Her current research interests include nonlinear fiber optics and distributed optical fiber sensors.. On. 1 2 3 4 5 6 7 8 9 10 11 12 13 14 15 16 17 18 19 20 21 22 23 24 25 26 27 28 29 30 31 32 33 34 35 36 37 38 39 40 41 42 43 44 45 46 47 48 49 50 51 52 53 54 55 56 57 58 59 60. 7.
(10)
Figure

Documento similar