© 2017 Universidad Nacional Autónoma de México, Centro de Ciencias de la Atmósfera. This is an open access article under the CC BY-NC License (http://creativecommons.org/licenses/by-nc/4.0/).
Mapping recession risk for cultural heritage stone in Mexico City due to dry
and wet deposition of urban air pollutants
Javier Omar CASTILLO-MIRANDA,1 Ricardo TORRES-JARDÓN,1 José Agustín GARCÍA-REYNOSO,1 Bertha E. MAR-MORALES,1 Francisco Javier RODRÍGUEZ- GÓMEZ2 and Luis Gerardo RUIZ-SUÁREZ1*
1 Centro de Ciencias de la Atmósfera, Universidad Nacional Autónoma de México, Circuito de la Investigación Científica s/n, Ciudad Universitaria, 04510 Ciudad de México, México
2 Departamento de Ingeniería Metalúrgica, Facultad de Química, Circuito Exterior s/n, Ciudad Universitaria, 04510 Ciudad de México, México
* Corresponding author; email: [email protected]
Received: July 22, 2015; accepted: January 27, 2017
RESUMEN
ABSTRACT
Air pollution is a threat to cultural heritage because it accelerates the natural deterioration of monuments, palaces, churches, and archaeological ruins, which have an irreplaceable value. In the Mexico City Metropol-itan Area (MCMA), there are 19 968 buildings registered as archaeological, historic, or artistic monuments. Some are built with calcareous rocks (limestone and marble) but many of them are made with andesite, tezontle and tuff stone. This paper reports for the first time the spatial distribution of the potential risk of deterioration on calcareous rocks in terms of surface recession with regard to Mexican cultural heritage in the MCMA for the base year 2007. The risk estimate was performed using Lipfert’s damage function, only applicable to carbonate stones of medium and low porosity. These include mainly medium/high density limestone and marble. Carrara white marble has a density of 2.69 g cm–3 and a porosity of 0.37%, and lime-stone has a density of 2.2-2.6 g cm–3 and a porosity of 5-20%. For high porosity (low density) limestone the function would be applicable with a potential under-estimation. In this function, annual recession rate is a function of annual averages of precipitation, pH, and dry deposition of SO2 and HNO3. Data from several meteorological monitoring networks, the MCMA air quality and acid deposition monitoring networks, and a 3D air quality model (MCCM) were interpolated in a GIS in order to obtain map layers for these vari-ables. These overlaid maps were used to apply the Lipfert functions at the specific coordinates of a small sample of relevant historic or artistic monuments. The complexity of climate gradients, wind patterns, and emissions distribution within the Mexico Megacity leads to gradients as large as 50% in estimated recession rates using the Lipfert function at nearby sites made of the same type of building materials. The Comisión Ambiental de la Megalópolis (Environmental Commission of the Megacity) divides the MCMA into five sectors. Differences in recession rates between them were, in 1990, as large as those between estimated values for Oviedo, Paris, and Prague in Europe for the period 1980-2000. Recession rates decreased by about 50% from 1990 to 2007, the base year for this report, due to the success of air pollution control actions focused on the protection of public health. Nevertheless, strong recession gradients are still expected for carbonate stone within the MCMA. The recession values reported in this work must be taken as conservative estimates due to the not yet optimal performance of 3D air quality models in urban meteorology and the high degree of uncertainty in modeling emissions inventories. Most notable is the SO2 emissions inventory. These maps call for a program of experimental determination of recession rates for building materials that comprise a very large part of Mexico’s unique cultural heritage. These maps should also be added to the critical level maps obtained for human exposure, crops, and ecosystems in order to properly estimate the actual cost of air pollution in the MCMA and the area under its influence.
Keywords: Cultural heritage, air pollution, MCMA, Mexico Megacity, recession rates.
1. Introduction
Materials exposed to the environment are at risk of degradation through natural wearing processes. Since the mid-nineteenth century, air pollution has been identified as a factor that accelerates material degradation in natural and manmade materials (Cul-trone et al., 2004). The irreplaceable value of the cultural heritage inherent to monuments, palaces, churches, and archaeological ruins is threatened by air pollution. Previous observations regarding many monuments and buildings with historical value have shown that accelerated deterioration is correlated with increases in urbanization, industrialization, and associated fossil fuel consumption.
The vast majority of rocks are composed of two or more different minerals. These minerals are joined in a strong structure that characterizes the stone and
partly determines its color, durability, and physical and chemical properties (Winkler, 1997).
1.1 Surface recession of carbonate stones
Franzoni and Sassoni (2011) exposed various types of stones, mostly containing calcite and do-lomite, to a wear process in acidic solutions. With regard to the soluble fraction, the average weight loss increased by a factor of 2.3 when the solution’s pH decreased from 5.6 to 4.0. When the pH was changed from 5 to 4, the weight loss factor was increased by a factor of 1.34. They concluded that there is a correlation between the microstructural features and the weathered rock material and established that the rate of recession depends on open porosity and the specific surface.
The deterioration of certain materials has pri-marily been documented in European cities and is characterized by calcium sulfate or gypsum shell (CaSO4 • 2H2O) formation, resulting from high
air concentrations of sulfur dioxide (SO2). Fassina
(1978) identified gypsum formation as the process underlying masonry deterioration in an artistic her-itage site in Venice. Skoulikidis and Papakonstati-nou-Ziotis (1981) noted that accelerated statue and monument deterioration in the Acropolis of Athens is related to dry deposits of atmospheric SO2 on the
limestone and marble surfaces and their subsequent conversion to gypsum, caused by intense industri-alization in this area. According to these authors, this polluting gas may have generated 85 to 97% of the gypsum detected, causing deterioration in these materials.
The walls of St. Rumbold’s Cathedral (Mechelen, Belgium) were constructed from limestone in the thirteenth and fifteenth centuries, and erosion in these walls has been attributed to gypsum formation. The abundance of sulfate anion in runoff waters confirmed gypsum formation; the runoff water samples were used to calculate an approximate average surface recession of 20 μm (Roekens and Van Grieken, 1989). Cobourn (1993) experimented with gypsum (CaSO4 • 2H2O) and epsomite (MgSO4 • 7H2O)
formation in a humid atmosphere over marble and dolomite surfaces through SO2 absorption. For
both dolomite and marble, the SO2 deposition rate
increased as liquid water increased on the surface. Studies of the effects of acid deposition on car-bonate rocks in the US National Assessment Program on Acid Precipitation quantify erosion of stone. Chemical analyses of rain runoff solutions show that approximately 30% of erosion by dissolution may be
attributed to wet deposition of hydrogen ion and dry deposition of sulfur dioxide and nitric acid between rain events. The remaining approximately 70% of dissolution erosion is explained by the leaching of carbonate rocks exposed to rain water in equilibrium with atmospheric carbon dioxide (Baedecker et al., 1992). Research on the effect of acid rain on car-bonate rocks yielded a 17% contribution to chemical erosion on marble and 10% on limestone (Baedecker and Reddy, 1993). The observable damage on lime-stone with a relatively high iron concentration in eighteenth-century buildings in central Stockholm has been largely attributed to acid rain (Nord and Tronner, 1995).
Portland stone samples were exposed to the en-vironment at various sites in southeastern England. A loss of material, equivalent to 16 µm yr–1 was
observed for sites located in Central London, while a loss of 10.3 16 µm yr–1 was observed for rural
sites. This stone wear was caused by the formation of gypsum due to direct reaction with both SO2 and
sulfuric acid (Jaynes and Cooke, 1987).
Delopoulou and Sikiotis (1992) used a reactor (FP-R) in a sample train containing Pentelic marble grains, with the additional use of a filter package, to determine the effect of pollutant gases. They ex-plained that the formation of Ca(NO3)2 was probably
due to the reaction of HNO2 with marble followed
by the oxidation of the obtained nitrite to nitrate, or by oxidation of HNO2 to HNO3 and the subsequent
reaction with marble. Laboratory studies of HNO3
retention on marble were done, varying the following parameters: relative humidity, the flow velocity of the HNO3 mixture, the mass of the stone, grain size,
and HNO3 concentration. It was shown that nitric
acid is a good corrosive agent for marble. Sikiotis and Kirkitsos (1995) showed that calcareous stones (Pentelic marble, Portland limestone, and Baum-berger sandstone) are appropriate sinks for gaseous HNO3. Regardless of its low porosity, at high relative
humidity, marble was more vulnerable to attack by HNO3 than limestone and sandstone. Kirkitsos and
Sikiotis (1996) also concluded that gaseous HNO3
is more corrosive than NO2 for marble monuments,
despite the considerable low concentrations of HNO3.
Fenter et al. (1995) studied the reaction of gaseous HNO3 on calcite in a flow reactor at low pressure
very high efficiency. Identification of H2O and CO2
as products suggests that the reaction of nitric acid with limestone is governed by the following equation:
CaCO3(s) + 2HNO3(g) → Ca(NO3)2(ads) +
CO2(g) + H2O(g) (1)
The reduction in the use of coal as an energy source is causing a decrease in SO2 concentration
levels in European cities. In Mexico, the substitution of fuel oil rich in sulfur, by natural gas in power plants has had a similar effect. In turn, the increased use of the automobile makes necessary to consider the role of nitrogen oxides, chlorides and ozone as accelerators of the sulfation reaction or as direct agents on the deterioration of materials. In fact, a marked increase in the amount of deterioration is seen when the stone is exposed to a combination of SO2, NOx
and O3 (Massey, 1999). Allen et al. (2000) found that
the presence of NO2 accelerates the rate of sulfation
of limestone helping the oxidation of SO2 to SO3 that
commonly is a slow process. In another route, SO3 in
water reacts with limestone to form CaSO4. Also, iron
rich suspended particles, often from diesel vehicles, can increase the oxidation of SO2 on the stone surface
(Grossi and Brimblecombe, 2002).
Black scabs found in European monuments and buildings located in urban environments contain mo-lecular markers characteristic of petroleum products (Saiz-Jiménez and Hermosín, 2004). There has been a shift from high levels of sulfate deposition; nitro-gen compounds and diesel soot now predominate in stones (Grossi and Brimblecombe, 2007). The pres-ence of NO2 in photochemical smog ensures nitric
acid formation; therefore, its relative importance to corrosion of old buildings and artifacts has increased (Tzanis et al., 2009).
Output from air quality numerical models was used to apply the Lipfert damage function (Lipfert, 1989) in order to produce maps of recession rates of materials. Cultural heritage sites in London and Barcelona were used to validate this method (Watt et al., 2007). Spatial mapping of combined observations and modeled data has been used to establish public policies and to understand the spatial character of air quality trends in Europe (Denby et al., 2010).
Using the micro-erosion meter method (MEM), erosion rates were determined for limestone at
St. Paul’s Cathedral for decadal periods (1980-1990, 1990-2000, and 2000-2010). These rates were com-pared with recession rates derived from applying the Lipfert damage function (Lipfert, 1989) to available data on rain and SO2 in central London for the same
periods. Erosion rates were 3.33 and 2.77 times higher than the recession rates in the 1980s and 2000s, respectively. The observed decrease in ratios was attributed to the decrease in SO2 levels (Inkpen
et al., 2012).
1.2 Monument deterioration in Mexico
Some studies on monument deterioration in Mexico were found in the literature, mostly focused on eval-uating and restoring this damage (Bravo et al., 1994, 1995). An analysis of ignimbrite (a type of rhyolite rich in SiO2) blocks in the Morelia cathedral (state
of Michoacán) indicated that they had deteriorated by exposure to SO2. This was suggested by a
cor-relation between their mechanical strength and the SO2 levels in the air, most likely from motor vehicles
and a paper factory (Alonso and Martínez, 2003). A field study correlated limestone deterioration at archaeological sites in coastal areas in southeastern Mexico with rainwater acidity (Bravo et al., 2006). In Puerto Morelos, Quintana Roo, Mexico, precipi-tation was characterized by pH values of 5.35 for an average weighed volume; in certain instances, the pH was as low as 4.6 (Bravo et al., 2000). In the city of San Francisco de Campeche, Mexico, included on the UNESCO Cultural Heritage List, the Forts of San Carlos and San Pedro were built with limestone rocks. The degradation observed in these buildings was generally attributed to the volume and intensity of precipitation. However, the existence of gypsum samples from the Fort of San Pedro revealed the influence of SO2 emissions from vehicular and
in-dustrial sources in the region, including offshore oil platforms (Reyes et al., 2011).
dissolution rate is slower in stone with a high percent-age of SiO2 (Martínez-González, 1992). Atmospheric
corrosion maps for metals in Mexico were created using the ISO 9223 standard classification system. This work required average annual corrosion values for test stations as well as meteorological and air pollution data, such as SO2 and chloride ions (Cl–)
(Mariaca et al., 1999).
1.3 Air pollution in the Mexico City Metropolitan Area
Studies evaluating the damage to cultural heritage sites in the MCMA have focused on rainwater acidity as the key factor (Martínez-González, 1992). In ad-dition, the MCMA has serious air pollution problems that impact public health (SMA, 2008) as well as crops and ecosystems (Fenn et al., 2002; Ortiz-Garda et al., 2002); thus, it is likely that such pollutants also damage the cultural heritage sites. SO2 is considered
one of the main pollutants in the MCMA. However, erosion and deterioration of stone in the Valley of Mexico is affected by four main factors: the extreme pollution in the metropolitan area, the semi-arid sub-tropical climate, the specific hydrological situation, and frequent seismic activity (Wedekind et al., 2011).
SO2 is generated by burning fuels with sulfur,
emitted by volcanoes and, to a lesser extent, produced by certain industrial processes such as smelting and petroleum refining. Due to the growth of the city, including its industrial sector, SO2 became a serious
pollution problem in the early 1970s. Jáuregui et al. (1981) found that this problem was due to the use of sulfur-rich fuels. Also, an oil refinery was located within the city limits. SO2 concentration levels were
higher in the north of the MCMA, where most indus-tries were located. SO2 was also spatially distributed
in a north-south direction due to the city’s westerly winds. In a six-month sampling study from January to July 1959, Bravo (1960) reported that the SO2
levels in the northwestern part of the city reached an average 24-h concentration of 1.28 ppm and an av-erage monthly maximum of 0.33 ppm. Furthermore, the SO2 concentration in the southwestern part of the
MCMA reached an average 24-h maximum of 0.42 ppm; however, over the six-month study, it averaged a monthly maximum of 0.08 ppm. As a reference, the World Health Organization suggests 0.047 ppm for the average concentration over 24 h (WHO, 2006).
In 1990, the average hourly concentrations for SO2
in the MCMA (90th percentile) reached 0.115 ppm. In 2007, this percentile was reduced to 0.027 ppm (SMA, 2008); nevertheless, between 2000 and 2005, the MCMA was still recognized as the primary urban area in Latin America with high SO2 levels (WHO,
2006). It is worth mentioning that this region is still influenced by major anthropogenic sources such as the Tula industrial complex, located north of the MCMA. The MCMA is also affected by natural sources, such as the Popocatépetl volcano east of the urban area, which produces emissions that occasion-ally affect the urban area (Garda-Escalante, 2008; De Foy et al., 2009a, b). Acid rain records for the MCMA indicate relatively high acidity in the 1990s for the western portion of the region, with a gradient toward neutral values in the east. Such conditions have changed over time, and in 2007 only a small area southwest of the city maintained such acidity. The reduced acidity tended toward neutrality for the areas north and northeast of the MCMA (SMA, 2008). Due to its geographic position, the Valley of Mexico has a rainy season between June and Sep-tember; thus, the lowest yearly pollution levels were recorded during these months. The dry season yields the highest concentrations of SO2 and other pollutants
(SMA, 2009). Therefore, archaeological, historic, and artistic monuments in the MCMA are likely to be at risk during the entire year due to pollutants such as SO2 and acid precipitation.
There are few studies of HNO3 levels in the
MCMA and virtually none that address the spatial distribution of these levels. Available data indicate that this gaseous species exhibits a behavior that is somewhat similar to that of O3, with a maximum
during the day and lower values at night. There is an apparent gradient increase from north to south-south-west (Moya et al., 2004; Rosas-Pérez et al., 2006; Zheng et al., 2008; Wood et al., 2009; Cuevas, 2014). The major source of HNO3 is the reaction of NO2
with the OH radical.
Measurements of HNO3 in 2010 in the
southwest-ern part of the MCMA (Cuevas, 2014) indicate that from midnight until 05:00 LT, HNO3 levels remain
25th and 75th percentiles), in apparent coincidence with values for NO2. The maximum value of HNO3
in this period was about 6.5 ppb. However, from this period until 13:00 LT, the medians decrease to about 2.5 ppb with an increased uncertainty, as the 25th and 75th percentiles range from 2 to 8 ppb, respectively, with major peaks at 10 ppb. This suggests that in the morning there is a net production of HNO3 due
to the reaction of NO2 with OH. Once the OH
rad-ical maximum is reached, a competition for NO2 is
established with other organic radicals. HNO3 also
forms aerosols with NH3. Moreover, there is a strong
HNO3 removal caused by contact with surfaces due to
intensified atmospheric turbulence. By the afternoon, HNO3 levels are low mainly due to a lower formation
rate. At night, the remaining HNO3 can be converted
to NH4NO3 and dry deposition mechanisms rapidly
remove the low remaining HNO3 concentrations.
Since HNO3 is soluble in water, it is expected that
in the rainy season its concentrations are in parts per trillion.
Given this background, the purpose of this study was to build surface recession maps for carbonate materials in the MCMA. These recession maps were created using the Lipfert damage function (Lipfert, 1989). A small sample of historic and artistic monu-ments in the MCMA built with carbonate stones was selected. Maps of the parameters necessary for the application of the Lipfert function were constructed by combining data from monitoring networks with the results of air quality models. This is the first work done in Mexico that shows a spatial estimation of the deterioration risk of cultural heritage in the MCMA due to exposure to high levels of air pollution.
2. Methods
2.1 Types and properties of stones
The stones found in Mexico’s historic buildings are andesite, tezontle, and tuff (Pirella and Ramírez, 2001) and calcareous stones. The latter can be clas-sified as sedimentary (limestone and dolostone) and metamorphic (marble). Limestone is mainly com-posed of calcite (CaCO3) and dolostone mainly of
dolomite (CaMg(CO3)2) minerals.
One kind of carbonate stone found in Mexico’s historic monuments is the Tepotzotlán gargoyle stone. This is an unconsolidated hybrid tuff with a very porous matrix made of carbonate and dolomite in
the interior edges, and it also contains clay and glass. Its porosity ranges from 34 to 40% with a density of 1.3 to 1.6 g cm–3 (Martínez-González, 1992). It is
also possible to find a type of red limestone on the pedestal of the monument to Christopher Columbus with a density of 2.2-2.6 g cm–3 and a porosity of
5-20% (Winkler, 1997).
Metamorphic rocks are igneous or sedimentary rocks recrystallized by the effects of temperature and pressure. Recrystallization of limestone results in marble. Marble is composed of large, interlocking calcite crystals, which form the recrystallization of smaller grains in the parent rock (Tarbuck et al., 2005). Carrara white marble is found in the Palacio de Bellas Artes, Hemiciclo a Juárez, the statues at the Columna de la Independencia, and the Monumento a los Niños Héroes. Carrara white marble has a density of 2.69 g cm–3 and porosity of
0.37% (ASTM, 1979), and in accordance with its density value is classified as class III (high density) (ASTM, 1996).
2.2 Selection of the damage functions
Several surface recession functions for stones have been developed, mainly in Europe. Haynie et al. (1976) focused on white Cherokee marble; Livingston (1992) on carbonate stone; Webb et al. (1992) worked on samples of Portland limestone; Baedecker et al. (1992) on marble and limestone; while Tidblad et al. (1998, 2001) studied Portland limestone and dolomite as well as white Mansfield sandstone. Empirical recession functions were developed as part of large European projects (Kucera, 2005; Kucera et al., 2007).
considers a model of limestone and marble of me-dium and high density (ASTM, 1996). The function assumes a constant stone density of 2.7 g cm–3.
However, there are stones such as Portland and Hontoria with porosity of 20% and a density close to 2.0 g cm–3 (Bonazza et al., 2009).
Acid rain dissolution models were used to esti-mate the chemical degradation of calcium carbonate rocks in buildings (Reddy et al., 1985). These mod-els associated laboratory data on physical proper-ties, providing the basis for the theoretical damage function. This function considers three mechanisms for the loss of stone material (Lipfert, 1989). The first is the dissolution of stone by ‘clean’ rain water at a pH > 5.5. This is due to the solubility of calcite as a function of atmospheric CO2, temperature, and
porosity, as well as the physical characteristics of the stone. The second mechanism is the reaction with gas-phase SO2 and HNO3, which requires
knowledge of their deposition rate. This allows for the estimation of the flow to the surface of the stone depending on weather conditions and the configuration of the stone. The third mechanism is the increased dissolution of stone by acid rain. This is affected by solubility equilibrium (Reddy et al., 1985) and by the kinetics of the dissolution rate (Lipfert, 1989).
Lipfert (1989) quantifies the annual recession of CaCO3 stone, considering the mechanisms of natural
dissolution or karst effect, acid rain, and the deposi-tion of pollutants:
L = 18.8 · R + 0.016 · [H+] · R +
0.18(VdS[SO2] + VdN[HNO3]) (2)
where L = yearly recession (μm year–1); 18.8 is a
constant based on the solubility of CaCO3 in
equilib-rium with 330 ppm (μm m–1 of precipitation); R is the
precipitation rate (m year–1); 0.016 is a constant valid
for rain pH between 3 to 5; (H+] is the hydronium ion
concentration (μmol L–1) estimated from the annual
pH of rainfall; and VdS and VdN are deposition rates
(cm s–1) for SO
2 and HNO3, respectively.
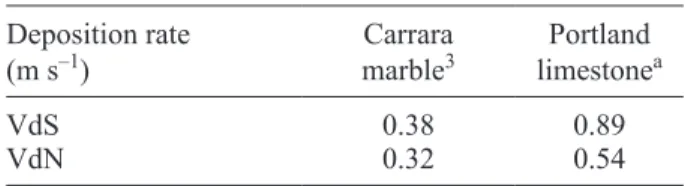
Concentra-tion units for these are given as μg m–3. Table I shows
the deposition rates used in the Lipfert function. The carbonate rocks considered in this study are marble and limestone. Nitric acid is not commonly measured in air quality monitoring networks. The
availability of data is therefore limited. The following empirical function, derived in the MULTI-ASSESS project, allows for the estimation of nitric acid from NO2, O3, Rh and temperature data (Kucera, 2005):
[HNO3] = 516 · e–3400/(T+273) (NO2] · [O3] ·Rh)0.5 (3)
where [HNO3] = concentration of HNO3; T is
tem-perature in ºC; [NO2] = concentration of NO2; [O3] =
concentration of O3; Rhr = relative humidity (%). All
concentration units are in μm m–3.
The estimation of nitric acid required the annual average hourly values from (3). Parameters were used from the databases generated by the Red Automática de Monitoreo Atmosférico (Automatic Atmospheric Monitoring Network, RAMA) (SMA, 2011) and the Red de Meteorología y Radiación (Solar Mete-orology and Solar Radiation Network, REDMET) (SMA, 2011). These parameters are simultaneously monitored in nine stations: Tlalneplantla, Tacuba, ENEP-Acatlán, Chapingo, Xalostoc, Merced, Pedre-gal, Plateros, and Cerro de la Estrella.
2.3 Calculation sequence
To generate the recession map, the following steps were performed. First, the monuments were located and identified based on the data and criteria in offi-cial catalogues for the type of construction material. One category was used: calcareous (carbonate) stone (limestone and marble). In the second step, the available data on measured concentrations of sulfur dioxide (SO2), hydronium ion (H+), and
me-teorological parameters were integrated with results from an air quality numerical simulation model. The data and results were applied using mathematical functions suitable for the construction of spatial dis-tribution maps through interpolation. Subsequently, these values were used to apply damage functions corresponding to a certain type of stone in order to
Table I. Deposition rate of SO2 (Vds) and HNO3 (VdN) measured in field exposure tests.
Deposition rate
(m s–1) marbleCarrara3 limestonePortlanda
VdS 0.38 0.89
VdN 0.32 0.54
generate the recession layers. In the next stage, the recession values for the historic or artistic monument were extracted from the recession layer according to the monument’s geographic location in the MCMA. These steps are summarized and described in the following paragraphs.
2.3.1 Classification and selection of the cultural heritage sites
The Ley Federal sobre Monumentos y Zonas Arque-ológicos, Artísticos e Históricos (Federal Law on Archaeological, Artistic, and Historic Monuments and Zones) of Mexico includes the following text: “Archaeological monuments are all those remains of pre-Hispanic cultures dating back to before 1521, the year when Mexico was conquered by Hernán Cortés. Historic monuments are the heritage of the colonial period (1521 to 1810) and of the rest of the nineteenth century. Artistic monuments are the architectural and urban heritage built after 1900”. In this study, cultural heritage sites included historic and artistic monuments located in or close to the MCMA. Classification was based on the Instituto Nacional de Antropología e Historia (National Anthropology and History Institute, INAH) catalogue, which refers to 2300 archaeological monuments, 10 500 historic monuments, and 7168 artistic monuments in the Fed-eral District and the State of Mexico (CONACULTA, 2003). From these sites, which are protected by the Federal Executive, under custody of the INAH, and open to the public, a sample was selected. Then, the sample was arranged by geographical area and ma-terial type. The buildings constructed from carbonate stone comprise two historic and four artistic build-ings. Their names and locations are shown in Table II; the labels for the sites in the figures correspond to the site-identifiers in this table.
2.3.2 Database for damage function parameters
In this study, SO2 data generated by (RAMA) were
used (SMA, 2011) along with values produced using the Multiscale Climate Chemistry Model (MCCM), which employs mathematical simulations in order to approximate concentrations in areas for which measurements are not available. The MCCM was developed by the Institute of Meteorology and Climate Research-Atmospheric Environmental Research (IMK-IFU, German initials), affiliated with
the Karlsruhe Institute of Technology, Germany; it combines meteorological and chemical processes. This model includes the gaseous phase, dry depo-sition, and anthropogenic and biogenic emission chemistry, and it also incorporates explicit descrip-tions of precipitation and cloud processes (Grell et al., 2000).
In order to establish the net base values for SO2
from interpolation, the average values measured at the stations were combined with the values generated using the MCCM model. The SO2 values from the
model are representative and include a downward bias in the troposphere proximal to the surface (0-18 m) for 2007. These results were generated for a domain with 31 × 31 cells with 3 km on each side. It is important to note that the MCCM model under-estimates the SO2 concentrations because the entry
data are SO2 concentration values from the 1999 data
recorded by the national emissions inventory of the Instituto Nacional de Ecología (National Ecology Institute) of Mexico, which may not represent the MCMA conditions for 2007 (García-Reynoso, 2010). To compensate for this discrepancy, a provisional ad-justment factor was generated based on a spatial and temporal comparison with the RAMA stations. Using this factor, the MCCM model concentrations were approximated with the RAMA station measurements. Using this adjustment, a 0.52 concordance index was calculated for SO2. The annual concentration values
for SO2 include values from 26 monitoring stations
(SMA, 2011) and the values estimated using the MCCM model.
For the hydronium ion ([H+]) concentrations, the data from the Red de Depósito Atmosférico (Atmo-spheric Deposit Network, REDDA) were collected for 2007 (SMN, 2011). The average annual concen-trations for hydronium ions ([H+]) include values from 16 stations in this network.
Precipitation (rain) levels were collected from the following network databases: REDDA (SMA, 2011), PEMBU (PEMBU, 2011), and SMN (SMN, 2011); interpolation functions were then applied. The accumulated annual precipitation for 2007 includes values from 53 meteorological stations distributed throughout the Valley of Mexico air basin.
implemented in Mexico City, we used the same data sources, except for PEMBU, to estimate quadrant-av-eraged recession rates for Mexico City in 1990.
2.4 Creating layers using a Geographical Informa-tion System
2.4.1 Selection of the interpolation method
Under the Geographic Information Systems (GIS) paradigm, the layers represent a surface model that integrates statistical properties for the sample data (Canada, 2006). The layers can be created using deterministic interpolation methods such as the weighted mean through inverse-distance weighting (IDW) and the kriging geostatistical estimator de-scribed in Denby et al. (2005). The IDW method is based on the notion that proximal phenomena must have a greater influence on the estimated value than distal phenomena. Each measured point has a local influence, which is reduced linearly by the distance between the sampled and unsampled points. The intensity by which the local influence is reduced by distance is controlled by the weighting parameter “power”. If this parameter is zero, the influence is not reduced by distance, the weight will be the same, and the projected value will be an average of the values measured. If “power” is very high, only the points in close proximity to the measured values will influence the estimated value. When the power value is 2, the data are interpolated through the inverse distance squared. The kriging method is a geostatistics tech-nique similar to IDW. It uses a linear combination of weighted values in known positions to estimate values in unknown positions. The kriging method considers the distance between the sampled points and their autocorrelation. Applying the kriging method implies that modeling the semivariogram describes spatial continuity for the data and how this continuity is modified by distance and direction. Similarly, the kriging method should consider the number of neigh-bors at the time of interpolation; it should consider the semivariogram mathematical function adjustment that best condenses the observed data. As a result, this mathematical function constructs the best interpolat-ed layer. The selection of the layer depends on the optimum prediction values from the error statistics and the coefficient of determination R2.
An important property of the modeling performed using kriging is that it tends to eliminate extreme
values; it produces lower estimation error and creates generalized smoothing, while IDW modeling tends to form islands around the sample points (Canada et al., 2010). Nevertheless, the two methods are considered acceptable for atmospheric science ap-plications. The choice of method depends on the number of observations and their spatial arrangement (Rojas-Avellaneda, 2007; Kumar et al., 2011).The kriging method is a standard procedure commonly used in the European Monitoring and Evaluation Pro-gramme to create historic concentration maps (Denby et al., 2005). For example, the kriging method known as “simple kriging” is the method most commonly used to spatially analyze data on acid deposition. It uses an exponential function to model the semivar-iogram (Venkatram, 1988). The kriging method has also been applied to interpolate temperature data in 10-km cells using an exponential function (Philips and Marks, 1996). Ordinary kriging has been used to map the temporal trends in European air quality by considering SO2 (Denby et al., 2010).
The spatial representation in this study was devel-oped using the ArcGIS software (ArcGIS 9, 2008); ArcGIS uses the “geostatistical analysis” extension, which includes advanced tools for exploratory anal-yses on spatial data and assists in the construction of statistical surfaces. Optimum layer construction de-pends on the use of the proper interpolation method, which is determined for constructing vector layers by using IDW and ordinary kriging for each parameter. These layers were transformed into raster layers for subsequent application in the damage functions. Then, the interpolation method was selected based on the best coefficient of determination R2 for the
relationship between the observed and projected values at a single position, both in the vector and raster layers.
Kriging and a circular variogram model with five neighbors, or at least three, was used to interpolate the SO2 concentration layer yielding a coefficient of
determination R2 = 0.58. The kriging method with
logarithmic transformation, a spherical function, five neighbors and two as a minimum was used to generate the temperature layer with the coefficient of determination R2 = 0.54. The IDW method with
five neighbors and three as a minimum was used to produce the H+ layer with R2 = 0.08. This value was
ions and precipitation reported by the REDDA for 2007 (SMN, 2011). The graph used best represents the data reported by the REDDA for this year (SMA, 2008). The vector kriging layers for the parameters were transformed into raster layers, which generated the following coefficients of determination: [SO2],
R2 = 0.60; temperature, R2 = 0.56; [H+], R2 = 0.08;
and PP, R2 = 0.83.The HNO
3 layer was obtained using
the spatial analysis tool ArcToolbox geoprocessor. A kriging interpolation with the spherical variogram model was applied, producing a coefficient of deter-mination R2 = 0.99.
3. Results and discussion
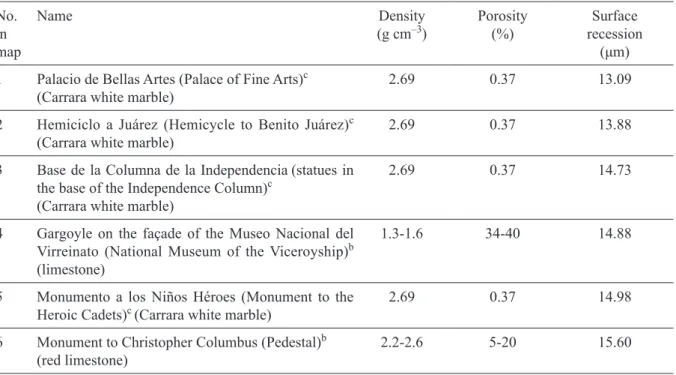
Table II shows the names and classification of artistic and historic monuments. It also shows the physical properties and estimated recession values for the se-lected sample of monuments made of marble and lime-stone, and the quarter of the MCMA where they are located as named by the local environmental authority.
The recession of the two kinds of carbonate stones considered herein was constructed using the “ras-ter calculator” tool included in the spatial analysis
extension for ArcGIS 9. This tool performs analytical operations using mathematical functions. The pro-cess includes applying the damage function, which inserts the raster layer values for the corresponding parameters. These layers represent a terrestrial space property through a series of square cells of equal size (pixels). The raster model is appropriate for representing continuous variables in space, such as meteorological and air pollution variables (Moreno, 2006). The terrestrial space properties were the in-dependent variables in the Lipfert function (Lipfert, 1989). Although somewhat arbitrary for comparison within the area of study, the value levels of the four variables in the Lipfert function were divided into five color ranks.
First, the [SO2] layer is shown in Figure 1, which
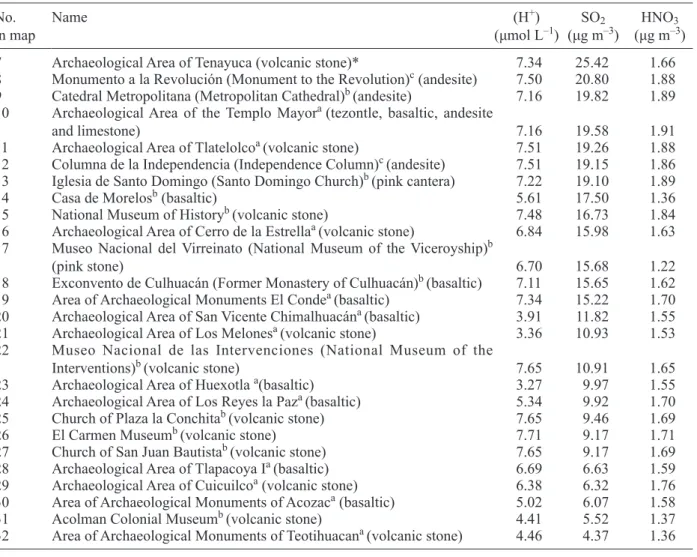
includes the monument locations (Tables II and III). Eighteen sites are in the two higher color ranks, eight in the intermediate, and five in the two lower color ranks. The spatial distribution of [HNO3] is shown in
Figure 2, with 23 sites in the two higher color ranks, five in the intermediate color ranks, and four in the lower color ranks.
Table II. Physical properties and estimated recession values (microns) in 2007, with Lipfert function for carbonate stones.
No. in map
Name Density
(g cm–3) Porosity(%) recessionSurface (μm) 1 Palacio de Bellas Artes (Palace of Fine Arts)c
(Carrara white marble) 2.69 0.37 13.09
2 Hemiciclo a Juárez (Hemicycle to Benito Juárez)c
(Carrara white marble) 2.69 0.37 13.88
3 Base de la Columna de la Independencia(statues in the base of the Independence Column)c
(Carrara white marble)
2.69 0.37 14.73
4 Gargoyle on the façade of the Museo Nacional del Virreinato (National Museum of the Viceroyship)b (limestone)
1.3-1.6 34-40 14.88
5 Monumento a los Niños Héroes (Monument to the
Heroic Cadets)c (Carrara white marble) 2.69 0.37 14.98
6 Monument to Christopher Columbus (Pedestal)b
(red limestone) 2.2-2.6 5-20 15.60
By contrast, the [H+] (Fig. 3), shows no site in the two higher color ranks, 19 in the intermediate level, and 12 in the two lower ranks. Following the same trend, with regard to precipitation (Fig. 4), only three sites are located in the two higher color ranks, 13 in the intermediate level, and 16 sites in the two lower levels.
Figure 5 overlays the distribution of marble and limestone sites with the 2007 spatial distribution of their respective recession rates. They were calculat-ed with the “raster calculator”, applying the Lipfert function using the layers shown in Figures 1-4. For 2007, two of the four marble sites in Table II, are in the intermediate range of recession and the other two are in the lower levels (Fig. 5). Also, the two limestone monuments included in Table II (Fig. 5) are in the intermediate range.
Table II shows recession values for the Palacio de Bellas Artes (13.09 µm), the base of the Columna de la Independencia (14.73 µm), and the Monumento a los Niños Héroes (14.88 µm), all made of marble. They are on a straight line 4.4 km in length. Of the Lipfert variables, precipitation seems to be the vari-able with the largest difference. The base of the mon-ument to Christopher Columbus, made of limestone and located only 1.4 km from the Palacio de Bellas Artes, shows the highest recession value (15.60 µm). The higher SO2 and HNO3 deposition rates on
lime-stone explain the higher recession value.
The sparsity of sites in Figure 5 compared with the previous figures points out that for most of the sites in the sample, recession rates can not be estimated due to the lack of damage function for the kinds of volcanic rocks used as building materials. Let us assume that this kind of materials are also sensitive to SO2, HNO3 and acid deposition. Table III shows
the estimated values of these three pollutants to which those 26 buildings made of volcanic materials were exposed in 2007. Table III could be appended with other 135 buildings made of similar materials extracted from the INAH catalog (INAH, 2015) and located within the modeling domain.
Deterioration maps for materials of the unique cultural heritage in the MCMA are unquestionably needed. This area has many archaeological, historic and artistic monuments that have been designated World Heritage Sites by UNESCO. Some note-worthy monuments include the pre-Hispanic city of Teotihuacan and the Historic Center of Mexico City (CONACULTA, 2003). The Spaniards used the stones taken from pre-Hispanic monuments to build churches, palaces, and government buildings. Some, but much less, historic and artistic monuments were also made of limestone and marble.
The primary material used for the construction of this historic and archaeological heritage was andes-ite originated from the Chiluca quarries. The Chiluca stone is a virgin rock, a porphyritic andesite augite, consisting mainly of 85% andesite and 6% augite. It has a porosity between 15 and 17% and a density of about 2.23 g cm–3. The stone of the Metropolitan
Ca-thedral was found to be a consolidated volcanic rock, friable by weathering. This rock generally comprises 85% andesite and 15% hornblende crystals. It has a medium porosity, from 14 to 17%, and its density 4
17
15
N
31 32
7
19
11 13 15
5 3
1281109
25
26
29 2722
16 18
0 4875 9750 19500 Meters
24 20
30 28
21
23
6 2
1.24 - 4.16 4.17 - 7.09 7.10 - 10.26 10.27 - 14.63 14.64 - 23.40 [SO2] (µg/m3)
Monument Archaelogical Historic Artistic
ranges from 2.32 to 2.27 g cm–3, depending on the
porosity (Martínez-González, 1992; INAH, 2007; Reyes-García, 2011). In addition, stucco, a plaster and limestone-based composite, was also used, due to the ease of painting walls or decorating interior walls with it (Martínez-González, 1992).
The pink stone of Tepotzotlán found in the Mu-seo Nacional del Virreinato is a devitrified tuff (low density and very porous), consisting of a siliceous paste made almost entirely of tridymite, which is in-cluded in the tectosilicate group. It has an unhealthy layer of weathered clay, organic in appearance. It contains a fraction of sodium plagioclase. This stone has a very high porosity, from 40 to 55%, and its density is low, ranging from 1.52 to 1.66 g cm–3
(Martínez-González, 1992). Similar petrophysical properties were also found in the stones from the Valley of Mexico used by the Aztecs to make build-ings such as the Templo Mayor, in which the main building stone is called tezontle. In Náhuatl, the Aztec language, tezontle is the name for extrusive volcanic basaltic andesite scoria. These buildings were demolished by the Spaniards in order to use the materials for the construction of the Metropolitan Cathedral and other colonial constructions such as the Palace of the Dukes of Heras Soto (Wedekind et al., 2011).
Due to the abundance of andesite, tezontle and tuff stone (Pirella and Ramírez, 2001) in the cultural heritage of the MCMA, the need for specific damage
Table III. Estimated concentration values of H+, SO
2 and HNO3 for volcanic stone.
No.
in map Name (H
+)
(μmol L–1) (μg mSO2–3) (μg mHNO–33)
7 Archaeological Area of Tenayuca (volcanic stone)* 7.34 25.42 1.66
8 Monumento a la Revolución (Monument to the Revolution)c (andesite) 7.50 20.80 1.88 9 Catedral Metropolitana (Metropolitan Cathedral)b (andesite) 7.16 19.82 1.89 10 Archaeological Area of the Templo Mayora (tezontle, basaltic, andesite
and limestone) 7.16 19.58 1.91
11 Archaeological Area of Tlatelolcoa (volcanic stone) 7.51 19.26 1.88
12 Columna de la Independencia (Independence Column)c (andesite) 7.51 19.15 1.86 13 Iglesia de Santo Domingo (Santo Domingo Church)b (pink cantera) 7.22 19.10 1.89
14 Casa de Morelosb (basaltic) 5.61 17.50 1.36
15 National Museum of Historyb (volcanic stone) 7.48 16.73 1.84
16 Archaeological Area of Cerro de la Estrellaa (volcanic stone) 6.84 15.98 1.63 17 Museo Nacional del Virreinato (National Museum of the Viceroyship)b
(pink stone) 6.70 15.68 1.22
18 Exconvento de Culhuacán (Former Monastery of Culhuacán)b (basaltic) 7.11 15.65 1.62
19 Area of Archaeological Monuments El Condea (basaltic) 7.34 15.22 1.70
20 Archaeological Area of San Vicente Chimalhuacána (basaltic) 3.91 11.82 1.55
21 Archaeological Area of Los Melonesa (volcanic stone) 3.36 10.93 1.53
22 Museo Nacional de las Intervenciones (National Museum of the
Interventions)b (volcanic stone) 7.65 10.91 1.65
23 Archaeological Area of Huexotla a(basaltic) 3.27 9.97 1.55
24 Archaeological Area of Los Reyes la Paza (basaltic) 5.34 9.92 1.70
25 Church of Plaza la Conchitab (volcanic stone) 7.65 9.46 1.69
26 El Carmen Museumb (volcanic stone) 7.71 9.17 1.71
27 Church of San Juan Bautistab (volcanic stone) 7.65 9.17 1.69
28 Archaeological Area of Tlapacoya Ia (basaltic) 6.69 6.63 1.59
29 Archaeological Area of Cuicuilcoa (volcanic stone) 6.38 6.32 1.76
30 Area of Archaeological Monuments of Acozaca (basaltic) 5.02 6.07 1.58
31 Acolman Colonial Museumb (volcanic stone) 4.41 5.52 1.37
32 Area of Archaeological Monuments of Teotihuacana (volcanic stone) 4.46 4.37 1.36 aArcheological monument; bhistorical monument; cartistic monument.
functions is evident. Additionally, these materials may also be sensitive to other pollutants not discussed here.
Finally, Table IV shows the estimated recession values for limestone, using the Lipfert function with air pollution and meteorological long-term annual period mean values for 1981-2000 in some European cities (Grossi et al., 2008). This table also contains limestone recession values estimated for 1990 in the five geographical areas used by the Metropolitan Environmental Commission to divide the MCMA. The historical data of pollutants and meteorological parameters used for (3) and the Lipfert function were obtained from local monitoring and meteorological networks (SMA, 2011). In 1990, in the MCMA, re-cession in the downtown area (CE) was close to the
0 4875 9750 19500 Meters
0.82 - 0.90 0.91 - 0.97 0.98 - 1.04 1.05 - 1.12 1.13 - 1.19 [HNO3] (µg/m3)
Monument Archaelogical Historic Artistic
32 4
17
14
31
21
23
20
30 24
28 16
18
29 26 2722
25 5 12 1081
3 6 19
7
13 9 11 2 15
N
Fig. 2. Map of annual average sulfur nitric acid concen-trations [HNO3] (µg m–3) for 2007.
3.17 - 5.18 5.19 - 6.92 6.93 - 9.42 9.43 - 14.97 14.98 - 22.62 [H+] (µmol/l) Monument
Archaelogical Historic Artistic
0 4875 9750 19500 Meters
32 4
17
14
31
21
23
20
30 24
28 16
18 26 2722
25 5 12 1081
3 6 19
7
13 9 11 2 15
N
29
Fig. 3. Map of annual average hydronium ion concentra-tions [H+] (µmol L–1) for 2007.
Table IV. Estimated recession values for limestone (1981-2000) in European cities and MCMA areas (1990).
Country/area Site/area Limestone (µm)
Spain Oviedoa 24
France Parisa 16
Czech Republic Praguea 13
MCMA Northwest 19
MCMA Northeast 17
MCMA Downtown 23
MCMA Southwest 17
MCMA Southeast 13
value reported for Oviedo. The northeast (NE) and southwest (SW) areas had recession values similar to those reported for Paris. Values for the southeast (SE) area were similar to those for Prague. From 1990 to 2007, the recession rates decreased by a factor of 1.3-1.5 in the MCMA, basically due to reductions in SO2 emissions.
4. Conclusions
Most studies on cultural heritage deterioration in the MCMA have focused on characterizing the damage to the materials of specific monuments for restoration purposes. The deterioration of cultural heritage in Mexico has also been attributed principally to acid rain, as the primary cause of damage to materials,
but dry deposition of SO2, NO2 and HNO3 may also
contribute.
To date, the only existing maps in Mexico for damage to building materials are for corrosion of metals.
To the best of our knowledge, this is the first work in Mexico that provides a spatial distribution of existing historical and cultural heritage carbon-ate stone at risk of deterioration. This was done by mapping areas of corrosion or deterioration rates. Historic and artistic monuments in these areas are susceptible to damage due to pollution and weather conditions.
In this work, maps of atmospheric concentra-tions of SO2 and HNO3, precipitation, pH of rain,
0.44 - 0.54 0.55 - 0.65 0.66 - 0.80 0.81 - 0.97 0.98 - 1.16 PP (mm) Monument
Archaelogical Historic Artistic
0 4875 9750 19500 Meters
32 4
17
14
31
21
23
20
30 24
28 16
18 26 2722
25 5 12 1081
3 6 19
7
13 9 11 2 15
N
29
Fig. 4. Map of accumulated annual precipitation PP (m)
for 2007. Fig. 5. Map of recession in marble and limestone for the year 2007.
8.47 - 10.59 10.6 - 12.94 12.95 - 15.67 15.68 - 18.72 18.73 - 22.38 Surface recession
(µm) Monument
carbonate stone Historic Artistic
0 4875 9750 19500 Meters
4
3 5 2
6 1
and other weather parameters in the MCMA were obtained by interpolating data from monitoring stations and air quality models in a GIS. The maps were then overlaid in the GIS, and the Lipfert function was applied at the specific coordinates of a small sample of cultural heritage sites.
In contrast to the building materials used in Europe and the USA, in Central Mexico, andesite tezontle and tuff stone are very abundant building materials at historic and archaeological sites. Par-amount to a proper assessment of the deterioration risk of that unique heritage is the creation of damage functions such as Lipfert’s function for the specific materials used by the ancient Mexicans and the con-quering Spaniards.
Based on the lower density and higher porosity reported for the limestone called Tepotzotlán gar-goyle, the use of Lipfert’s damage function may have led to an under-estimation of recession values for this kind of carbonate stone found in Mexico’s historic monuments. Specific Lipfert’s coefficients may also be needed.
In addition to these ad hoc damage functions, recession maps for the cultural heritage in Central Mexico can be improved by: i) including cultural heritage as a criteria for the design of air pollution and deposition monitoring networks, ii) improving emission inventories, and iii) using air quality models that are able to properly represent urban and complex terrain meteorology.
Acknowledgments
We wish to acknowledge the valuable comments and questions provided by the referees of this and a previous submission, who enabled us to refocus this work. We also wish to thank the following institutions:
Consejo Nacional de Ciencia y Tecnología (CONACYT) for the doctoral scholarship that facilitated this study and the 2006 SEMARNAT/ CONACYT projects 23801 and 23496.
Laboratorio de Química Arqueológica y Con-servación of the Instituto de Investigaciones An-tropológicas, UNAM, and Sistema de Monitoreo Atmosférico, of Mexico City, for their support in locating information.
Dirección de Registro Público de Monumentos y Zonas Arqueológicas, Coordinación Nacional de
Monumentos Históricos, INAH, and Coordinación Nacional del Servicio Meteorológico Nacional, CONAGUA, for access to unpublished databases.
Escuela Nacional de Conservación, Restauración y Museografía Manuel del Castillo Negrete, CONA-CULTA/INAH, for the information provided.
References
Alonso E. and L. Martínez, 2003. The role of environmen-tal sulfur on degradation of ignimbrites of the Cathedral in Morelia, Mexico. Build. Environ. 38, 861-867. DOI: 10.1016/S0360-1323(03)00023-4
Allen G.C., A. El-Turki, K.R. Hallam, D. McLaughlin and M. Stacey, 2000. Role of NO2 and SO2 on the degradation of limestone. Brit. Corros. J. 35, 35-38. DOI: 10.1179/000705900101501047
ArcGIS 9, 2008. Software ArcGIS 9 ArcMap Version 9.3. Environmental Systems Research Institute (ESRI), New York, USA.
ASTM, 1979. ASTM C503-89. Standard specification for marble dimension stone. American Society for Testing and Materials, Philadelphia.
ASTM, 1996. ASTM C568-89 (reapproved 1996). Stan-dard specification for limestone dimension stone. American Society for Testing and Materials, Phila-delphia.
Baedecker P.A., M.M. Reddy, K.J. Reimann and C.A. Sciammarella, 1992. Effects of acidic deposition on the erosion of carbonate stone – experimental results from the U.S. National Acid Precipitation Assessment Program (NAPAP). Atmos. Environ. B 26, 147-158. DOI: 10.1016/0957-1272(92)90018-N
Baedecker P.A. and M.M. Reddy, 1993. The erosion of car-bonate stone by acid rain. J. Chem. Edu. 70, 104-108. DOI: 10.1021/ed070p104
Bonazza A., P. Messina, C. Sabbioni, C.M. Grossi and P. Brimblecombe. 2009. Mapping the impact of climate change on surface recession of carbonate buildings in Europe. Sci. Total Environ. 407, 2039-2050.
DOI: 10.1016/j.scitotenv.2008.10.067
Bravo H.A., 1960. Variation of different pollutants in the atmosphere of Mexico City. JAPCA J. Air. Waste Ma. 10, 447-449.
DOI: 10.1080/00022470.1960.10467956
Bravo H.A., M.G. Reyes and R.J. Torres, 1995. Prelim-inary studies on the restoration of sculptures of the Metropolitan Cathedral of Mexico City. 88th Annual Meeting of the Air & Waste Management Association, Paper 94-RA117B.02. San Antonio, Texas, June, 18-23. Bravo H.A., M.I.R Saavedra., P.A. Sánchez, R.J. Torres
and L.M.M. Granada, 2000. Chemical composition of precipitation in a Mexican Maya region. Atmos. Environ. 34, 1197-1204.
DOI: 10.1016/S1352-2310(99)00305-2
Bravo H.A., R. Soto, R. Sosa, P. Sánchez, A.L. Alarcán, J. Kahl and J. Ruiz, 2006. Effect of acid rain on building material of the El Tajín archeological zone in Veracruz, Mexico. Environ. Pollut. 144, 655-660.
DOI: 10.1016/j.envpol.2005.12.052
Brimblecombe P. and C.M. Grossi, 2008. Millennium-long recession of limestone façades in London. Environ. Geol. 56, 463-471.
DOI: 10.1007/s00254-008-1465-z
Canada R., 2006. Análisis exploratorio de datos espaciales: gráficos de distribución. In: Sistemas y análisis de la información geográfica (A. Moreno, Coord.). Editorial Rama, 745-764.
Canada R., M. Vidal and A. Moreno, 2010. Interpolación espacial y visualización cartográfica para el análisis de la justicia ambiental: Ensayo metodológico sobre la contaminación por partículas atmosféricas en Ma-drid. Secretaría de Publicaciones de la Universidad de Sevilla, 691-715.
Cobourn W.G., 1993. Laboratory measurements of sulfur dioxide deposition velocity on marble and dolomite stone surfaces. Atmos. Environ. 27B, 193-201. DOI: 10.1016/0957-1272(93)90005-Q
CONACULTA, 2003. Atlas de infraestructura cultural de México. Cap. III. Patrimonio. Consejo Nacional para la Cultura y las Artes, México, 33-94.
Cuevas J.A., 2014. Correlación entre ácido nítrico gaseoso y ozono en un sitio receptor de smog fotoquímico de la Ciudad de México. Ms.C. thesis. Posgrado en Ciencias de la Tierra, UNAM, Mexico.
Cultrone G., O. Rodríguez-Navarro and E. Sebastian, 2004. Limestone and brick decay in simulated pollut-ed atmosphere the role of particulate matter. In: Air pollution and cultural heritage (C. Saiz-Jiménez, Ed.). Taylor & Francis, London, 141-146.
DOI: 10.1201/b17004-20
De Foy B., M. Zavala, N. Bei and L.T. Molina, 2009a. Evaluation of WRF mesoscale simulations and particle
trajectory analysis for the MILAGRO field campaign. Atmos. Chem. Phys. 9, 4419-4438.
DOI: 10.5194/acp-9-4419-2009
De Foy B., N.A. Krotkov, N. Bei, S.C. Herndon, L.G. Huey, A.-P. Martínez, L.G. Ruiz- Suárez, E. C. Wood, M. Zavala and L.T. Molina, 2009b. Hit from both sides: Tracking industrial and volcanic plumes in Mexico City with surface measurements and OMI SO2 retrievals during the MILAGRO field campaign. Atmos. Chem. Phys. 9, 9599-9617.
DOI: 10.5194/acp-9-9599-2009
Delopoulou P. and D. Sikiotis, 1992. A comparison of the corrosive action on Pentelic marble of nitrates and sulphates with the action of nitrogen oxides and sulphur dioxide. Atmos. Environ. 26B, 183-188.
Denby B., J. Horalek, S. Walker, K. Eben and J. Fiala, 2005. Interpolation and assimilation methods for European scale air quality assessment and mapping. Part 1: Review and recommendations. European Topic Centre on Air and Climate Change, 14-18.
Denby B., I. Sundvor, M. Cassiani, P. de Smet, F. de Leeuw and J. Horálek, 2010. Spatial mapping of ozone and SO2 trends in Europe. Sci. Total Environ. 408, 4795-4806. DOI: 10.1016/j.scitotenv.2010.06.021. Fassina V., 1978. A survey on air pollution and
deterio-ration of stonework in Venice. Atmos. Environ. 32, 2205-2211. DOI: 10.1016/0004-6981(78)90176-2 Fenn M.E, L.I. de Bauer, K. Zeller, A. Quevedo, C.
Ro-dríguez and T. Hernández-Tejada, 2002. Nitrogen and sulfur deposition in the Mexico City air basin: Impacts on forest nutrient status and nitrate levels in drainage waters. In: Urban air pollution and forest: Resources at risk in the Mexico City air basin. In: Ecological Studies 156 (M.E. Fenn, L.I. de Bauer and T. Hernández-Teje-da, Eds.). Springer, New York, 298-319.
Fenter F., F. Caloz and M. Rossi, 1995. Experimental ev-idence for the efficient ‘dry deposition’ of nitric acid on calcite. Atmos. Environ. 29, 3365-3372.
DOI: 10.1016/1352-2310(95)00183-Y
Franzoni E. and E. Sassoni, 2011. Correlation between microstructural characteristics and weight loss of nat-ural stones exposed to simulated acid rain. Sci. Total Environ. 412-413, 278-285.
DOI: 10.1016/j.scitotenv.2011.09.080
Grell G.A., S. Emei, W.R. Stockwell, T. Schoenemeyer, R. Forkel, J. Michalakes, R. Knoche and W. Seild, 2000. Application of a multiscale, coupled MM5/chemistry model to the complex terrain of the VOLTAP valley campaign. Atmos. Environ. 34, 1435-1453.
Grossi C.M., M. Murray and R.N. Butlin, 1995. Response of porous building stones to acid deposition. Water Air Soil Pollut. 85, 2707-2712.
DOI: 10.1007/BF01186244
Grossi C.M. and M. Murray, 1999. Characteristics of car-bonate building stones that influence the dry deposition of acid gases. Constr. Build. Mater. 13, 101-108. DOI: 10.1016/S0950-0618(99)00019-7
Grossi C.M. and P. Brimblecombe, 2002. The effect of atmospheric pollution on building materials. J. Phys. IV 12, Pr. 10-197.
DOI: 10.1051/jp4:20020460
Grossi C.M. and P. Brimblecombe, 2007. Effect of long-term changes in air pollution and climate on decay and blackening of European stone buildings. Geol. Soc. Spec. Publ. 271, 117-130.
DOI: 10.1144/GSL.SP.2007.271.01.13
Grossi C.M., A. Bonazza, P. Brimblecombe, I. Harris and C. Sabbioni, 2008. Predicting twenty- first century recession of architectural limestone in European cities. Environ. Geol. 56, 455-461.
DOI: 10.1007/s00254-008-1442-6
Haynie F.H., J.W. Spence and J.B. Upham, 1976. Effects of gaseous pollutants on materials. A chamber study. U.S. Enviromental Protection Agency Report EPA 600/3-76-015.
INAH, 2007. Inventario de la Zona Metropolitana del Valle de Mexico (CD-ROM). Dirección de Registro Público de Monumentos y Zonas Arqueológicos. Instituto Nacional de Antropología e Historia.
INAH, 2015. Inventario de monumentos historicos de los estados: Distrito Federal, Estado de México, Hidalgo, Morelos, Puebla y Tlaxcala (CD-ROM). Coordinación Nacional de Monumentos Históricos, Instituto Nacio-nal de Antropología e Historia.
Inkpen R., H. Viles, C. Moses and B. Baily, 2012. Mod-elling the impact of changing atmospheric pollution levels on limestone erosion rates in central London, 1980-2010. Atmos. Environ. 61, 476-481.
DOI: 10.1016/j.atmosenv.2012.07.042
Jáuregui E., D. Klaus and W. Lauer, 1981. Una primera estimación del transporte de SO2 sobre la Ciudad de México. Geofís. Int. 20, 55-79.
Jaynes S.M. and R.U. Cooke, 1987. Stone weathering in southeast England. Atmos. Environ. 21, 1601-1622. DOI: 10.1016/0004-6981(87)90321-0
Kirkitsos P. and D. Sikiotis, 1995. Deterioration of Pentelic marble, Portland limestone and Baumberger sandstone in laboratory exposures to gaseous nitric acid. Atmos. Environ. 29, 77-86.
DOI: 10.1016/1352-2310(94)00230-I
Kirkitsos P. and D. Sikiotis, 1996. Deterioration of Pentelic marble, Portland limestone and Baumberger sandstone in laboratory exposures to NO2: A comparison with exposures to gaseous HNO3. Atmos. Environ. 30, 941-950. DOI: 10.1016/1352-2310(95)00297-9
Kucera V., 2005. Model for multi-pollutant impact and assessment of threshold levels for cultural heritage. Final report. EU 5FP RTD Project, 52 pp.
Kucera V., J. Tidblad, K. Kreislova, D. Knotkova, M. Faller, D. Reiss, R. Snethlage, T. Yates, J. Henriksen, M. Schreiner, M. Melcher, M. Ferm, R-A. Lefevre and J. Kobus, 2007. UN/ECEICP materials: Dose-response functions for the multi-pollutant situation. Water Air Soil Poll. 7, 249-258.
DOI: 10.1007/s11267-006-9080-z
Kumar J.D., M. Sabesan, A. Das, N.V. Vinithkumar and R. Kirubagarn, 2011. Evaluation of interpolation tech-nique for air quality parameters in Port Blair, India. Univers. J. Environ. Res. Technol. 1, 301-310. Lipfert F.W., 1989. Atmospheric damage to calcareous
stones: Comparison and reconciliation of recent ex-perimental findings. Atmos. Environ. 23, 415-429. DOI: 10.1016/0004-6981(89)90587-8
Livingston R.A., 1992. Graphical methods for exam-ining the effects of acid rain and sulfur dioxide on carbonate stones. In: Proceedings of the 7th Interna-tional Congress on Deterioration and Conservation of Stone (J. Delgado, F. Henriques and J. Telmo, Eds.), 375-86.
Mariaca L., J. Genesca, J. Uruchurtu and L.S. Hernandez, 1999. Corrosividad atmosferica (MICAT-MÉXICO). Plaza y Valdés, Mexico, 209 pp.
Martínez-González, G.M., 1992. Aspectos fisicoquímicos del deterioro y conservación de monumentos históricos de piedra. Ph.D. thesis. Universidad Autónoma Met-ropolitana, México, 215 pp.
Massey S.W., 1999. The effects of ozone and NOx on the deterioration of calcareous stone. Sci. Total Environ. 227, 109-121.
Moreno A., 2006. Las capas raster: conceptos básicos, tipos de tratamientos y visualización. In: Sistemas y análisis de la información geográfica (A. Moreno, Coord.). Editorial RA-MA, Spain, 587-598.
Moya M., Grutter M. and Báez A., 2004. Diurnal variabil-ity of size differentiated inorganic aerosols and their gas phase precursors during January and February of 2003 near downtown Mexico City. Atmos. Environ. 38, 5651-5661.
DOI: /10.1016/j.atmosenv.2004.05.045
Nord A.G. and K. Tronner, 1995. Effect of acid rain on sandstone: The Royal Palace and the Riddarholm Church, Stockholm. Water Air Soil Poll. 85, 2719-2724. DOI: 10.1007/BF01186245
Orrayave C., F. Echeverría, F. Herrera, J. Delgado, D. Aragón and M. Morcillo, 2002. NO2 measurements in atmospheric corrosion studies. In: Outdoor atmo-spheric corrosion. ASTM
STP 1421 (H.E. Townsend, Ed.). American Society for Testing and Materials International, West Consho-hocken, PA.
Ortiz-García C.F., H.D. Laguette-Rey and L.I. de Bauer, 2002. Effects of oxidants in ambient air on annual crops in the basin of Mexico. In: Urban air pollution and forest: Resources at risk in the Mexico City air basin. Ecological Studies 156. (M.E. Fenn, L.I. de Bauer and T. Hernández-Tejeda, Eds.). Springer, New York, 320-334.
PEMBU, 2011. Programa de Estaciones Meteorológicas del Bachillerato Universitario. Available at: http:// www.ruoa.unam.mx/pembu/.
Philips L.D. and G.D. Marks, 1996. Spatial uncertainty analysis: Propagation of interpolation errors in spatially distributed models. Ecol. Model. 91, 213-229. Meli-Piralla R. and A. Ramírez-Sánchez, 2001. La
reha-bilitacion de la Catedral Metropolitana de la Ciudad de México. Revista Digital Universitaria 2, June. Available at: http://www.revista.unam.mx/vol.2/num2/proyec1/. Reddy M.M., S.I. Sherwood and B. Doe, 1985.
Model-ing limestone dissolution by acid rain. Research and Design 85, 383-388.
Reyes J., F. Corvo, Y. Espinosa-Morales, B. Dzul, T. Pérez, C. Valdés, D. Aguilar and P. Quintana, 2011. Influence of air pollution on degradation of historic buildings at the urban tropical atmosphere of San Francisco de Campeche city, Mexico. In: Monitoring, control and effects of air pollution (A.G. Chmielewski, Ed.), 201-226. DOI: 10.5772/18739
Reyes-García M., 2011. Personal communication. Roekens E. and R. Van Grieken, 1989. Rates of air
pollu-tion induced surface recession and material loss for a cathedral in Belgium. Atmos. Environ. 23, 271-277. DOI: 10.1016/0004-6981(89)90119-4
Rojas-Avellaneda D., 2007. Spatial interpolation tech-niques for estimating levels of pollutant concentrations in the atmosphere. Revista Mexicana de Física 53, 447-454.
Rosas-Pérez I., L.G. Ruiz-Suárez, A. Jazcilevich Diamant, A. García Reynoso, M. Grutter de la Mora, R. Torres Jardón, B.E. Mar Morales, J.M. Hernández Solís, A. Báez Pedrajo, H. Padilla Gordon, M.C. Torres Barrera and R. Steinbrecher, 2006. Relación ciudad-bosque en el centro de Mexico (trazadores e indicadores de reactividad fotoquímica y especiación de emisiones biogénicas). 1er. reporte. Proyecto PAPITT: IN118706. Centro de Ciencias de la Atmósfera, UNAM. Mexico. Sabbioni C., 2003. Mechanisms of air pollution damage
to stone. In: The effects of air pollution on the built environment (P. Brimblecombe, Ed.), 63-106. DOI: 10.1142/9781848161283_0003
Saiz-Jiménez C. and B. Hermosin, 2004. Black crusts in the European built environment. Corros. Rev. 22, 381-293. DOI: 10.1515/CORRREV.2004.22.5-6.381 Sikiotis D. and P. Kirkitsos, 1995. The adverse effects of
nitrates on stone monuments. Sci. Total Environ. 171, 173-182. DOI: 10.1016/0048-9697(95)04718-8 Skoulikidis T. and P. Papakonstantinou-Ziotis, 1981.
Mechanism of sulphation by atmospheric sulphur dioxide of the limestones and marbles of the ancient monuments and statues. l. Observations in situ (Acrop-olis) and laboratory measurements. Brit. Corros. J. 16, 63-69. DOI: 10.1179/000705981798274986
SMA, 2008. Secretaria del Medio Ambiente del Gobierno del Distrito Federal. Informe de la Calidad del Aire en la Zona metropolitana del valle de Mexico, Estados y tendencias 1990-2007, 50 pp.
SMA, 2009. Calidad del aire en la Ciudad de México. In-forme 2008. Secretaría del Medio Ambiente, Gobierno del Distrito Federal, 142 pp.
SMA, 2011. Sistema de Monitoreo Atmosférico SIMAT. Secretaría del Medio Ambiente, Gobierno del Distrito Federal. Available at: http://www.aire.cdmx.gob.mx (last accessed on April 28, 2011).
Tarbuck E.J., F.K. Lutgens and D. Tasa, 2005. Ciencias de la tierra. Pearson Educación, Madrid, 736 pp. Tzanis C., C. Varotsos, M. Ferm, J. Christodoulakis, M.N.
Assimakopoulos and C. Efthymiou, 2009. Nitric acid and particulate matter measurements at Athens, Greece, in connection with corrosion studies. Atmos. Chem. Phys. 9, 8309-8316. DOI: 10.5194/acp-9-8309-2009 Tidblad J., V. Kucera and A.A. Mikhailov, 1998. UN ECE
ICP on effects on materials, statistical analysis of 8 year materials exposure and acceptable deterioration and pollution levels, Stockholm. Swedish Corrosion Institute, Report no. 30, 49 pp.
Tidblad, J., V. Kucera, A.A. Mikhailov, J. Henriksen, K. Kreislova, T. Yates, B. Stockle and M. Schreiner, 2001. UN ECE ICP materials: Dose-response functions on dry and wet acid deposition effects after 8 years of exposure. Water Air Soil Poll. 130, 1457-1462. DOI: 10.1023/A:1013965030909
Venkatram A., 1988. On the use of kriging in the spatial analysis of acid precipitation data. Atmos. Environ. 22, 1963-1975. DOI: 10.1016/0004-6981(88)90086-8 Watt J., 2007. Cultural heritage stock at risk from air
pollution. In: E. Andrews, R. Machin et al., 2007. In: Highway and urban environment. Proceedings of the 8th Highway and Urban Environment Symposium (G.M. Morrison and S. Rauch, Eds.), 223-232. Webb A.H., R.J. Bawden, A.K. Busby and J.N. Hopkins,
1992. Studies on the effects of air pollution on lime-stone degradation in Great Britain. Atmos. Environ. B 26, 165- 81. DOI: /10.1016/0957-1272(92)90020-S
Wedekind W., J. Ruedrich and S. Siegesmund, 2011. Nat-ural building stones of Mexico- Tenochtitlan: their use, weathering and rock properties at the Templo Mayor, Palace Heras Soto and the Metropolitan Cathedral. Environ. Earth Sci. 63, 1787-1798.
DOI: 10.1007/s12665-011-1075-z
WHO, 2006. Air quality guidelines global update 2005. World Health Organization Regional Office for Europe. Copehhagen, Denmark.
Winkler E.M., 1997. Stone in architecture: Properties, durability. Springer-Verlag, New York.
Wood E.C., S.C. Herndon, T.B. Onasch, J.H. Kroll, M.R. Canagaratna, C.E. Kolb, D.R. Worsnop, J.A. Neuman, R. Seila, M. Zavala and W.B. Knighton, 2009. A case study of ozone production, nitrogen oxides, and the radical budget in Mexico City. Atmos. Chem. Phys. 9, 2499-2516.
DOI: 10.5194/acp-9-2499-2009
Zheng J., R. Zhang, E.C. Fortner, R.M. Volkamer, L. Molina, A.C. Aiken, J.L. Jimenez, K. Gaeggeler, J. Dommen, S. Dusanter, P.S. Stevens and X. Tie, 2008. Measurements of HNO3 and N2O5 using ion drift-chemical ionization mass spectrometry during the MILAGRO/MCMA-2006 campaign. Atmos. Chem. Phys. 8, 6823-6838.

![Fig. 2. Map of annual average sulfur nitric acid concen- concen-trations [HNO 3 ] (µg m –3 ) for 2007](https://thumb-us.123doks.com/thumbv2/123dok_es/5844170.148999/13.850.86.792.123.683/fig-annual-average-sulfur-nitric-concen-concen-trations.webp)

