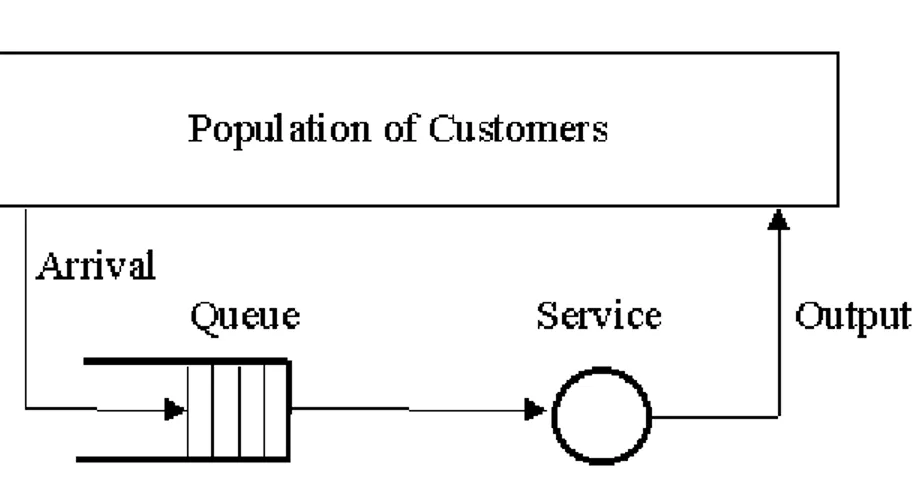
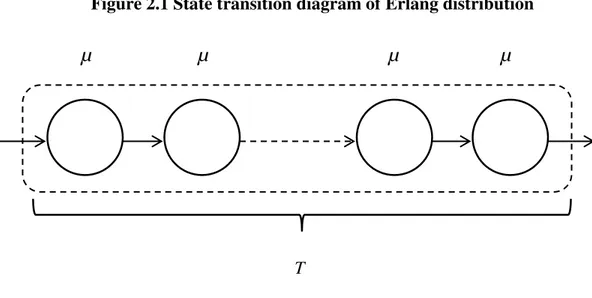
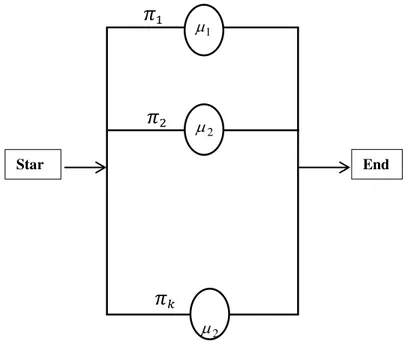
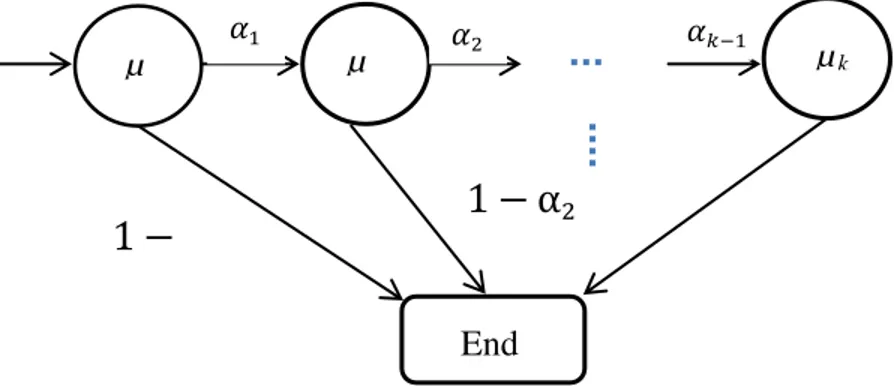
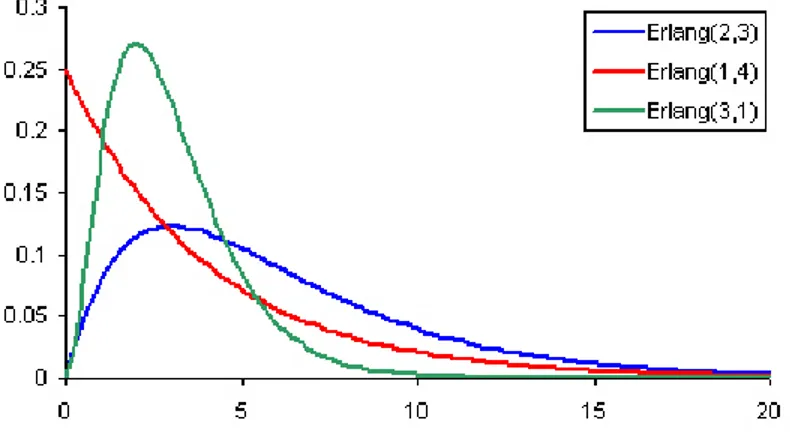
Fitting phase type distribution to service process with sequential phases
Texto completo
Figure
Documento similar
No obstante, como esta enfermedad afecta a cada persona de manera diferente, no todas las opciones de cuidado y tratamiento pueden ser apropiadas para cada individuo.. La forma
Further insight into the stripe phases can be gained by examining the intra- and interlayer pair correlation functions g ij (r) on the liquid (superfluid) side of the transition. 3),
The density distribution of sources detected in at least one IRAC channel has been analyzed as a function of the distance from the cluster center (panel (A) of Figure 5).. The
Así al aumentar el espesor de la fase extractante, aumentará el tiempo necesario para alcanzar el equilibrio, es decir, afectará a la cinética del proceso de extracción haciendo
machine learning (ML), metaheuristics (MHs), artificial neural networks (ANNs), time se- ries, extreme value theory (EVT) for fitting the statistical distribution of a set of
Figure 5 provides an explanation of the descending distribution function describing the likelihood of pest freedom after the evaluation of the systems approach for citrus
Both the fact that the distribution of the derived oxygen abundance gradients is compatible with a Gaussian distribution and this lack of correlations between the slope values and
[ 30 ] The normalized electric fields obtained with the original and the wavelet-like implementation are both presented in Figure 5 for TM z polarization, where the radiation pattern
