Revalorization of a peach (Prunus persica (L ) Batsch) byproduct: Extraction and characterization of ACE inhibitory peptides from peach stones
30
0
0
Texto completo
(2) Revalorization of a peach (Prunus Persica (L.) Batsch) byproduct: Extraction and characterization of ACE-inhibitory peptides from peach stones. Romy Vásquez-Villanueva, M. Luisa Marina, M. Concepción García* Department of Analytical Chemistry, University of Alcalá. Ctra. Madrid-Barcelona Km. 33.600, 28871 Alcalá de Henares (Madrid), Spain.. *Corresponding author (e-mail: [email protected], telephone +34-918854915; fax +34-918854971).
(3) ABSTRACT The value-added use of peach stone for production of a high protein product was investigated. Different parameters were optimized in order to obtain the highest protein yield in the extraction of peach seed proteins. Optimal conditions enabled the extraction of 43 g of protein per 100 g of dried and defatted milled seeds. Different enzymes and parameters were also tried in order to obtain the highest hydrolysis degree in the digestion of this peach seed protein isolate. Thermolysin was the enzyme that yielded the extract with the highest ACE-inhibition capability. After ultrafiltration through different molecular weight cut-off filters, potential antihypertensive peptides remained in the fraction below 3 kDa.. Three different peptides. (LYSPH,. LYTPH,. and. HLLP). resisting simulated. gastrointestinal digestion and ACE activity and demonstrating antihypertensive in vitro capacity were identified. by HPLC-MS/MS. This is the first time that potential. antihypertensive peptides have been isolated from peach stones.. Keywords: peach, seed, peptides, ACE-inhibitor, de novo sequencing..
(4) 1. Introduction There is a great concern on recycling of residues generated in the processing of foods. Despite several attempts for their reuse, these byproducts are mainly sent to landfills or are incinerated (Restrepo Gallego, 2006). The search for new recovery strategies and the revalorization of these wastes are priority items in developing countries (Arvanitoyannis & Varzakas, 2008; Piotrowska, Zevenhoven, Hupa, Giuntoli, & de Jong, 2013). Peach is a seasonal fruit belonging to the genus Prunus. In addition to its fresh consumption, large amounts of peaches are intended to produce juices, marmalades, and canned peaches, among others. Processing of peach is a source of waste material mainly made up of stones and skins. Peach stone contains a seed inside with a high protein content that has not usually been reused and characterized (Pelentir, Block, Monteiro Fritz, Regginatto & Amante, 2011; Lima, Lima, Tavares, Costa, & Pierucci, 2014). Therefore, peach seeds could constitute a cheap source of proteins and peptides. Food derived bioactive peptides can be defined as specific protein fragments that have a positive impact on body functions or conditions and may ultimately influence health (Kitts & Weiler, 2003). Proteins are recognized as rich sources of bioactive peptides. Bioactive peptides can be within the sequence of proteins in an inactive state and exert physiological actions after their release (Puchalska, Marina, & García, 2015). The release of peptides can be carried out by in vitro enzymatic hydrolysis. Different beneficial health effects have been described within bioactive peptides being angiotensin I converting enzyme (ACE) inhibitors of special interest since they are useful for the regulation of hypertension (Hartmann & Meisel, 2007; Korhonen & Pihlanto, 2006; Shahidi & Zhong, 2008; García, Puchalska, Esteve, & Marina, 2013)..
(5) Hypertension affects about a quarter of world’s population and is a major risk factor involved in cardiovascular diseases (World Health Organization, 2013). The reninangiotensin system is the main regulator of blood pression in human organism. In this system, ACE converts the decapeptide angiotensin I into the vasoconstrictor peptide angiotensin II and, at the same time, deactivates the vasodilator bradykinin (Struthers & McDonald, 2004). Therefore, this enzyme plays a significant role in the control of blood pressure. Consequently, synthetic antihypertensive drugs with capacity to inhibit ACE activity have been mostly used (Bezalel, Mahlab-Guri, Asher, Werner, Sthoeger, & 2015). Although synthetic drugs exhibit high capability to inhibit ACE, they can cause various side effects (Bezalel et al., 2015). Natural antihypertensive peptides are effective blood pressure reducers and, unlike synthetic drugs, they do not exert side effects. ACE-inhibitory peptides are small peptides (2-12 amino acids) with high level of hydrophobic amino acids and, commonly, with proline at C-terminal (Puchalska et al., 2015). Different strategies based on the extraction of bioactive peptides from food byproducts have previously been developed (García, Orellana, & Marina, 2015). Most of these works have been devoted to fish and seafood byproducts and very few contributions were focused on fruit seeds (García et al. 2015). The aim of this work was to purpose, for the first time, the revalorization of peach stones based on the extraction of peptides with ACE-inhibition capacity..
(6) 2. Materials and methods 2.1. Chemical and samples All reagents were of analytical grade and HPLC-grade water was daily obtained with a Milli-Q system from Millipore (Bedford, MA, USA). Tris(hydroxymethyl)aminomethane (Tris), hydrochloric acid, sodium phosphate, and sodium dodecyl sulphate (SDS) were from. Merck. (Darmstadt,. Germany).. Ammonium. bicarbonate,. sodium. hydroxide,. dithiothreitol (DTT), o-phthaldialdehyde (OPA), methanol (MeOH), sodium tetraborate, 2mercaptoethanol (2-ME), glutathione (GSH), acetic acid (AA), N-(2-hydroxyethyl)-1piperazinyl-N’-(2-ethanesulphonic). acid. (HEPES),. tripeptide. hippuryl-histidyl-leucine. (HHL), trifluorocetic acid (TFA), and angiotensin converting enzyme (ACE) from rabbit lung were from Sigma-Aldrich (St. Louis, MO, USA). Acetonitrile HPLC-grade (ACN), acetone, and hexane were purchased at Scharlau Chemie (Barcelona, Spain). Laemmli buffer, Tris/glycine/SDS running buffer, Mini-Protean® Precast gels, Bio-Safe Coomassie stain CBB G-250, Precision Plus Protein Standards (recombinant proteins expressed by E. Coli with molecular weights from 10 to 250 kDa), and Bradford reagent Coomassie blue G250 were obtained from Bio-Rad (Hercules, CA, USA). Thermolysin enzyme, bovine serum albumin (BSA), and pepsin and pancreatin digestive enzymes were from SigmaAldrich. Alcalase 2.4 L FG and Flavourzyme 1000 L were generously donated by Novozymes Spain S.A (Madrid, Spain) while Protease P was thankfully donated by Amano Enzyme Inc. (Nagoya, Japan). Peaches were purchased in a local market (Alcalá de Henares, Madrid, Spain)..
(7) 2.2. Protein extraction Peaches were manually pitted. Peach seeds were obtained from the stone using a nutcracker and stored at -20 °C until use. Seeds were ground with a domestic mill and moisture was determined keeping milled seeds at 103 ± 2 °C until constant weight. Ground seeds (0.5 g) were defatted with hexane (25 mL) by vigorous shaking for 30 min, this process was repeated 3 times with cleaned hexane. Final optimized conditions for the extraction of proteins from peach seeds were: A 5 mL of extraction buffer (100 mM Tris-HCl (pH 7.5), 0.5 % (w/v) SDS, and 0.5 % (w/v) DTT) were added to 30 mg of defatted peach seeds. A high intensity focused ultrasound (HIFU) probe from Sonic VibraCell (model VCX 130, Hartford, CT, USA) was employed during 1 min at 30 % of amplitude to accelerate protein extraction. After centrifugation at 4000 g for 10 min, the supernatant was collected, added to 10 mL of cold acetone, and kept in the fridge for 15 min for protein precipitation. The pellet resulting after centrifugation (4000 g for 10 min) was mixed with 100 mM Tris-HCl (pH 7.5) and 0.5 % (w/v) of SDS until complete solution. The obtained mixture was filtered with regenerated cellulose filters of 0.45 µm. Protein concentration was estimated by Bradford colorimetric assay (Bradford, 1976). 2.3. SDS-PAGE separation of proteins A Bio-Rad Mini-Protean system was employed for the separation of proteins by SDSpolyacrylamide gel electrophoresis (PAGE). Laemmli buffer consisted of 62.5 mM TrisHCl (pH 6.8), 25 % (v/v) glycerol, 2 % (w/v) SDS, 0.01 % bromophenol blue, and 5 % (v/v) 2-ME. Samples were prepared at denaturing conditions by mixing 15 µL of protein sample with 15 µL of Laemmli buffer and heating at 100 °C for 5 min. The Mini-Protean.
(8) cell was loaded with the running buffer (25 mM Tris-HCl (pH 8.3), 192 mM glycine, and 0.1 % (w/v) SDS) and gels were loaded with 30 µL of protein sample or protein standard solution. Separation was carried out by application of 80 V for 15 min and 200 V for 40 min. After separation, proteins were fixed with 50 mL of 40 % (v/v) MeOH and 10 % (v/v) AA by shaking for 30 min and stained with 50 mL of Bio-Safe Coomasie Blue by shaking for 1 h. Finally, gels were rinsed with Milli-Q water for 2 h or overnight. Gels were scanned in a home scanner Hewlett Packard PSC 1510 (Palo Alto, CA, USA). 2.4. RP-HPLC separation of proteins A. liquid. chromatography. equipment. 1100. series. from. Agilent. Technologies. (Pittsburgh, PA, USA) was employed. It was equipped with a vacuum degasser system, a quaternary pump, an automatic injection system, a column thermostatic compartment, a diode array detector, and a fluorescence detector. Data acquisition was performed by the HP-Chemstation software. ARP perfusion POROS R2/10 (100 x 2.1 mm) column from Perseptive Biosystems (Framingham, MA, USA) was employed. The mobile phases consisted of 0.1 % (v/v) TFA in water (mobile phase A) and 0.1 % (v/v) TFA in ACN (mobile phase B). The elution gradient was 30-45 % B in 20 min, the flow rate was 0.5 mL/min, the column temperature was 60 °C, and the injection volume was 20 µL. UV detection at 210, 254, and 280 nm and florescence detection at excitation and emission wavelengths of 280 and 360 nm, respectively, were employed. 2.5. Protein digestion Four different enzymes were used: Alcalase, Thermolysin, Flavourzyme, and Protease P. Isolated peach seed proteins were dissolved in the corresponding digestion buffer.
(9) (phosphate buffer (PB) at pH 8 for Alcalase and Thermolysin, PB at pH 7.5 for Protease P, and ammonium bicarbonate buffer (ABB) at pH 6.5 for Flavourzyme) and after addition of the enzyme, they were incubated in a Thermomixer Compact (Eppendorf, Hamburg, German) at 50 ºC (for Alcalase, Flavourzyme, and Thermolysin) or 40 ºC (for Protease P) with shaking at 600 rpm. The digestion was stopped by increasing the temperature to 100 °C for 10 min. After centrifugation (4500 g for 5 min), the supernatant was collected and the degree of hydrolysis (% DH) and ACE-inhibitory capacity were evaluated. Enzyme autolysis blanks in absence of sample were also measured. Fractionation of peptides by ultrafiltration was carried out by using molecular weight cut-off (MWCO) filters Amicon® Ultra of 5 kDa and 3 kDa from Merck Millipore (Tullagreen, Ireland). 2.6. Determination of the degree of hydrolysis (DH) The DH was evaluated according to the method described by Wang et al. (2008) with some modifications. A 40 mg/mL solution of OPA reagent in MeOH was employed to prepare a fresh 5 mL mixture consisting of 2.5 mL of 100 mM sodium tetraborate, 1mL of 5 % (v/v) SDS, 1.39 mL of water, 10 µL of 2-ME, and 100 µL of previous OPA solution. Next, 2.5 µL of sample was incubated with 100 µL of that mixture for 8 min at room temperature and the absorbance corresponding to the compounds formed by the reaction of OPA reagent with α-amino groups of peptides was measured at 340 nm using a spectrophotometer Lambda 35 from Perkin-Elmer (Walthman, MA, USA). The peptide content was calculated by interpolation in a calibration curve obtained when using the tripeptide GSH (0-5 mg/mL) as standard. The DH (%) was estimated following the equation below, where the protein content was obtained by Bradford assay:.
(10) 2.7. In vitro evaluation of ACE-inhibitory capacity The ACE-inhibitory capacity was evaluated following the method described by Geng, He, Yang, and Wang (2010) with some modifications. The IC 50 value (peptide concentration needed for the inhibition of 50 % ACE activity) was employed in order to express the in vitro effectiveness of ACE-inhibitory peptides. The method was based on the conversion of the tripeptide HHL into hippuric acid (HA), catalyzed by ACE. The capability of peptides to inhibit ACE was monitored by measuring the signal corresponding to HA. The ACE-inhibition assay was carried out by mixing 10 µL of ACE solution (0.05 U/mL) with 5 µL of 1.3 mg/mL of HHL (diluted in 50 mM HEPES (pH 8.3) with 300 mM NaCl), 17.5 µL of 50 mM HEPES, and 2.5 µL of sample. After 3 h incubation at 37 °C, the reaction was stopped by the addition of 50 µL of cold ACN. The samples were next separated by HPLC using a RP column C-18 Chromolith® Performance, 100 x 4.6 mm form Merck (Darmstat, Germany). Chromatographic conditions were: mobile phases, 0.025 % (v/v) TFA in water (mobile phase A) and 0.025 % (v/v) TFA in ACN (mobile phase B); gradient, 5-95 % B in 10 min; flow rate, 1 mL/min; temperature, 25 °C; and injection volume, 10 µL; detection at 228 nm. ACE inhibition (%) was determined using the following equation:.
(11) where. is the peak area of HA in absence of ACE inhibition and. is the. peak area of HA with sample. In order to evaluate the IC 50 value, six dilutions of every sample were measured and ACE inhibition (%) values were plotted vs peptide concentration. IC50 value was determined by interpolation at the 50% of ACE inhibition in that graph. In all cases, IC 50 was evaluated using two independent sample solutions that were measured, at least, two times. 2.8. Resistance to simulated gastrointestinal digestion and ACE The in vitro gastrointestinal digestion (GID) was carried out according to the method of Garrett, Failla, & Sarama (1999) with slight modifications. Briefly, the pH of hydrolyzates was adjusted with 1 M HCl to pH 2 followed by digestion with pepsin enzyme (1:35, enzyme: substrate ratio) at 37 °C with shaking for 1 h. Afterwards, the pH was adjusted to pH 5 with 0.1 M NaHCO 3 and to pH 7-8 with 0.1 M NaOH and pancreatin enzyme (mixture of pancreatic proteases) was added at a 1:25 (w/w) enzyme to substrate ratio. The mixture was incubated by shaking at 37 °C and after 3 h digestion, the digestion was stopped by heating at 95 °C for 15 min. The resistance of peptides to ACE was evaluated using the method reported by Fujita, Yokoyama, and Yoshikawa (2000) with some modifications. A peptide solution of 2 mg/mL in 0.1 M PB (pH 8.3) containing 0.3 M NaCl was incubated with ACE (3 mU enzyme/mg peptide) for 3 h at 37 °C. The reaction was stopped by heating at 95 °C for 15 min..
(12) 2.9. Identification of ACE-inhibitory peptides by HILIC- and RP-HPLC-ESI-Q-ToF A Quadrupole-Time-of-Flight (Q-TOF) mass spectrometer (Series 6530) coupled to a liquid chromatograph (model 1100), both from Agilent Technologies was employed. For the RP-HPLC separation of peptides, an Ascentis Express Peptide ES-C18 column (100 mm x 2.1 mm I.D., 2.7 µm particle size) with its corresponding guard column (5 mm x 2.1 mm, 2.7 µm particle size) from Supelco (Bellefonte, PA, USA) were used. For the HILIC separation of peptides, an Ascentis Express column (100 mm x 2.1 mm I.D., 2.7 µm particle size) with its corresponding guard column (5 mm x 2.1 mm, 2.7 µm particle size), also from Supelco, were employed. Chromatographic conditions for the RP-HPLC separation were: mobile phases, 0.3% (v/v) AA in water (mobile phase A) and 0.3 % (v/v) AA in ACN (mobile phase B); gradient, 3-35 % B in 30 min. Chromatographic conditions for the HILIC separation were: 65 mM ammonium acetate in ACN (mobile phase A) and 65 mM ammonium acetate in water (mobile phase B); gradient, 60-95 % B in 30 min. Other common chromatographic conditions. were: flow rate,. 0.3 mL/min; column. temperature, 25 °C; injection volume, 10 µL. Mass spectrometry (MS) detection was carried out in the positive ion mode using a scanning range from 100 to 1500 m/z. ESI Jet Stream source conditions were: sheath gas temperature, 400 °C; sheath gas flow, 12 L/min; drying gas flow, 12 L/min; drying gas temperature, 350 °C; nebulizer pressure, 50 psig; fragmentator voltage, 200 V; capillary voltage, 500 V. Tandem MS was performed using the Auto (MS/MS) mode and collision induced dissociation was set at 4 V per each 100 Da. De novo sequencing of peptides was carried out with PEAKS Studio 7 software from Bioinformatic Solutions Inc. (Waterloo, ON, Canada). Identified peptides showed an average local confidence (ALC, expected.
(13) percentage of correct amino acids in the peptide sequence) equal or superior to 90% and a good. precursor. fragmentation pattern.. Identifications were carried. out using two. independent samples injected by duplicate. Since it is not possible to differentiate I from L by MS due to their equal molecular masses, only isoforms with L were presented in our results, although peptide sequences containing I amino acid instead of L are also possible. 2.9 Statistical analysis All data were presented by means and ± standard deviation (SD). So, in order to find statistically significant differences among the highest ACE-inhibitory extracts before and after gastrointestinal digestion, the comparison of two means was performed by Student’s ttest to two replicates measured by duplicate at least. For that purpose, the statistical analysis was performed using Statgraphics Software Plus 5.1 (Statpoint Technologies, Inc., Warrenton, VA). 3. Results and discussion 3.1. Extraction of proteins from peach seeds Since there is no method enabling the extraction of proteins from peach seeds, a method previously reported by our research group and used to extract proteins from olive seeds was firstly tried (Esteve, Del Río, Marina & García, 2010). Briefly, the method involved an extraction with 125 mM of Tris-HCl buffer (pH 7.5) containing 1 % (w/v) SDS and 0.5 % (w/v) DTT using HIFU for 5 min at 30 % of amplitude and followed by cold acetone precipitation of proteins for 1 h. Under these conditions, it was possible to extract 16.8 g ± 2.3 g of proteins per 100 g of raw seeds. Moreover, extracted proteins were separated by.
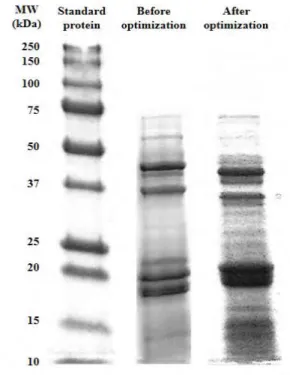
(14) SDS-PAGE (see Figure 1) and RP-HPLC (see Figure 2A) observing 6 main bands by SDSPAGE and more than 11 chromatographic peaks pertaining to proteins. In order to assure that all peach seed proteins have been extracted, different extraction parameters were next optimized (extracting buffer composition, HIFU probe time and amplitude, and protein precipitation time). Moreover, in order to avoid an upper lipidic layer appearing in the extracts and interfering in the extraction of proteins, a previous lipid extraction step was proposed. The extraction of peach seeds with hexane for 30 min (three times) enabled the removal of this lipidic layer and to obtain a clearer extract.. Figure 1. Electrophoretic separation of peach seed proteins under initial (125 mM Tris-HCl (pH 7.5) with 1 % (w/v) SDS and 0.5 % (w/v) DTT as extracting buffer using HIFU for 5 min at 30 % of amplitude and protein precipitation with cold acetone for 1 h) and optimal (100 mM Tris-HCl (pH 7.5) with 0.5 % (w/v) SDS and 0.5 % (w/v) DTT) as extracting buffer using HIFU for 1 min at 30 % of amplitude and protein precipitation with cold acetone for 15 min) extracting conditions..
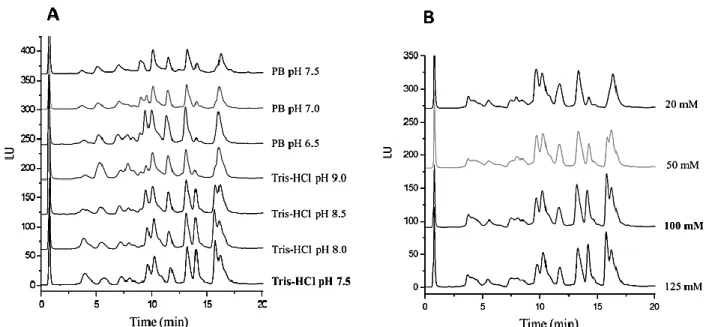
(15) Figure 2. RP-HPLC separation of peach seed proteins using different extraction buffers (A) and different concentrations of Tris-HCl buffer (B). Chromatographic conditions: Perfusion column (100 x 2.1 mm); gradient: 30-45% B in 20 min; mobile phases: water + 0.1 % (v/v) TFA (mobile phase A) and AcN + 0.1 % (v/v) TFA (mobile phase B); flow-rate, 0.5 mL/min; temperature, 60 ºC; injected volume, 20 μL; fluorescence detection at a λEXC of 280 nm and λEM of 360 nm.. Different extraction buffers (125 mM of Tris-HCl buffer at pHs 7.5, 8.0, 8.5, 9.0 and 125 mM of PB at pHs 6.5, 7.0, and 7.5) were tried. Figure 2A shows how the type of buffer and pH affected the number and resolution of chromatographic peaks. Moreover, the total peak area was also calculated observing that the Tris-HCl buffer (pH 7.5) seemed to be the best option for the extraction of peach seed proteins. Furthermore, different Tris-HCl buffer (pH 7.5) concentrations (20, 50, 100, and 125 mM) were also tried (see Figure 2B) observing a higher number of peaks and a higher protein extraction at buffer concentrations from 100 mM. Additionally, SDS and DTT at different concentrations (0.0, 0.5, 1.0, 1.5, and 2.0 % (w/v) for SDS and 0.0, 0.25, 0.5, and 1.0 % (w/v) for DTT) were also tested. Both reagents favor protein denaturation by disrupting interactions within proteins, between proteins, and between metabolites and proteins (Wu, Gong, & Wang, 2014). As expected,.
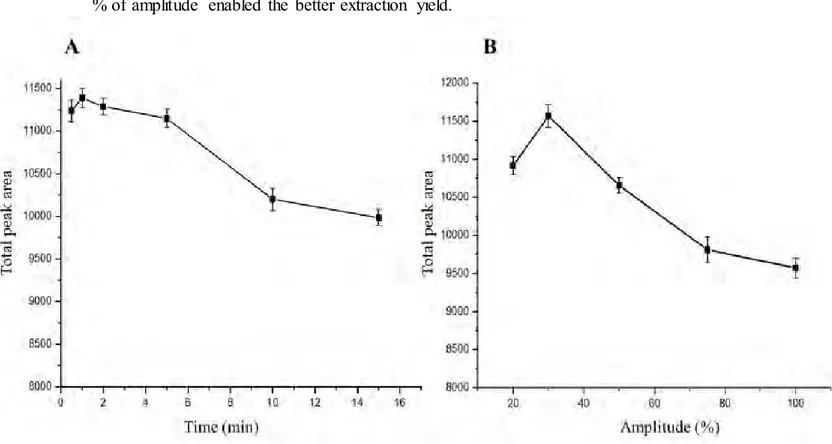
(16) the presence of both reagents improved protein extraction although no significant variation in the number of peaks and total peak area was observed when varying their concentration. The selected concentrations were 0.5 % (w/v) of DTT and 0.5 % (w/v) of SDS that also enabled to avoid Bradford assay interferences. The influence of the extraction time with the HIFU probe was studied in the range from 0.5 to 15 min observing (see Figure 3A) an increase in total peak in the first minute. Moreover, different probe amplitudes were also tested (see Figure 3B) observing that a 30 % of amplitude enabled the better extraction yield.. Figure 3. Variation of total area of peaks obtained by RP-HPLC with the extraction time (A) and with the HIFU probe extraction amplitude (B). Chromatographic conditions as in Figure 2.. Some protein extraction protocols include a boiling step for a further protein denaturation that favors the extraction of most hydrophobic proteins (Wu et al., 2014)..
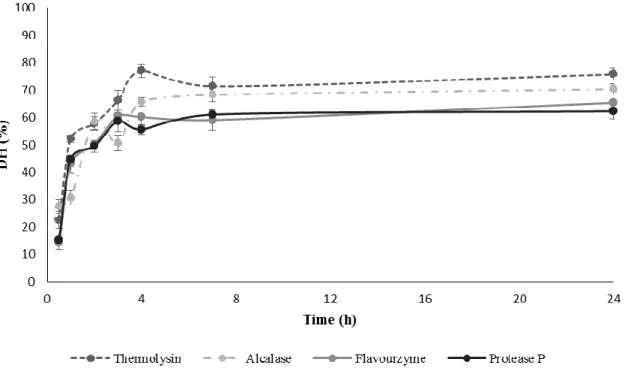
(17) However, no improvement was observed in the protein extraction from peach seeds when this step was included. Finally, extracted proteins were precipitated with cold acetone at different times (0.25, 0.5, 1, 2, and 24 h) observing that a precipitation time of 15 min was enough for that purpose. Under these optimized extraction conditions, it was possible to extract 43.0 ± 3.3 g of protein per 100 g of dried and defatted milled seeds which constitutes an increase of 27 % in extracted proteins in relation to initial conditions. This protein content is similar to the obtained with plum (38.6 ± 2.7) and cherry (39.2 ± 5.8) seeds (González-García, García, & Marina, 2014; García, Endermann, González-García, & Marina, 2015).. Figure 4 also. shows the electrophoretic separation of proteins extracted under optimized conditions observing a higher amount of bands than with initial extraction conditions. In all cases, bands appeared at molecular weights (MW) below 75 kDa.. Figure 4. DH variation (%) obtained in the digestion of peach seed proteins with Thermolysin, Alcalase, Flavourzyme, and Protease P vs digestion time..
(18) 3.2. Enzymatic digestion of proteins In order to obtain peptides from the peach seed protein isolate previously extracted, four different enzymes were tried: Alcalase, Thermolysin, Flavourzyme, and Protease P. Enzyme selection was based on previous results obtained in literature (García et al., 2013). Since this is the first time that peach seed proteins are digested, a previous optimization of some parameters was carried out in order to obtain the highest hydrolysis degree. Studied parameters. were:. substrate. concentration,. digestion. buffer,. digestion. time,. and. enzyme/substrate (E/S) ratio. Digestion temperature was that showing the maximum enzyme activity according to the literature: 50 °C for Alcalase, Thermolysin, and Flavourzyme, and 40 °C for Protease P (Esteve, Marina, & García, 2015; Ambigaipalan, Al-Khalifa, & Shahidi, 2015; Zhu et al., 2010; González-García et al., 2014; García et al., 2013). Four different substrate concentrations were employed: 2.5, 5.0, 7.5, and 10 mg/mL. Based on the % DH values, optimal substrate concentrations were: 5 mg/mL for Alcalase, Thermolysin, and Flavourzyme and 7.5 mg/mL for Protease P. Moreover, different digestion buffers and pHs were tried for every enzyme: 5 mM PB (pHs 7.0, 7.5, and 8.0) and 5 mM borate buffer (pHs 8.5 and 9.0) were employed with Alcalase and Thermolysin while 5 mM ABB (pHs 5.5, 6.0, and 6.5) and 5 mM PB (pHs 7.5 and 8.0) were employed with Protease P. Buffer pHs were selected taking into account optimal pH ranges of every enzyme. The highest DH when using Alcalase and Thermolysin was observed with PB at pH 8.0, whereas a PB at pH 7.5 and an ABB at pH 6.5 were optimal for Protease P and Flavourzyme, respectively. Furthermore, E/S ratios from 0.1 to 0.7 AU/g protein were tried for Alcalase observing the highest DH at 0.1 AU/g protein. In the case of Thermolysin, E/S.
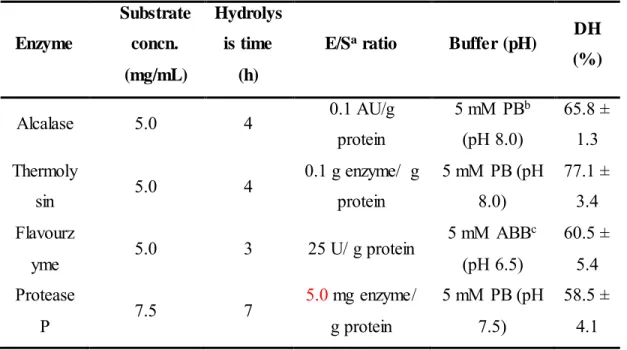
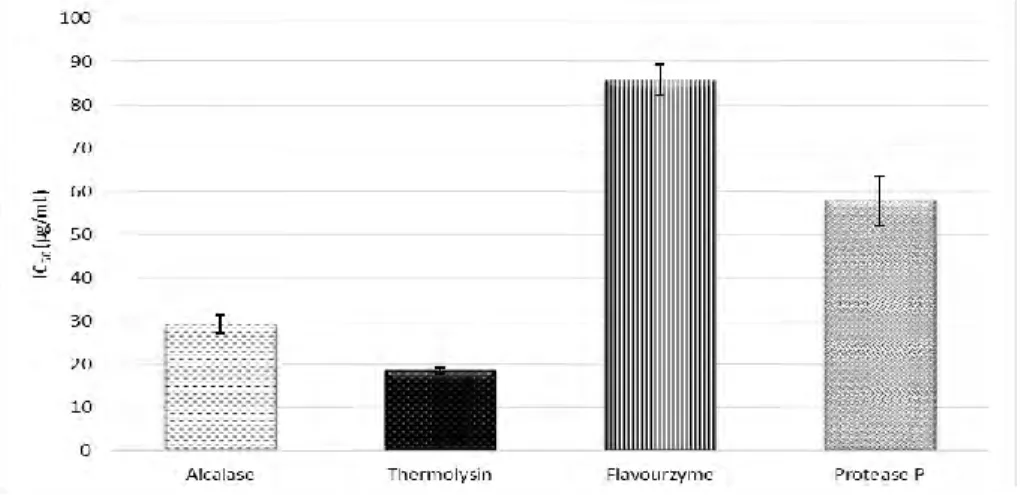
(19) ratios from 0.03 to 0.4 g enzyme/g protein were tried choosing 0.1 g enzyme/g protein as optimum. In the case of Protease P, E/S ratios from 0.3 to 5.0 mg enzyme/g protein were tried being 5.0 mg enzyme/g protein the ratio yielding the highest DH. No significant variation in the DH was observed when varying the E/S ratio from 25 to 100 AU/g protein in the case of Flavourzyme. In addition, different digestion times within 30 min to 24 h were studied (see Figure 4). Two different phases were observed in all cases: an initial phase taking 3-4 h in which there was a significant increase in the DH and a second phase in which the DH was kept. Selected digestion times have been included in Table 1 along with other optimized digestion parameters and the DH obtained when using these digestion conditions. DH of samples ranged from 58 to 77%. Under these digestion conditions, blank digestions in absence of protein sample were carried out to check enzyme autodigestion. Results demonstrated that under the optimized digestion conditions there was no autolysis and that all observed peptides came from the peach seed proteins. The DH reached by hydrolysates depends on the enzyme ability to hydrolyze specific peptide bonds within the protein chain. Since all employed enzymes presented low specificity, high DH were obtained. These DH were similar to the previously observed for olive (Esteve et al., 2015) and plum (González-García et al., 2014) seeds using the same enzymes and slightly higher than those observed for the cherry seeds (García et al., 2015). 3.3. Evaluation of ACE-inhibitory capacity Peptide extracts obtained by digestion with Alcalase, Thermolysin, Flavourzyme, and Protease P were submitted to an in vitro ACE-inhibitory assay in order to evaluate their potential antihypertensive capacity. Figure 5 shows the IC 50 values obtained under optimal conditions with the four enzymes. Thermolysin was the enzyme yielding the highest HD.
(20) Table 1. Optimal conditions for the digestion of peach seed proteins with different enzymes and resulting degrees of hydrolysis (DH). Substrate. Hydrolys. concn.. is time. (mg/mL). (h). Enzyme. Alcalase Thermoly sin Flavourz yme Protease P a. 5.0. 4. 5.0. 4. 5.0. 3. 7.5. 7. DH. E/Sa ratio. Buffer (pH). 0.1 AU/g. 5 mM PBb. 65.8 ±. protein. (pH 8.0). 1.3. 0.1 g enzyme/ g. 5 mM PB (pH. 77.1 ±. protein. 8.0). 3.4. 5 mM ABBc. 60.5 ±. (pH 6.5). 5.4. 5.0 mg enzyme/. 5 mM PB (pH. 58.5 ±. g protein. 7.5). 4.1. 25 U/ g protein. (%). Enzyme/substrate. b Phosphate. buffer. c Ammonium. bicarbonate buffer. and also the highest ACE-inhibition capacity (IC50 = 18.6 ± 0.7 µg/mL) followed by Alcalase and Protesase P. Flavourzyme was the enzyme that yielded the extract with the lowest potential despite it showed a DH higher than Protease P. Thermolysin along with Alcalase cleave peptide bonds close to hydrophobic amino acid residues that are very favorable for ACE-inhibition activity at C-terminal position (Puchalska et al., 2015). On the other hand, Thermolysin was also the enzyme yielding the hydrolysates with the highest ACE-inhibition capacity in olive (Esteve et al., 2015), plum (González-García et al., 2014), and cherry (García et al., 2015) seeds..
(21) Figure 5. Comparison of the in vitro ACE-inhibitory capacity of peptide extracts obtained in the digestion of peach seed proteins with Thermolysin, Alcalase, Flavourzyme and Protease P.. The. digested. extract. obtained. when. using. Thermolysin. was. fractionated. by. ultrafiltration obtaining fractions above 5 kDa, from 3 to 5 kDa, and below 3 kDa. Fraction above 5 kDa and between 5 and 3 kDa could not reach a 50% ACE inhibition while fraction below 3 kDa yielded an IC50 value of 16.4 ± 1.4 µg/mL.. Thus, potential. antihypertensive peptides in the extract obtained with Thermolysin seemed to be concentrated in the fraction containing the shortest peptides. This behavior was expected since ACE inhibiting peptides show short amino acid sequences (with 2-12 amino acid residues) (Puchalska et al., 2015). Comparing with other fruit byproducts, peach seed peptides showed a higher ACE-inhibitory capacity than the observed for the fraction < 1 kDa from the hydrolysis of apricot seed proteins with Alcalase (Zhu, Qiu, & Yu, 2010) or the observed for fractions < 3 kDa from the hydrolysis of olive seed proteins or cherry proteins with Thermolysin (Esteve et al., 2015; García et al., 2015). 3.4. Evaluation of the resistance of potential antihypertensive peptides to simulated gastrointestinal digestion and ACE The in vivo activity of a bioactive peptide greatly depends on its capacity to reach target organs in an intact conformation. Gastrointestinal digestion (GID) is one of the processes.
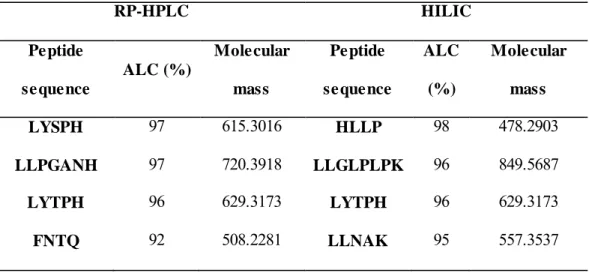
(22) that peptides have to resist to show their bioactivity. In order to evaluate the resistance of peptides in fraction below 3 kDa to GID, they were submitted to an in vitro digestion with pepsin (simulating stomach digestion) and pancreatin (simulating small intestine digestion) using conditions simulating in vivo ones. As expected, peptide concentration in the extract increased a 10% as a consequence of GID (initial peptide conc. = 2.24 ± 0.32 mg/mL; peptide conc. after GID = 2.47 ± 0.23 mg/mL). Nevertheless, there was not observed any significance difference in ACE-inhibitory capacity when comparing IC 50 value before and after GID (test-t, p > 0.05): IC50 before GID = 16.4 ± 1.4 µg/mL; IC 50 after GID = 17.1 ± 1.4 µg/mL. Furthermore, in order to establish whether peptides present in fraction below 3 kDa were true ACE-inhibitors, it was also studied the resistance of peptides to ACE. Comparison of ACE-inhibitory capacity and concentration of peptides before and after their incubation with ACE enabled to observe that there were no statistically significant differences (test-t, p > 0.05): IC 50 before ACE incubation = 17.1 ± 1.4 µg/mL; IC 50 after ACE incubation = 17.6 ± 1.7 µg/mL.. 3.5. De novo identification of peptides by HPLC-MS/MS Peptides present in the fraction below 3 kDa obtained from the Thermolysin hydrolysate were next de novo sequenced using an HPLC-ESI-Q-ToF system and PEAKS software. Taking into account the short size of peptides and in order to assure a comprehensive peptide sequencing, both RP-HPLC and HILIC chromatographic modes were employed. Table 2 groups peptides sequence identified in this fraction before.
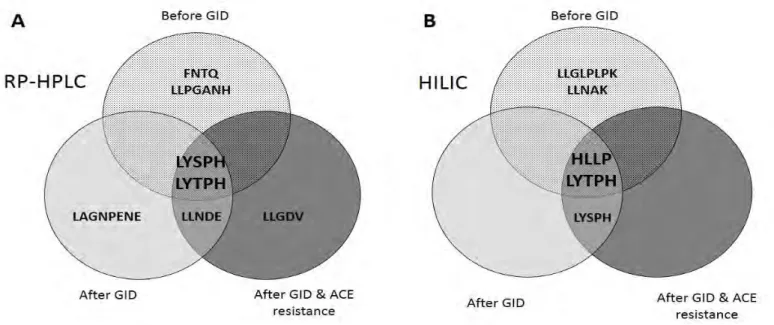
(23) simulated GID along with their experimental molecular masses, ALC, and accuracy. Four peptides with a number of amino acids ranging from 4 to 8 were identified by both modes observing one common peptide (LYTPH). Table 2. Peptide sequence, ALC, and molecular mass of the peptides identified in the fraction below 3 kDa before simulated GID. RP-HPLC Peptide. HILIC Molecular. Peptide. ALC. Molecular. mass. sequence. (%). mass. ALC (%) sequence LYSPH. 97. 615.3016. HLLP. 98. 478.2903. LLPGANH. 97. 720.3918. LLGLPLPK. 96. 849.5687. LYTPH. 96. 629.3173. LYTPH. 96. 629.3173. FNTQ. 92. 508.2281. LLNAK. 95. 557.3537. Moreover, Venn Diagrams in Figure 6 compare peptides identified using RP-HPLC (Figure 6A) and HILIC (Figure 6B) modes before GID, after GID, and after GID and ACE hydrolysis. The peptides sequences that resisted both GID and ACE were LYSPH, LYTPH, and HLLP. These peptides had been previously observed in cherry seed hydrolysates (García et al., 2015). Rest of peptides in Table 2 were not observed after GID or ACE hydrolysis. Peptide LANGPENE and LLNDE were identified after GID but they were not observed before. These peptides were detected in the cherry seed hydrolysate (before GID) (García et al., 2015) and they probably were also in the initial hydrolysate (before GID) of the peach seed but they could not be probably identified because they were not properly ionized under conditions employed. Nevertheless, these peptides could not resist ACE digestion..
(24) Figure 6. Venn diagrams comparing identified peptides by ESI-Q-TOF using RP-HPLC separation (A) and HILIC separation (B), before simulated GID, after GID, and after both GID and ACE incubation.. Peptides LYSPH, LYTPH, and HLLP showed common features of antihypertensive peptides (Vermeirssen, Van Camp, & Verstraete, 2004). Indeed, they showed short sequences and hydrophobic amino acid residues such as P and L/I and/or aromatic residues such as H and Y (Cheung, Wang, Ondetti, Sabo, & Chusman, 1980; Vermeirssen, Van Camp, & Verstraete, 2004; Alemán, Giménez, Pérez-Santin, Gómez-Gillén, & Montero, 2011). Further investigations are needed to demonstrate that these peptides showing in vitro ACE-inhibitory capacity and resisting both GID and ACE hydrolysis can effectively reduce in vivo hypertension..
(25) 4. Conclusions A new strategy for the revalorization of a peach byproduct based on the extraction of peptides with ACE-inhibitory capacity has been developed. Proteins from defatted peach seeds were extracted using a Tris-HCl buffer (pH 7.5) and a high intensity focused ultrasounds for 5 min. A protein isolate with a protein content higher than 95% (as dry basis and defatted) was obtained. Extracted proteins were digested with different enzymes showing the highest ACE-inhibitory capacity the hydrolysate obtained with Thermolysin. ACE-inhibitory peptides were concentrated in the fraction < 3 kDa which showed an IC 50 value of 16.4 ± 1.42 mg/mL. The combined use of RP-HPLC and HILIC chromatographic modes coupled to high resolution ESI-Q-ToF enabled the identification of three peptides (LYSPH, LYTPH, and HLLP) that resisted gastrointestinal enzymes and ACE in this peptide fraction. These peptides showed typical features of antihypertensive peptides and can be considered interesting candidates to reduce in vivo hypertension. Further investigations to demonstrate in vivo effect of these peptides are needed. Acknowledgments This work was supported by the Ministry of Economy and Competitiveness (ref. AGL2012-36362), the University of Alcalá (ref. CCG2013/EXP-028), and the Comunidad Autónoma de Madrid and European funding from FEDER program (S2013/ABI-3028, AVANSECAL)..
(26) References Alemán, A., Giménez, B., Pérez-Santin, E., Gómez-Guillén, M.C., & Montero, P. (2011). Contribution of Leu and Hyp residues to antioxidant and ACE-inhibitory of peptide sequences isolated from squid gelatin hydrolysate. Food Chemistry, 125, 334-341. Ambigaipalan, P., Al-Khalifa, A. S., & Shahidi, F. (2015). Antioxidant and angiotensin I converting enzyme (ACE) inhibitory activities of date seed protein hydrolysates prepared using Alcalase, Flavourzyme and Thermolysin. Journal of Functional Foods, (in press). Arvanitoyannis, I. S., & Varzakas, T. H. (2008). Vegetable waste treatment: Comparison and critical presentation of methodologies. Critical Reviews in Food Science and Nutrition, 48, 205-247. Bezalel, S., Mahlab-Guri, K., Asher, I., Werner, B., & Sthoeger Z. M. (2015). Angiotensinconverting enzyme inhibitor-induced angioedema. The American Journal of Medicine, 128, 120-125. Bradford, M. M. (1976). A rapid and sensitive method for the quantitation of microgram quantities of protein utilizing the principle of protein-dye binding. Analytical Biochemistry, 72, 248-254. Cheung, H., Wang. F., Ondetti, M.A., Sabo, E.F., & Chusman, D.W., (1980). Binding of peptide substrates and inhibitors of angiotensin-converting enzyme. The Journal of Biological Chemistry, 255, 401-407..
(27) Esteve, C., Del Río C., Marina M.L., & García M.C., (2010). First ultraperformance liquid chromatography. based. strategy. for. profiling. intact proteins in complex matrices:. Application to the evaluation of the performance of olive (Olea Europaea L.) stone proteins for cultivar fingerprinting. Journal of Agricultural and Food Chemistry, 58, 8176-8182. Esteve, C., Marina, M. L., & García, M. C. (2015). Novel strategy for the revalorization of olive (Olea europaea) residues based on extraction of bioactive peptides. Food Chemistry, 167, 272-280. Fujita, H., Yokoyama, K., & Yoshikawa, M. (2000). Classification and antihypertensive activity of angiotensin I-converting enzyme inhibitory peptides derived from food proteins. Journal of Food Science, 6, 564-569. García, M. C., Endermann J., González-García, E., & Marina, M.L. (2015). HPLC-Q-TOFMS identification of antioxidant and antihypertensive peptides recovered from cherry (Prunus cerasus L.) subproducts. Journal of Agricultural and Food chemistry, 63, 15141520. González-García, E., García, M. C., & Marina, M. L. (2014). Plum (Punus Domestica L.) by-products as a new and cheap source of bioactive peptides: Extraction method and peptides characterization. Journal of Functional Foods, 11, 428-437. García, M. C., Orellana, J. M., & Marina, M. L. (2015). Novel applications of protein extracts from food byproducts in biomedicine, in: Waste-derived proteins: Transformation from environmental burden into value-added products, Elsevier Publishers, GS Dhillon, (Ed.), in press..
(28) García, M. C., Puchalska, P., Esteve, C., & Marina, M. L. (2013). Vegetable foods: a cheap source of proteins and peptides with antihypertensive, antioxidant, and other less occurrence bioactivities. Talanta, 106, 328-349. Garrett, D. A., Failla, M. L., & Sarama, R. J. (1999). Development of an in vitro digestion method to assess carotenoid bioavailability from meals. Journal of Agricultural and Food Chemistry, 47, 4301-4309. Geng, F., He, Y., Yang, L., & Wang, Z. (2010). A rapid assay for angiotensin-converting enzyme. activity. using. ultra-performance. liquid. chromatography-mass. spectrometry.. Biomedical Chromatography, 24, 312-317. Hartmann, R., & Meisel, H. (2007). Food-derived peptides with biological activity: From research to food applications. Current Opinion in Biotechnology, 18, 163-169. Kitts, D. D., & Weiler, K. (2003). Bioactive proteins and peptides from food sources. Applications of bioprocesses used in isolation and recovery. Current Pharmaceutical Design, 9, 1309-1323. Korhonen, H., & Pihlanto, A. (2006). Bioactive peptides: Production and functionality. International Dairy Journal, 16, 945-960. Lima, B.N.B., Lima, F.F., Tavares, M.I.B., Costa, A.M.M., & Pierucci A.P.T.R. (2014). Determination of the centesimal composition and characterization of flours from fruit seeds. Food Chemistry, 151, 293-299..
(29) Piotrowska, P., Zevenhoven, M., Hupa, M., Giuntoli, J., & de Jong, W. (2013). Residues from the production of biofuels for transportation: Characterization and ash sintering tendency. Fuel Processing Technology, 105, 37-45. Pelentir, N., Block, J.M., Monteiro Fritz, A.R., Regginatto, V., & Amante, E.R. (2011). Production and chemical characterization of peach (Prunus Persica) kernel flour. Journal of Food Process Engineering, 34, 1253-1265. Puchalska, P., Marina, M. L., & García, M. C. (2015). Isolation and characterization of peptides with antihypertensive activity in foodstuffs. Critical Reviews in Food Science and Nutrition, 55, 521-551. Restrepo Gallego, M. (2006). Producción más limpia en la industria alimentaria. Producción + Limpia, 1, 87-101. Shahidi, F., & Zhong, Y. (2008). Bioactive peptides. Journal of AOAC International, 91, 914-931. Struthers, A. D., & McDonald, T. M. (2004). Review of aldosterone- and angiotensin IIinduced target organ damage and prevention. Cardiovascular Research, 61, 663-670. Vermeirssen, V., Van Camp, J., & Verstraete, W. (2004). Bioavailability of angiotensin I converting enzyme inhibitory peptides. The British Journal of Nutrition, 92, 357-366. Wang, D., Wang, L., Zhu, F., Zhu, J., Chen, X. D., Zou, L., Li, L. (2008). In vitro and in vivo studies on the antioxidant activities of the aqueous extracts of douchi (a traditional chinese salt-fermented soybean food). Food Chemistry, 107, 1421-1428..
(30) World Health Organization, A global brief on hypertension; Silent killer, global public health crisis, WHO/DCO/WHD/2013.2 (2013). Wu, X., Gong, F., & Wang, W. (2014). Protein extraction from plant tissues for 2DE and its application in proteomic analysis. Proteomics, 14, 6445-658. Zhu, Z., Qiu, N., & Yi, J. (2010). Production and characterization of angiotensin converting enzyme (ACE) inhibitory peptides from apricot (Prunus Americana L.) kernel protein hydrolysate. European Food Research and Technology, 231, 13-19..
(31)
Figure
+5
Documento similar
