Media bias and central bank response.
Evidence from the nominal exchange rate behavior in
Colombia
Rodrigo Taborda∗ †
Abstract
Since 1991 Colombia has had a market-determined Peso - US Dollar Nominal Exchange Rate (NER), after more than 20 years of controlled and multiple exchange rates. The behavior (revaluation / devaluation) of theNERis constantly reported in news, editorials and op-eds of major newspapers of the nation with particular atten-tion to revaluaatten-tion. The uneven reporting of revaluaatten-tion episodes can be explained by the existence of an interest group particulary affected by revaluation, looking to increase awareness and sympathy for help from public institutions. Using the num-ber of news and op-eds from a major Colombian newspaper, it is shown that there is an over-reporting of revaluation episodes in contrast to devaluation ones. Secondly, using text analysis upon the content of the news, it is also shown that the words de-valuation and rede-valuation are far apart in the distribution of words within the news; and revaluation is highly correlated with words related to: public institutions, ex-porters and the need of assistance. Finally it is also shown that the probability of the central bank buying US dollars to lessen revaluation effects increases with the num-ber of news; even though the central bank allegedly intervenes in the exchange rate market only to tame volatility or accumulate international reserves.
JEL codes:A19, C25, E58.
Key words: News bias, Central banking, Colombia, Nominal Exchange Rate (NER), Negative Binomial Regression Model (NBRM), probit model.
∗Universidad del Rosario. Departamento de Econom´ıa. Calle 14 # 4 - 69. Bogot´a, Colombia.
E-mail:[email protected].
†Many thanks to Jes ´us Otero, Gonzalo Varela, Juan Bar ´on, Constanza Mart´ınez and
Media bias and central bank response.
Evidence from the nominal exchange rate behavior in
Colombia
Abstract
Since 1991 Colombia has had a market-determined Peso - US DollarNER, after
more than 20 years of controlled and multiple exchange rates. The behavior (reval-uation / deval(reval-uation) of theNERis constantly reported in news, editorials and op-eds of major newspapers of the nation with particular attention to revaluation. The uneven reporting of revaluation episodes can be explained by the existence of an in-terest group particulary affected by revaluation, looking to increase awareness and sympathy for help from public institutions. Using the number of news and op-eds from a major Colombian newspaper, it is shown that there is an over-reporting of revaluation episodes in contrast to devaluation ones. Secondly, using text analysis upon the content of the news, it is also shown that the words devaluation and reval-uation are far apart in the distribution of words within the news; and revalreval-uation is highly correlated with words related to: public institutions, exporters and the need of assistance. Finally it is also shown that the probability of the central bank buy-ing US dollars to lessen revaluation effects increases with the number of news; even though the central bank allegedly intervenes in the exchange rate market only to tame volatility or accumulate international reserves.
JEL codes:A19, C25, E58.
1 Introduction
The behavior of the Nominal Exchange Rate (NER) is constantly reported in Colombian newspapers and commented in editorials and op-eds. However, the number and fla-vor of news and commentary seems to increase disproportionately during revaluation in contrast to a devaluation of theNER.1 During the course of a revaluation it is common to read in the press claims, not facts, of firms and entire industries in distress due to reval-uation and the benefits of outdated policies such as: fixed and multiple exchange rates —as it happened since 1967 with the enactment of the Law 444 (Congreso de Colombia,
1967)—, if not a dollarization of the economy.2
On one hand, news and op-eds maintain the idea that revaluation is devastating for the macroeconomic performance of the country, due to the reduced income for exporters and the subsequent effects on employment and wages of workers in related industries. On the other hand, when devaluation occurs few news, editorials and op-eds are pub-lished. There are no complaints addressing plausible effects of a devaluation, such as high prices of foreign capital (machinery and equipment) or imported raw materials. Furthermore, there is seldom reference regarding the associated risks on local inflation.
This asymmetry in the number of news, editorials and op-eds is hard to understand. Why would it be more important to report and discuss revaluation instead of devalua-tion? Why are there claims of benefits of a fixed exchange rate when the country already went through the crippling effects of an exchange rate black market premium? As de-picted by Easterly(2002, p. 222) “[a high black market premium] is a punitive tax on exporters—not a good incentive for growth.” Finally, after 18 years of a market deter-minedNER, why revaluation is still reported as harmful for the economy, when after all, there are more devaluation episodes than revaluation ones? This paper purports that an answer to these questions lie on the existence of media bias reporting the behavior of the
NER.
More specifically, the existence of an interest group populating media outlets with news to increase awareness on readers and government officials of revaluation and its “catastrophic” consequences is considered. When this is the case, the media benefits from an increasing audience and subsequent higher income, i.e., via advertising. The in-terest group’s goal is also fulfilled when government (fiscal authority) offers subsidies or the central bank (monetary authority) intervenes in the exchange rate market. Both insti-tutions may tame the expression of discomfort with policy measures upon the exchange
1
The Nominal Exchange Rate (NER) in Colombia is defined as the number of Pesos per Dollar. Devalu-ation is defined as an increase in the number of local currency –pesos– for one US dollar. RevaluDevalu-ation is a reduction in this relationship. In Colombia devaluation and revaluation are used indistinctively with respect to appreciation or depreciation which are more appropriate definitions. In this paper the former are used for consistency with the use in the media.
2For example, seeC ´ordoba(2001) for dollarization claims and andCaballero(2008) on returning to the
1967 exchange rate regime.
rate or subsidies in favor of the affected industries, gaining the affection of the interest group and the public.
There is a growing literature in the topic of media bias and media slant. Gentzkow
and Shapiro(2008) offer a review of the theoretical and empirical approaches to this topic.
There are supply and demand side models. On the supply side, the distortions of news and its relationship with private sector and government capture of media are the core subjects. On the demand side the distortion comes from the public, the public likes to see more news with certain bias or slant and media compete for them. The empirical evidence of media bias shown in this paper fits into the supply side models. Specifically, the work ofCorneo(2006) is an appropriate analytic framework for the alleged sources of media bias and slant in this paper.
Corneobuilds a voting and media capture model. To begin, an interest group seeks
to form a coalition with the media. The interest group is looking for a policy that will favor his current (ill-fated) status. Media can accept or not to form a coalition, when it does not, media shows independence and presents an honest state of the world. When it does, media reaches the citizen presenting a state of the world accordingly with the interest group’s view. Based on this state of the world, citizens vote in the next elections in favor of a policy (or policy maker) that alleviates it.Corneoestablishes the conditions for the coalition to be formed, and how citizens vote in the next elections under the state of the world presented by the media.
This theoretical sequence of events seems to fit well the Colombia’s news bias when reporting the behavior of theNER. The media, attentive to the message from an interest group, presents to the public the outrageous effects of a revaluation. The interest group is in search for sympathy and help from fiscal and monetary authorities. Once the mes-sage of disaster has been spread, a mix of timid-but-realistic and decisive-but-chimerical expressions of support from public servants appear. The bearer of the message becomes an allied of the interest group, increases his visibility and capitalizes political power for the next elections.
This paper finds empirical evidence ofCorneo’s sequence of events related to report-ing the behavior of the exchange rate in Colombia. First the relationship between the number of news, editorials and op-eds discussing the behavior of the NER and the oc-currence of revaluation or devaluation is explored. The findings support the hypothesis of asymmetrical number of news with a high (low) correlation of news and revaluation (devaluation). Second, not only the number, but the content and flavor of the news is explored using text analysis techniques. The results confirm the association of language and emphasis between “revaluation” (as a word) and the appearance of words such as: central bank, government and exporters; while the word “devaluation” is far from such words. Finally, the paper shows that the Colombian central bank’s decision to
vene in the exchange rate market is positively correlated with the asymmetric number of news discussing the behavior of theNERand not only with the arguments purported
by the central bank, such as to control short term volatility or accumulate international reserves.
The contribution of the paper is twofold. The first one is methodological, by framing media bias as the uneven reporting of an economic outcome, and using the asymmetry specification with a Negative Binomial Regression Model (NBRM) regression, the media bias is easily shown empirically. When text analysis is used and the correlation of words of interest shows a particular grouping, bias becomes more transparent. The second one is the new evidence on the motivation for a central bank to intervene in the exchange rate market. Showing how the number of news is correlated with intervention, even after taking into account the endogeneity of the variable, the paper introduces, so far an unob-served variable not taken into account in previous studies of central bank intervention of the exchange rate market (Taylor,1995;Humpage,2003). In the current macroeconomic policy setting were central bank independence is, by principle, unquestioned and fun-damental for inflation targeting, the finding that the central bank responds to an interest group pressure –via an excess of news and emphasis on harmful effects– allows to chal-lenge the assumption of independence as it has been defined and studied so far. This is an open door to examine further the motivations of a central bank when conducting monetary and exchange rate policy.
The remainder of this paper is structured as follows. Section 2 presents the data. Using a difference in means tests and theNBRMestimation section3shows the bias and asymmetry of the number of news with respect to the behavior of the NER. Applying text analysis, section 4 examines the content of news and shows the closeness of the word “revaluation” with words related to the need of government intervention. Section
5 shows the response from the central bank to the reporting of the exchange rate and section6concludes.
2 Data
This section briefly describes the data used in this paper, firstly, the different arrangement under the NER has functioned. Secondly, how the number of news was collected and finally some additional manipulation to this data for the analysis.
2.1 The Nominal Exchange Rate
Since December 1, 1991, Colombia has had a market determined exchange rate. The daily
NERis determined as the average exchange rate from eas operation in the market. Since then, multiple financial entities provide financial services in relation to foreign exchange
24/01/1994 25/09/1999
Exchange rate band
Exchange rate
bond Free market
0
500
1,000
1,500
2,000
2,500
3,000
Col pesos per US Dolar
1991 1993 1995 1997 1999 2001 2003 2005 2007 2009
[image:7.595.159.439.86.290.2]NER LB UB
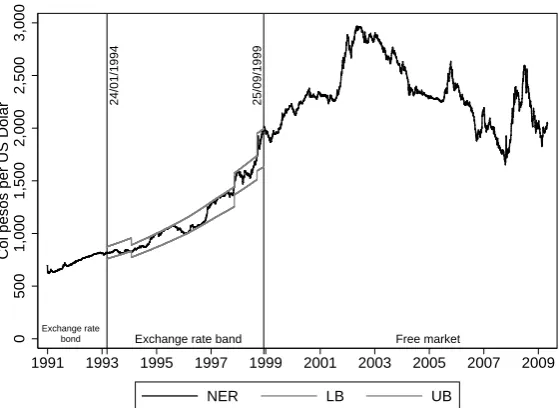
Figure 1.Colombia’s Nominal Exchange Rate (NER).
Note: Daily data. UB is the upper bound and LB the lower bound for the exchange rate band.
Source:Banco de la Rep ´ublica(2010).
currency on behalf of businesses or individuals. These financial entities are the partici-pants of the exchange rate market.
From December 1, 1991 to January 23, 1994, the Colombian central bank used the existing “certificado de cambio” or exchange rate bond to follow up the behavior of the
NER. This bond was available to exporters and local financial institutions holding US dollars. The bond had a maturity of 12 months, the price was set by the central bank with a maximum discount of 12.5 percent. The main purpose of the “certificado de cambio” was to phase-out the fixed exchange rate and to introduce market based mechanisms.
From January 24, 1994 to September 25, 1999, crawling bands were in place. The exchange rate bands were realigned several times: a reduction or revaluation (7 percent December 13, 1994) and two increments or devaluation (9 percent September 3, 1998 and 5 percent June 29, 1999). Since September 26 of 1999 theNERhas been determined solely by market forces in a dirty float scheme. Figure1shows the dailyNERfor the period of analysis. TheNERdata used in this paper is the dailyNER.3
2.2 News, editorials and op-eds on revaluation and devaluation
The number of news, editorials and op-eds comes from the electronic archive of Colom-bia’s main newspaper conglomerate,Casa Editorial El Tiempo.4 The economics newspaper
3TheNERdata is available from Colombia’s central bank web site, www.banrep.gov.co or from the
au-thor.
4
The news market in Colombia is rather small, using different outlets would had easily led the count of news to double counting the report of the behavior of theNER. For editorials and op-eds there is a fairly well organized news syndicate of commentators that distribute the same op-ed to different outlets, leading again to a double counting if were taken into consideration.
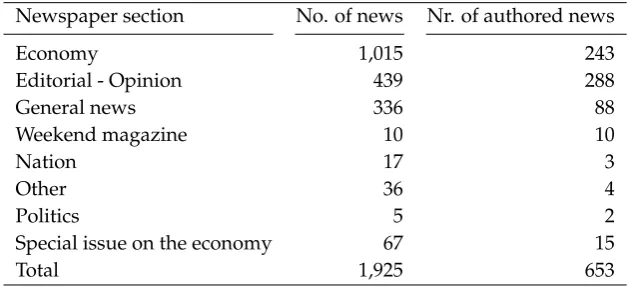
Table 1.Nr of news by section and authored
Newspaper section No. of news Nr. of authored news
Economy 1,015 243
Editorial - Opinion 439 288
General news 336 88
Weekend magazine 10 10
Nation 17 3
Other 36 4
Politics 5 2
Special issue on the economy 67 15
Total 1,925 653
Note: Authored news correspond to those where the name of author is pub-lished. News without author are assumed to be authored by newspaper staff. Editorial - opinion section include editorials and op-eds, op-eds are those which include the name of the author.
Source:Casa Editorial El Tiempo(2010)
Portafolioholds records of its content and the partner newspaperEl Tiempoand weekly magazine Cambioin a web-based archive. The words “devaluaci ´on” and “revaluaci ´on” were used jointly in the search. The output is a total of 2,109 news, editorials and op-eds (1,707 fromEl Tiempo, 394 fromPortafolioand 8 fromCambio). This information was extracted from January 1992 to December 2009. Information on date, author (if any iden-tified), section of the newspaper and title was recorded. News found in sections: science and technology, culture and leisure, international, car sales, home sales, Bogot´a local news, and paid commercial information were excluded from the sample. News were collected on daily frequency, and aggregated to the monthly number of news.
Figure2shows the monthly number of news.5 Peak periods are 1994, 1995, 2004, 2007 and 2008, with more than 20 news per month. There were also periods when the number of monthly news is low and even zero. The number of news per newspaper section and those that are authored is summarized in table 1. After removing news published in non-relevant sections (described above), the total number of news used in this study is of 1,925. Of these were 151 editorials, 288 op-eds and 1,486 news discussing revaluation and devaluation in different newspaper sections. News were mainly published in the economy, editorial - opinion and general news sections.
5From now on news, editorials and op-eds will be used interchangeably.
0
10
20
30
40
No. of news
M
[image:9.595.159.440.87.293.2]1992 1994 1996 1998 2000 2002 2004 2006 2008 2010
Figure 2.Devaluation/Revaluation news, editorials and op-eds.
Note: Number of news, editorials and op-eds published by theEl Tiempo,PortafolioandCambio.
Source:Casa Editorial El Tiempo(2010).
2.3 News andNERbehavior
The number of news and behavior of the exchange rate were aggregated to monthly data in the following way:
No. of newsM =
I ∑
i
Newsi (1)
and
∆%NERm M =I−1
I ∑
i (
NERt−NERt−m NERt−m
)
(2)
where M stands for monthly, m stands for the lag used in estimating the percentage change in theNER(30, 60, 90 and 180 days as lags were estimated), andI = 30stands for the aggregation period, 30 days for the monthly aggregate.
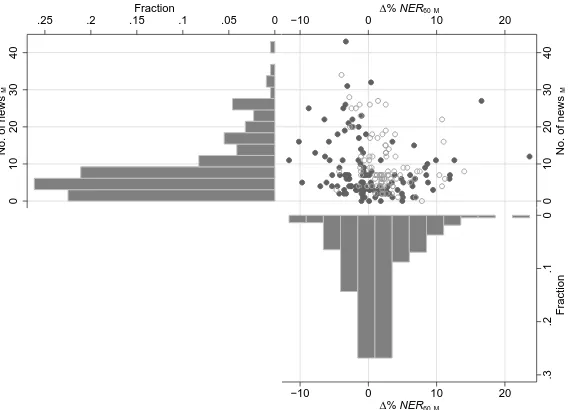
The time series of the monthly percentage change of the exchange rate and the num-ber of news is shown in figure3and a combined histogram and scatter in figure4, the 60 days lag is used for illustrative purposes. Both figures help to identify the suggested bias in favor of more news during a revaluation than a devaluation period. Figure 3shows there are not only more news in a revaluation period but even when devaluation is de-creasing, as in the 1994 and 1997 revaluation episodes. The scatter plot of both variables suggests a negative, non-linear, relationship between the number of news and the NER. Histograms show that the number of monthly news is skewed to less than 10 news, and there are more devaluation than revaluation episodes. Summary statistics of the number of news for both events and a test of difference of means is provided in table 2 for all news and editorials and op-eds only.
Exchange rate band Free market −30 −15 0 15 30 ∆ % NER 60 M 0 10 20 30 40 70
No. of news
M
1992 1994 1996 1998 2000 2002 2004 2006 2008 2010
[image:10.595.159.438.115.319.2]No. of news M ∆% NER60M
Figure 3.NERbehavior, news, editorials and op-eds.
Note: Left axis, Number of news, editorials and op-eds (monthly) published by theEl Tiempo,
PortafolioandCambio. Right axis monthly 60 days percentage change in theNER.
Source:NERbehavior fromBanco de la Rep ´ublica(2010); Nr. of news fromCasa Editorial El Tiempo(2010). 0 10 20 30 40
No. of news
M 0 .05 .1 .15 .2 .25 Fraction 0 10 20 30 40
No. of news
M
−10 0 10 20
∆% NER60 M
0
.1
.2
.3
Fraction
−10 0 10 20
∆% NER60 M
Figure 4.Distribution and scatter plot ofNERand news.
Note: Hollow circles correspond to pre-market observations, solid circles to market period
ob-servations.
Source: NERfromBanco de la Rep ´ublica(2010); Nr. of news fromCasa Editorial El Tiempo (2010).
[image:10.595.156.440.457.662.2]3 Media bias for revaluation
3.1 Test on means
The first approach to assess media bias as a disproportionate reporting of revaluation is a test of equality on means (test of means) and distribution (Wilcoxon rank-sum test) of monthly news over the number of devaluation and revaluation events. The test is performed using the count of devaluation and revaluation cases as defined in equation2
form= 30,60and the monthly number of news and editorials and op-eds only. If the first test is accepted it would mean that the average number of news reporting the behavior of the exchange rate (devaluation and revaluation) per month is statistically equal, if the second test is accepted it would mean that the distribution of news is the same for both instances (devaluation and revaluation), invalidating the hypothesis of media bias.
Both tests reject the null hypothesis that the mean and distribution are equal at high levels of statistical confidence. The tests confirm the hypothesis that revaluation episodes are over-reported in Colombia. This comes clear from the fact that for the monthly av-erage revaluation in the last 30 (60) days there are 96 (91) months of revaluation against 121 (125) of devaluation, and the average number of total news discussing the behavior of theNERis 10.3 (10.7) against 7.7 (7.5), and the average number of editorials and op-eds is 7.8 (8.1) against 6 (5.9), correspondingly.
Table 2. Test equality of means and Wilcoxon rank-sum test of equal distribution for the number of news and op-eds
Revaluation N = 96
Devaluation
N = 121
Test
m All news Mean SD Mean SD Stat P-value
30 T test of means 10.312 8.613 7.727 6.471 -2.443 0.015
Wilcoxon rank-sum test -2.067 0.019
Editorials and op-eds
T test of means 7.802 6.714 6.090 5.311 -2.0411 0.042
Wilcoxon rank-sum test -1.509 0.065
Revaluation N = 91
Devaluation
N = 125
Test
m All news Mean SD Mean SD Stat P-value
60 T test of means 10.758 8.843 7.568 6.207 -2.952 0.003
Wilcoxon rank-sum test -2.418 0.007
Editorials and op-eds
T test of means 8.120 6.876 5.976 5.143 -2.508 0.013
Wilcoxon rank-sum test -1.957 0.025
Note:Nis the number of devaluation / revaluation episodes,Meanis the average number of news, SDis the standard deviation,Statis the statistic of each test and theP-valuethe probability of equal means and distribution correspondingly.
3.2 Econometric estimation
In order to study further the media bias in favor of revaluation episodes, the following equation is estimated using a negative binomial econometric regression:
No. NewsM =f(∆%+NERmM,∆%−NERmM,Duration,Market dummy) (3)
plus the interaction with market period dummy.6
The NBRM was chosen for the discrete, non-zero, nature of the monthly number of news (No. NewsM) as dependent variable.7 As explanatory variables∆%NERmM is
mod-6The volatility of theNERwas also considered as an explanatory variable in the econometric estimation.
Volatility measured as the standard deviation is highly correlated with the behavior of the nominal exchange rate∆%NERmMas shown in figure13in the appendix, for this reason it was not included in the final results.
7
In preliminary estimationsNBRMexhibited better fit to the observed data than the Poisson Regression Model (PRM) (as the alpha parameter for over dispersion suggests in the results below). This paper is an application of count regression models and the basic formulation of NBRM, for this reason no formulae regarding the econometric methodology is presented. Full presentations of this technique can be obtained fromWooldridge(2001),Long and Freese(2006),Cameron and Trivedi(2005) andCameron and Trivedi
(2009).
ified with an interaction dummy variable for the coefficient to capture the asymmetry:
∆%−NERmM = ∆%NERmM ×DummyR where
DummyR= 1 if ∆%NERmM <0
DummyR= 0 otherwise
∆%+NERmM = ∆%NERmM ×DummyR where
DummyR= 1 if ∆%NERmM >0
DummyR= 0 otherwise
In addition as explanatory variable the duration of∆%NERmM is used (Durationin the results). The variable counts (in months) the duration of a devaluation/revaluation episode. It takes a value of 1 when the devaluatoin/revaluation lasts one month, and 2 the second month and so forth, the behavior of the variable is shown in figure 10 in the appendix for the case ofm = 30,60. A scatter plot of the three variables used in the regression is shown in figure9in the appendix. Finally a dummy variable equal to 1 for the free market (from September 1999 to present) period and 0 otherwise is also included in the estimation (Market dummyin the results). This variable accounts for the difference in the number of news during the free market with respect to the previous exchange rate schemes.
The estimation of equation3serves to the purpose of testing the hypothesis of whether there is a bias in the number of news when a revaluation event occurs (as in section2.3), plus if this has changed after the freeNER market began. Furthermore, allows to mea-sure the response of the number of news to the degree of devaluation/revaluation via the asymmetry coefficients.
The econometric results are in table3and4(m= 30,60) using as dependent variable the total number of news, editorials and op-eds. On general grounds, the coefficients of interest (∆%+NER
mM and∆%−NERmM) show the expected sign and magnitude. All
coefficients corresponding to a revaluation (∆%−NERmM) have positive and significant coefficient in both tables (except for columns 5, 11 and 12 in table 3), suggesting that revaluation increases the number of news. The lag of this variable is not significant.
The coefficients corresponding to a devaluation (∆%+NERmM) are not significant. Coefficients are only significant for the equations with 1 lag, in this case the lag has a negative and significant sign. Therefore either devaluation does not generate news or it decreases the number of news after two months. Furthermore, for each equation, if both coefficients were similar, the hypothesis of asymmetry and media bias would be rejected, but this is not the case since they are quite different.8
VariableMarket period dummyis significant and negative in all equations. This result suggests that the number of news is systematically lower during the dirty floating period (after Oct. 1999) with respect to the crawling bands period. However, the interaction
8
A simple test on equality of coefficients would suffice.
dummy with devaluation and revaluation episodes is not significant in all the estimated equations. The duration of the devaluation or revaluation period (Duration Dev/Rev) is only significant in some equations of the specification withm = 60. Equations 9 and 10 in table4are a good example: the negative coefficient suggests a reduction in the number of news while the duration of the devaluation or revaluation period is longer. This result can be interpreted as a decreasing effect of the behavior of the exchange rate over the news or awareness of the media. In all, the econometric estimation complements the results of table2in favor of the media bias for revaluation episodes hypothesis.
Table 3. Negative Binomial Regression Model (NBRM) estimation for Equation3, withm= 30.
1 2 3 4 5 6 7 8 9 10 11 12
∆%+
NER30M 0.0242 0.0503
c
0.0328 0.0598b
-0.0217 0.0357 0.0239 0.0502c
0.0324 0.0594b
-0.0235 0.0334
(0.0263) (0.0279) (0.0259) (0.0272) (0.0438) (0.0463) (0.0264) (0.0280) (0.0259) (0.0272) (0.0437) (0.0464)
t−1 -0.0530
c -0.0452c -0.0869c -0.0529c -0.0451c -0.0871c
(0.0278) (0.0271) (0.0478) (0.0278) (0.0272) (0.0478)
∆%−NER
30M 0.121
b
0.126b
0.175a
0.180a
0.0385 0.251c
0.121b
0.126b
0.175a
0.180a
0.00840 0.232
(0.0488) (0.0534) (0.0520) (0.0546) (0.121) (0.143) (0.0488) (0.0534) (0.0519) (0.0546) (0.121) (0.144)
t−1 0.0430 0.0780 0.135 0.0424 0.0763 0.114
(0.0528) (0.0528) (0.119) (0.0531) (0.0530) (0.119)
Market period dummy -0.340a
-0.407a -0.528a -0.470a -0.344a -0.409a -0.750a -0.655a
(0.114) (0.113) (0.162) (0.182) (0.115) (0.113) (0.215) (0.236)
∆%+
NER30Mx Market dummy 0.0789 0.0390 0.0822 0.0429
(0.0544) (0.0568) (0.0543) (0.0568)
t−1 0.0565 0.0573
(0.0566) (0.0566)
∆%−NER
mMx Market dummy -0.170 0.0699 -0.199 0.0533
(0.134) (0.155) (0.134) (0.155)
t−1 0.0718 0.0460
(0.132) (0.132)
Duration Dev/Rev -0.00578 -0.00211 -0.0102 -0.00591 -0.0386 -0.0209
(0.0201) (0.0198) (0.0199) (0.0195) (0.0260) (0.0260)
Duration x Market dummy 0.0613 0.0492
(0.0402) (0.0394)
Constant 2.052a
2.048a 2.183a 2.178a 2.305a 2.222a 2.072a 2.055a 2.220a 2.200a 2.458a 2.316a
(0.0800) (0.0880) (0.0918) (0.0947) (0.119) (0.137) (0.106) (0.114) (0.117) (0.120) (0.159) (0.179)
lnalpha -0.650a -0.722a -0.695a -0.791a -0.711a -0.816a -0.651a -0.722a -0.696a -0.792a -0.726a -0.826a
(0.115) (0.117) (0.117) (0.120) (0.117) (0.121) (0.115) (0.117) (0.117) (0.120) (0.118) (0.121)
Observations 217 216 217 216 217 216 217 216 217 216 217 216
AIC 1378 1367 1371 1356 1373 1360 1380 1369 1373 1358 1374 1362
BIC 1391 1387 1388 1380 1396 1397 1397 1392 1393 1385 1404 1406
R2
0.00479 0.0111 0.0111 0.0205 0.0130 0.0236 0.00485 0.0112 0.0113 0.0206 0.0150 0.0247
ll -685.0 -677.4 -680.6 -671.0 -679.3 -668.9 -684.9 -677.4 -680.5 -670.9 -678.0 -668.1
Note: Negative Binomial Regression Model. Dependent variable is the monthly number of articles and op-eds. Market dummy refers to the post-exchange rate
band period or free market period for theNERdetermination. Standard errors in parenthesis, a. p<0.01, b. p<0.05, c. p<0.1
Table 4. Negative Binomial Regression Model (NBRM) estimation for Equation3, withm= 60.
1 2 3 4 5 6 7 8 9 10 11 12
∆%+
NER60M 0.00460 0.0366
c
0.0108 0.0438b
-0.0194 0.0117 0.00437 0.0348c
0.0112 0.0413b
-0.0181 0.00243
(0.0150) (0.0196) (0.0145) (0.0188) (0.0267) (0.0299) (0.0149) (0.0197) (0.0143) (0.0188) (0.0264) (0.0301)
t−1 -0.0475
b
-0.0448b
-0.0306 -0.0450b
-0.0403b
-0.0213
(0.0198) (0.0191) (0.0292) (0.0200) (0.0193) (0.0297)
∆%−NER
60M 0.0953
a 0.0778b 0.135a 0.110a 0.229b 0.221b 0.0976a 0.0769b 0.144a 0.110a 0.242b 0.184c
(0.0295) (0.0358) (0.0313) (0.0355) (0.0910) (0.0989) (0.0294) (0.0356) (0.0310) (0.0351) (0.0957) (0.0983)
t−1 0.0318 0.0605
c
0.185b
0.0316 0.0629c
0.149
(0.0372) (0.0367) (0.0930) (0.0371) (0.0366) (0.0921)
Market period dummy -0.401a
-0.462a -0.451a -0.389b -0.460a -0.500a -0.799a -0.720a
(0.112) (0.111) (0.159) (0.169) (0.113) (0.113) (0.202) (0.211)
∆%+
NER60Mx Market dummy 0.0443 0.0520 0.0434 0.0607
c
(0.0319) (0.0366) (0.0314) (0.0365)
t−1 -0.0230 -0.0325
(0.0350) (0.0353)
∆%−NER
60Mx Market dummy 0.102 0.115 0.120 0.0801
(0.0967) (0.106) (0.101) (0.105)
t−1 0.145 0.113
(0.100) (0.0993)
Duration Dev/Rev -0.0209 -0.0154 -0.0316b
-0.0273c
-0.0547a
-0.0456b
(0.0152) (0.0151) (0.0150) (0.0149) (0.0182) (0.0185)
Duration x Market dummy 0.0809a
0.0722b
(0.0310) (0.0307)
Constant 2.049a
2.059a 2.201a 2.211a 2.236a 2.154a 2.135a 2.121a 2.355a 2.334a 2.504a 2.408a
(0.0785) (0.0837) (0.0892) (0.0907) (0.119) (0.129) (0.101) (0.104) (0.114) (0.113) (0.156) (0.166)
lnalpha -0.705a -0.755a -0.774a -0.846a -0.802a -0.914a -0.720a -0.759a -0.810a -0.864a -0.886a -0.956a
(0.117) (0.119) (0.119) (0.122) (0.120) (0.125) (0.117) (0.119) (0.120) (0.122) (0.124) (0.127)
Observations 216 215 216 215 216 215 215 215 215 215 215 215
AIc
1366 1356 1355 1341 1354 1339 1360 1357 1346 1340 1339 1336
BIc
1379 1376 1372 1365 1378 1376 1377 1381 1366 1367 1370 1380
R2
0.00898 0.0152 0.0182 0.0274 0.0217 0.0352 0.0110 0.0160 0.0228 0.0299 0.0319 0.0404
ll -678.9 -672.0 -672.5 -663.7 -670.1 -658.4 -674.9 -671.5 -666.8 -662.0 -660.7 -654.9
Note: Negative Binomial Regression Model. Dependent variable is the monthly number of articles and op-eds. Market dummy refers to the post-exchange rate
band period or free market period for theNERdetermination. Standard errors in parenthesis, a. p<0.01, b. p<0.05, c. p<0.1
3.2.1 Model selection and interpretation
The econometric results for equation 3 support the hypotheses of bias for more news when a revaluation episode occurs rather than when a devaluation one happens, con-firming the suggested relationship between the number of news and the NERbehavior. The interpretation of the NBRMcoefficients in tables 3and4 goes further, the response and probabilities can be predicted offering a more meaningful message. Based on the preferred regression, this section provides further interpretation of the coefficients.
The NBRM results in tables3 and4 include the AIC and BIC. Both criteria, and co-efficient significance, suggest that regression 2 and 4 in table3 and regression 4 and 10 in table 4should be preferred, they have the lowest AIC and BIC.9 In these regression
the variables of interest are significant and can offer a plausible interpretation once the marginal effects are computed, the remainder of this section brings additional interpre-tation to the econometric results presented in section3.2.
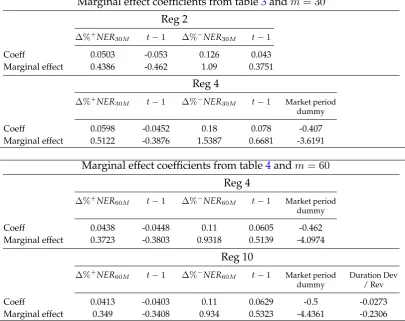
Table5shows the coefficient and marginal effect for regressions results withm = 30
and 60, and the preferred specifications. The marginal change in E(y|x) is ∂E∂x(yk|x) =
E(y|x)βkwhich is computed at the means of the continuous variables and the discrete
change for dummy variables from 0 to 1. The results of the marginal effect are conclusive in regards with the media bias and the asymmetric response for more news when reval-uation happens with respect to a devalreval-uation. Starting with Reg 2 when m = 30a 1% change in devaluation has a contemporaneous effect of increasing the number of news in 0.43%, offset by the first lag effect of 0.46%. While the same 1% change in revaluation increases the contemporaneous number of news in 1.09% plus 0.37% from the first lag. This effect is also observed in regression 4 when theMarket dummyis significant. The co-efficient forMarket dummyin regression 4 suggests a reduction in the number of news in the free market period of 3.6%. While the devaluation and revaluation effects (including the lag) are not very different from the observed for regression 2.
The set of marginal effects for the specification withm= 60is very similar to them= 30 cases. For this case it is worth to highlight the marginal effect of the duration of the devaluation or revaluation episodes. This time the longer the devaluation/revaluation has a negative effect upon the number of news. This result follows the logic presented above where the emphasis of the news decreases as the behavior of the exchange rate continues.
The predicted probabilities for a specific number of news using different values of the explanatory (and continuous) variable used in the regression are also obtained. This was done for regression 2 from table3(the set of results whenm= 30is used). The predicted
9
An informal method for assessing the fit between count models is to compare their mean predicted probability with respect to the observed probability (Long and Freese,2006). Figure11in the appendix shows this deviation, the differences between regressions is nil.
Table 5.Marginal effect for selected estimation results.
Marginal effect coefficients from table3andm= 30
Reg 2
∆%+
NER30M t−1 ∆%−NER30M t−1
Coeff 0.0503 -0.053 0.126 0.043
Marginal effect 0.4386 -0.462 1.09 0.3751
Reg 4
∆%+
NER30M t−1 ∆%−NER30M t−1 Market period
dummy
Coeff 0.0598 -0.0452 0.18 0.078 -0.407
Marginal effect 0.5122 -0.3876 1.5387 0.6681 -3.6191
Marginal effect coefficients from table4andm= 60
Reg 4
∆%+
NER60M t−1 ∆%−NER60M t−1 Market period
dummy
Coeff 0.0438 -0.0448 0.11 0.0605 -0.462
Marginal effect 0.3723 -0.3803 0.9318 0.5139 -4.0974
Reg 10
∆%+
NER60M t−1 ∆%−NER60M t−1 Market period
dummy
Duration Dev / Rev
Coeff 0.0413 -0.0403 0.11 0.0629 -0.5 -0.0273
Marginal effect 0.349 -0.3408 0.934 0.5323 -4.4361 -0.2306
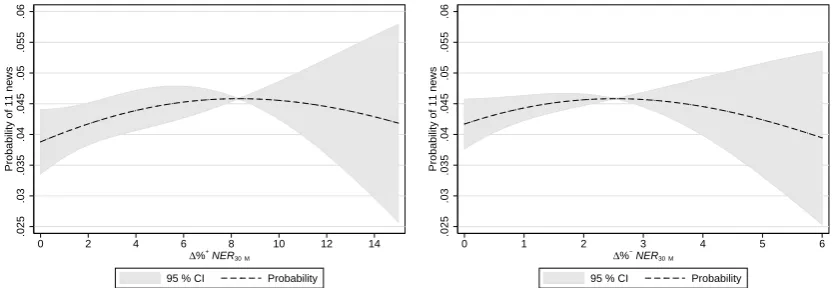
probabilities where estimated for 11 news published each month (average number of news observed during revaluation periods, see table2), and a revaluation / devaluation from 0 to 15 percent. The results are shown in figure5.10
The figure corroborates the results discussed previously, the number of news is influ-enced by the occurrence and degree of a revaluation instead of a devaluation. This result keeps suggesting the media bias for news in revaluation periods. The predicted proba-bilities show how about 8 percent devaluation would be necessary to obtain the average of 11 news, but how only 2.5 percent revaluation is needed to have the same number of news.
10
This equation was chosen for simplicity in the generation of predicted probabilities and the fact that coefficients are similar with respect to the preferred regression results discussed above.
.025
.03
.035
.04
.045
.05
.055
.06
Probability of 11 news
0 2 4 6 8 10 12 14
∆%+ NER30 M
95 % CI Probability
a.Predicted probability for devaluation
.025
.03
.035
.04
.045
.05
.055
.06
Probability of 11 news
0 1 2 3 4 5 6
∆%− NER30 M
95 % CI Probability
[image:19.595.89.506.98.242.2]b.Predicted probability for revaluation
Figure 5.Predicted probability for 11 news per month.
Note: Predicted probability for 11 news per month for different values of variation in theNER, from regression 2 in table3.
4 The flavor of news, editorials and op-eds discussing devaluation and revaluation in Colombia
As argued in the introduction, economics commenters and journalists in Colombia react easily to revaluation rather than to devaluation, likely influenced by an interest group seeking sympathy and assistance, suggesting the existence of media bias. Furthermore, such dislike for revaluation is accompanied with circumstantial evidence of the harmful effect upon the export industries; and at the same time with a call for help from fiscal or monetary authorities. In the previous section, such bias has been shown using statistical test and regression results. However the mere count of news containing the words “de-valuaci ´on” and “re“de-valuaci ´on” ant its correlation can not show wether the news actually have the taste of dislike and the connection with an interest group. This section reports on the flavor of news, editorials and op-eds discussing devaluation and revaluation in Colombia using text analysis or text mining.
Text analysis seeks to transform text, or a collection of text also called corpus, into numerical information. Such data is intended to present text in a systematic way for fur-ther statistical analysis (Francis and Flynn,2010;Fagan and Gencay,2011). Standard text analysis implies preprocessing unstructured text and statistical analysis of the processed text. Preprocessing includes determining the format of the text, the length of the text or collection of texts (corpus), parse the text eliminating spaces, punctuation and non in-formative words, collect in a single word plurals and variants of words conveying the same meaning, and transforming words into a data structure where for each document in the corpus words are counted becoming a variable. Once preprocessing is done, differ-ent statistical procedures can be applied upon this data structure, conveying information
about the text.
4.1 Preprocessing
The text of 1,854 news was collected and preprocessed usingtm: Text Mining Package
(Feinerer et al.,2008;Feinerer,2011) in R statistics software (R Development Core Team,
2011). The preprocessing included: 1. Converting text to lower case.
2. Removing white spaces and punctuation.
3. Collecting similar meaning words into a single expression / word:
a) asistencia (assistance)⇐ asistencia, ayuda, financiaci ´on, subsidio, subsidios (assistance, help, financing, subsidy, subsidies).
b) bancodelarep ´ublica (central bank) ⇐ banco de la rep ´ublica, banco, emisor, junta directiva (central bank, bank, issuer, board).
c) bandacambiaria (crawling band)⇐banda cambiaria (crawling band).
d) crecimientoecon ´omico (economic growth)⇐crecimiento econ ´omico (economic growth).
e) dolar (dollar)⇐d ´olares (dollar).
f) estadosunidos (United States)⇐estados unidos (United States). g) flores (flowers)⇐floricultor, floricultores (flower growers).
h) gobierno (government)⇐ministro, ministerio (minister, ministry). i) medidas (measures)⇐medida (measures).
j) salario (wages)⇐salarios (wages).
k) tasadecambio (exchange rate)⇐tasa de cambio, tasa de cambio nominal (ex-change rate, nominal ex(ex-change rate).
l) tasadecambioreal (real exchange rate) ⇐ tasa de cabmio real (real exchange rate).
m) tasadeinter´es (interest rate)⇐tasa de inter´es (interest rate). 4. Removing stop words in Spanish, such as: el, lo, los, las, etc.
4.2 Statistical analysis
Once the text preprocessing stage is done, the software transforms the remaining words into a document term matrix in which numerical data is collected based on a given cri-teria. The first criteria used in this analysis is to obtain words that appear at least 1,500 times in the corpus (table6shows the output). There are 27 words meeting this criteria, several words are clearly part of standard speech discussing the behavior of the nominal exchange rate.
As expected, the words “devaluaci ´on” and “revaluaci ´on” are part of this list. Not surprisingly as well, Colombia’s central bank (bancodelarep ´ublica) is the most repeated
Table 6.Words appearing more than 1,500 times in the corpus.
bancodelarep ´ublica colombia crecimiento devaluaci ´on d ´olar econom´ıa exportaciones gobierno inflaci ´on
inter´es mayor mercado
millones pa´ıs parte
pasado peso pesos
pol´ıtica precio precios
presidente revaluaci ´on sector tasadecambio tasas
Note: The table shows from left to right the words that ap-pear more than 1,500 times in the corpus.
word, news discussing the behavior of the exchange rate should mention this institution. Less obvious, however, is the absence of the word “imports” (importaciones) since the word “exports” (exportaciones) is on the top 10; if the treatment of the behavior of the exchange rate were not biased then the word “imports” as the activity affected because of an increasing exchange rate should be mentioned in the corpus as often as the word “exports”. Finally the word “president” (presidente) is also part of this group, rasing the question of why the president of the government is brought into the discussion of the behavior of the exchange rate if there were no intention to request assistance to the executive.
The second criteria to analyze the corpus is to obtain the top correlated words with the target words of this study, i.e.: “devaluation” (devaluaci ´on), “revaluation” (revaluaci ´on) and “colombia’s central bank” (bancodelarep ´ublica). Table 7, shows the words with a correlation higher than 25% for the entire period of analysis, from 1992 to 2009. The re-sults are a clear indication of the argument raised in the paper about the over-emphasis of a revaluation episode. The word “devaluation” (devaluaci ´on) is correlated with nat-urally corresponding words such as “dollar” (d ´olar) and “exchange rate” (tasadecam-bio) and only two more words; for a total of 4 words. However the word “revaluation” (revaluaci ´on) is highly correlated with 21 words, including: the central bank, exporters, and government. This shows again the use of the words and the context on which they are employed, while devaluation is employed along other words to simply describe the behavior of the exchange rate, revaluation is highly associated with the central bank, ex-porters, government and stopping (frenar) the exchange rate’s decreasing trend. If the treatment of the behavior of the exchange rate by the media where equalitarian, the as-sociation of words would not show such disparity.
The third expression of interest is “central bank”. Clearly the central bank is in the core of the news reporting not only the behavior of the exchange rate but inflation target-ing, hence associated words appear (inflation, monetary policy, target, rates, etc.). How-ever it must be highlighted that the word devaluation is not part of this list, showing
Table 7. Words with a correlation of 25% or higher for Devaluation, Revaluation and Colombia’s central bank.
Devaluation Revaluation Colombia’s central bank
devaluaci ´on 1 revaluaci ´on 1 bancodelarep ´ublica 1
d ´olar 0.31 peso 0.38 gobierno 0.43
tasadecambio 0.28 bancodelarep ´ublica 0.37 revaluaci ´on 0.37
efecto 0.26 d ´olar 0.37 hacienda 0.36
venezuela 0.25 exportadores 0.34 manejo 0.34
gobierno 0.33 tasadecambio 0.34 tasadecambio 0.32 d ´olar 0.33 frenar 0.29 inflaci ´on 0.33
mayor 0.28 monetaria 0.33
tema 0.28 bandacambiaria 0.32
controlar 0.27 frenar 0.32
importante 0.27 inter´es 0.32
inflaci ´on 0.27 pol´ıtica 0.31
parte 0.27 cambiario 0.30
´ultimos 0.27 meta 0.30
exterior 0.26 p ´ublico 0.30
fen ´omeno 0.26 tasas 0.30
problema 0.26 divisas 0.29
sido 0.26 medida 0.29
capitales 0.25 medidas 0.29
pa´ıs 0.25 mercado 0.28
sino 0.25 controlar 0.27
decisi ´on 0.27
parte 0.27
presidente 0.27
tema 0.27
evitar 0.26
tasa 0.26
liquidez 0.25 Note: The table shows the correlation for the words “revaluation”, “devaluation” and “central bank”.
how in the media, revaluation is a principal component of the language and is directly associated with the central bank, but not devaluation in spite of being the other side of the same coin.
The previous two criteria to analyze the corpus were unstructured, on the sense that no limits were imposed on the number or correlation between the words being stud-ied. The third, and final, criteria imposes a set of words to be studied, from this set of words an association metric is obtained and summarized in an association matrix, then hierarchical clustering methods “collapse” the number of words into groups based on the association between words, reducing the dimension of the matrix, this process is dis-played in a dendrogram or tree diagram that shows the grouping or clustering of words within the corpus. The hierarchical method used is the single linkage method upon an association matrix containing the cross correlation for the chosen set of words (a good
introduction to the topic can be found in Johnson and Wichern, 2002). Table 8 shows the set of words chosen for this analysis and figures 6and7the dendrogram for all the period of analysis, and the exchange rate band period and free market period.
The core words analyzed are devaluation and revaluation (keywords category in ta-ble8), going through the closeness of both words and the branch structure around them can help to show the hypothesis of overemphasis on revaluation, sustained thorough the paper. In second place are the words associated with public institutions such as the “central bank” (bancodelarep ´ublica) and “government” (gobierno), the closeness of these words to any of the core words are indication of the implied link of public institutions with the behavior of the exchange rate.
Thirdly comes the interest group words. These words gather private interest groups that might have a particular interest in the behavior of the exchange rate and then, play a role in shaping the emphasis to report unfavorable circumstances and unfolding a mes-sage of disaster and need of assistance. Fourth in importance is “assistance” (asistencia), if such word is or is not close to revaluation and public institutions, and at the same time is far from devaluation, is evidence of the link:
revaluation → interest
group ↔
over-emphasis in the media →
public
institution → assistance (4)
The remaining group of words are included to populate the information matrix with relevant terms or words concerning the behavior of the exchange rate and public institu-tions. If these words were not included in the analysis, the information matrix and the clustering method would generate a naive correlation and dendrogram, obviously link-ing a limited number of terms. By includlink-ing a variety of related terms the correlation and the clustering will make the right connection between words, unfolding the existence or not of the proposed closeness in diagram4.
Table 8.Words used in the hierarchical clustering analysis.
Cathegory Spanish English
Economic variables
competitividad competitiveness
desempleo unemployment
industria industry
inflaci ´on inflation
exportaciones exports
importaciones imports
tasadeinter´es interest rate
Goods
banano banana
caf´e coffee
flores flowers
petroleo oil
Interest group
andi Colombia’s national industry association fenalco Colombia’s national retailers association
exportadores exporters
importadores importers
Keywords revaluaci ´on revaluation
devaluaci ´on devaluation
Positive and negative wording
crisis crisis
exito success
progreso progress
Public institutions bancodelarep ´ublica Colombia’s central bank
gobierno government
Public assistance asistencia assistance
From the dendrogram corresponding to the whole period of analysis (figure6), the closeness or similarity between the “central bank”, “government” and “revaluation” (bancodelarepublica, gobierno and revaluaci ´on) is clear, these words gave shape to the first cluster. The word “assistance” is the nearest expression to this cluster, such outcome shows the closeness among these expressions. In contrast, the word devaluation is far from this cluster. If media covered the behavior of the exchange rate evenly and inadver-tently, the words “devaluation” and “revaluation” should form a cluster themselves, and if naturally interest parties were involved in creating awareness of the behavior of the ex-change rate, the words “exporters” and “importers” should also form a cluster close to this one, both associations would have happened regardless of a public institution were included in the analysis or not.
This patter of association is also observable in panel (a) of figure7for the exchange rate band period. In this case, the word “assistance’ is not par of the cluster “central bank”, “government”, “exporters” and “revaluation” (bancodelarep ´ublica, gobierno, ex-portadores and revaluaci ´on). A notable cluster is formed by “fenalco”, “crisis”, “andi” and “unemployment”. This grouping still shows the emphasis from business and ex-porters to qualify revaluation as a negative event, without resorting to public
0
.2
.4
.6
.8
1
correlation similarity measure
progreso exito
bananopetroleofloresindustria café
devaluación
competitividadexportacionesimportaciones andi
fenalco
importadores crisis
desempleoasistencia inflación
exportadores
bancodelarepública gobierno
[image:25.595.119.482.92.344.2]revaluación tasadeinterés
Figure 6. Dendrogram for hierarchical clustering from correlation matrix. Corpus from 1992 to 2009.
tions for assistance. Finally, panel (b) shows the dendrogram for the free market pe-riod. Here again “central bank”, “assistance”, “government” and “revaluation” (ban-codelarep ´ublica, gobierno, assistance and revaluaci ´on) are the first cluster with a high correlation.
In all, using text analysis supports the regression analysis results of section3from a different perspective. In the previous section, bias was defined as the uneven reporting of the behavior of the exchange rate, and using the count of news the proposed asymmetric relationship was established. In this section, by examining the content of the news, it has been shown that the reporting of the behavior of the exchange rate is strongly linked with words such as: “assistance”, “public institutions” and “exporters”, unveiling the link revaluation – exporters – public assistance. Beyond showing the media bias, it remains to see if such over-reporting has any effect upon public authorities, this is, if the bias does have effect or not on the behavior of economic authorities. The next section addresses this issue.
0 .2 .4 .6 .8 1
correlation similarity measure
petroleo progreso banano exito importadores asistencia industria devaluación flores café competitividad exportaciones importaciones desempleo andi crisis fenalco inflación exportadores bancodelarepública gobierno revaluación tasadeinterés a. Exchange rate band period 0 .2 .4 .6 .8 1
correlation similarity measure
[image:26.595.446.739.114.481.2]5 Does media bias matters? Modeling the central bank intervention in the exchange
rate market
Having established the asymmetric character of news reporting the behavior of theNER, and the link within the news between revaluation, an interest group and public insti-tutions; this section investigates wether the bias gives shape to the exchange rate policy. There are two policy response options for the behavior of theNER. First from government officials (fiscal authorities). They can offer subsidies and support programs for specific exporting industries that seem to be affected by a revaluation episode. This is often the case in Colombia, there has been financial assistance (or at least the announcement of) throughout different government departments and ministries. Unfortunately such pro-grams are easily politicized, and broadly defined in scale and scope to be measured as a proper response from policymakers to the media bias, and not to be confused with favoritism of another kind.
The second, and more plausible option is the response from the central bank (mon-etary authority). Colombia’s central bank can intervene in theNER market. Statutorily, reducing and controlling inflation is the sole function of the central bank, containing the
NERis not a priority, furthermore the exchange rate policy is shaped to support holding inflation. However, the central bank has become an active agent in the market. Using a probit estimation, this section models the central bank decision to intervene in the NER
market. The variable of interest is the number of news, which should show if the exces-sive reporting of news of a revaluation episode has any effect upon the central bank’s decision to intervene or not.
After the end of the exchange rate or crawling band system in late 1999, Colombia’s central bank has applied three mechanisms to intervene in the exchange rate market. A Dutch auction of financial options with the purpose to accumulate international reserves, a Dutch auction of financial options with the purpose to tameNER’s volatility, and third, direct purchase/sell operations in the market.
The options to accumulate international reserves has a length of a month, during this period if the daily exchange rate is below the previous 20 days average, then the central bank will buy the option to the bearer. These options where employed from November 1999 to may 2008. Options to tame volatility are executed whenever the exchange rate deviates 5% with respect to the moving average of the exchange rate of the last 20 days. These options where employed from December 2004 to July 2009. Since September 2004, purchase/sell operations have been performed at will of the central bank, for no more than US $20 million per day.
Followingkamil(2008) andEchavarria et al.(2010), since volatility, international re-serves and inflation (deviation from the target) shape the decision to intervene in the ex-change rate market a probit model is estimated using these variables plus the number of
news. This estimation does not intend to completely model the central bank’s exchange rate policy, but only to find if news, and the subsequent bias, does or does not have an ef-fect upon central bank intervention in the exchange rate market. The dependent variable (CB buyM – central bank buy) is a dummy variable that takes the value of 1 if the central bank bought US dollars in the market in monthM, and zero otherwise. Data on market intervention is only publicly available at a monthly basis. Several requests of daily or weekly data were undertaken with Colombia’s central bank officials and access to dis-aggregated data was denied on confidentiality grounds. However since inflation and international reserves are only available on a monthly basis this data frequency binds the subsequent analysis.
The explanatory variables are:
1. The monthly number of news (used in the media bias estimation) (No. NewsM). 2. The volatility of theNER, defined as the monthly average of the standard deviation
of the lastSdays (SDSM).
3. Inflation, measured as the deviation from the inflation target (π- Target=πm−12− πT arget). Where
4. international reserves (Int. Reserves), measured as theSdays percentage change. The estimated equation is5, and the results are shown in table9.
CB buyM =f(No. NewsM,SDSM, π- Target,INT. RESSM) (5)
The estimation output in table9shows a positive relationship between the number of news and the probability to intervene in the exchange rate market from the central bank (Reg 1). Adding volatility, inflation target deviation and international reserves does not change the positive relationship in Reg 1. Furthermore, the increasing volatility sug-gests lower probability of intervention, while deviation from inflation target sugsug-gests an increasing probability. The results are neither quantitative nor qualitative different between m = 30 andm = 60. A further view of this result comes with the predicted probability for each significant explanatory variable holding the remaining variable at the mean (figure8).
The probability of the central bank buying dollars increases from 40% to almost 100% as long as the number of news increases, it also increases with a positive deviation from the inflation target, while decreases from 70% to 30% as volatility increases.
The variable number of news per month (No. NewsM) may be endogenous if there were news reporting the intervention of the central bank. From the text analysis in section
4no evidence of words such as: intervention, purchase or buy was found, however this variable is susceptible to be endogenous in the estimation. Regression 3 in table9shows the instrumental variable estimation when regression 2 is estimated instrumenting the number of news with the number of news of the last month (No. News (t-1)M). The lagged
Table 9. Probit estimation for central bank intervention in the NER
market.
m= 30 m= 60
Reg 1 Reg 2 Reg 3 Reg 1 Reg 2 Reg 3
No. NewsM 0.0442b
0.0471b
0.0384 0.0442b
0.0418b
0.0384 (0.0172) (0.0230) (0.0505) (0.0172) (0.0211) (0.0474)
SDmM -0.0168b -0.0161b -0.00892c -0.00882c
(0.00750) (0.00866) (0.00477) (0.00497)
π- Target 0.152b
0.162c
0.153c
0.158c
(0.0716) (0.0835) (0.0702) (0.0852)
INT. RESmM -0.0371 -0.0366 -0.0191 -0.0192
(0.0311) (0.0315) (0.0217) (0.0217)
Constant -0.158 0.225 0.275 -0.158 0.192 0.215
(0.172) (0.227) (0.325) (0.172) (0.237) (0.359)
ρ 0.0736 0.0289
(0.260) (0.254)
σ 1.864a
1.873a
(0.0635) (0.0635)
Instrumental vari-able forNo. NewsM
Yes Yes
Exogeneity test Ho: ρ = 0 for
No. NewsM (P-value)
0.777 0.910
Observations 124 124 124 124 124 124
AIC 165.9 162.7 990.8 165.9 164.5 994.8
BIC 171.6 176.8 1025 171.6 178.6 1029
Linktest (t-value) -0.725 -2.363 -0.725 -1.711
R2 0.0434 0.0981 0.0434 0.0876
ll -80.97 -76.33 -483.4 -80.97 -77.23 -485.4
Note: Dependent variable is the dummy variable for central bank purchasing US dollars in the
NERmarket. Linktest is a specification test for binary dependent variable models that estimates the regressiony=f(ˆy,ˆy2
)thetvalue of the coefficient corresponds to the significance test foryˆ2 . The instrumental variable forNo. NewsMisNo. NewsM(t−1). Heteroscedasticity robust standard
errors in parenthesis, a. p<0.01, b. p<0.05, c. p<0.1.
value is a good instrument of the current monthly number of news since it is correlated with it and not with the central bank intervention in the current period.11 The estimation result of this specification goes against the endogeneity ofNo. NewsM, theρcoefficient, showing the correlation between the instrument and the endogenous variable, is not statistically different from zero (probability 0.77 of ρ = 0), therefore the hypothesis of endogeneity can be rejected, and this estimation discarded.
The finding of this section closes the logic proposed in the paper when a public insti-tution, the central bank in this case, reacts to the number of news reporting the behavior of the exchange rate, after have shown that the news are biased in favor of revaluation
11
A relationship such asNo. News(t−1) =f(CB buyM)is not expected to be significant, simply because
the current intervention in the market can not explain the number of news in the last period.
.2
.4
.6
.8
1
1.2
0 10 20 30 40
No. of news M
a.Predicted probability for the number of news
0
.2
.4
.6
.8
0 20 40 60 80 100
SD30M
b.Predicted probability for volatility
0
.2
.4
.6
.8
1
−6 −4 −2 0 2 4
Dev. from infl. target
[image:30.595.208.389.263.395.2]c.Predicted probability for inflation
Figure 8. Probability of central bank buying dollars in theNER mar-ket, from regression 2 withm= 30in table9.
Note: Each figure shows the probability (solid line) and confidence intervals (gray area) from regression 2 of the central bank buying dollars in theNERmarket holding the other variable at its mean.
episodes and its content is mainly from exporters in search of assistance. This result is important since it challenges the decision making process of the central bank to intervene in the exchange rate market.
6 Conclusion
The paper reaches three main conclusions. First, there is media bias when reporting the behavior of theNER, the paper shows there are more news during a revaluation episode than a devaluation one. This bias is measured in a model of asymmetric response of the devaluation/revaluation against the number of news that discuss the behavior of theNER. The interaction coefficient between the asymmetric coefficient and the market period dummy is significant for a revaluation but not for devaluation, suggesting that the bias continued after the end of the exchange rate band scheme. Second, the content of the news is closely linked to the words “exporters”, “revaluation”, “central bank”, “government” and “assistance”, showing that in a high proportion news are not only
published during revaluation of the exchange rate, but that news report the claims of help from an interest group to public institutions. And third, Colombia’s central bank intervenes in the exchange market buying US dollars responding to the number of news (the bias) and not volatility of theNER.
The econometric results only settle down the proposed bias for revaluation news to a testable level, but tell us nothing regarding why it happens. A principle of journalism is unbiasedness, if this principle were in action in this particular economic event, the num-ber of news discussing the behavior of theNER should be the same when a devaluation or a revaluation happens, however this is precisely not the case. Economic journalism in Colombia is biased. The remaining question is why?
TheCorneo(2006) model suggests that there is media bias after the media has made
a coalition with an interest group. For the case studied in this paper, that interest group can be the exporting industries which are directly affected by revaluation of the exchange rate. Journalists, editors and commentators become the public reflection of exporting in-dustries. Exporting industries using newsletters, press releases, public announcements and their own associations and conferences, disseminate their discontent with the eco-nomic environment and revaluation episodes. This discontent is received by the press and becomes a source of news, editorials and op-eds. There are more news discussing revaluation because the exporting industries are complaining about it, and there are less news discussing devaluation because the exporting industries benefits from it.
Furthermore the complaints and the news are not an end by themselves, the industry complains in search for government assistance. And in fact this is the case, fiscal au-thorities subsidize “affected” industries and central bank intervenes in the exchange rate market. The third finding shows that the central bank responds to the number of news and not volatility to intervene in the exchange rate market (completing the mechanics of
theCorneomodel). This result is in clear contrast to the idea of an independent central
bank. In the Corneo model, policy makers respond to the media bias in order to keep incumbency in office, or face the challenge of the public. Colombia’s central bank board is not subject to public elections but they do face scrutiny and take the blame for the be-havior of the NER. This shows that the board of the central bank is quite aware of the media highlights and reacts to them as well as to economic variables.
If the number of news is taken as a proxy for the pressure of local exporting industries to magnify the effects of a revaluation and seek government assistance, this behavior speaks ill of the industry. The determination of the NER in Colombia has been set by market mechanisms for almost 20 years and there are still complaints about adverse the results of the market. How long can it take for the exporting industry to adjust and learn from the market? Why exporters do not engage in the use of financial tools such as
futures and derivatives to edge against adverse events?12 In spite of the result reported here of a lower news bias during the free market period, this seems to be a case of a slow learning, if not unlearning, by exporting.
12Financial tools have been available in Colombia for at least a decade, as reported inEl Tiempo(1997)
andEl Tiempo(2004), even the head of the exporters association guild declared “[exporters] seem to con-tinue their business as if the Act Nr. 444 of 1967 were still in place, [under such scheme] with a guaranteed and continuous devaluation” ([los exportadores] todav´ıa manejan sus negocios como si existiera el Decreto 444 de 1967 que garantizaba una devaluaci ´on gota a gota)Gonz´alez(2009).
Appendices
Appendix 0.A Acronyms
NBRM Negative Binomial Regression Model
NER Nominal Exchange Rate
PRM Poisson Regression Model
RER Real Exchange Rate
VAR Vector Auto Regression
Appendix 0.B Additional figures and tables
This appendix shows several figures with the purpose to validate the use of the data and results shown in the main text. First, it is argued that an interest group might re-act strongly to the behavior of the Real Exchange Rate (RER) instead of theNER and its
volatility. Figures 12and13show that there is no difference in them = 30andm = 60
days percentage change between theNERandRER; and how volatility and the percentage change of the NER are not very different either. Secondly, figure14 shows the number of news as defined in the text and the time series of the RER form = 30 andm = 60, accordingly to the previous two figures, considering using theRERwould not make any difference. As argued in the text, these figures confirm that using the NER percentage change instead of theRERis appropriate. Finally a Vector Auto Regression (VAR)
estima-tion is undertaken for the central bank decision to intervene (equaestima-tion5) with 1 and 2 lags structure andm = 30 andm = 60. This estimation, confirms there is no feedback effect from the central bank intervention upon the number of news, although collinearity between then number of news, volatility and inflation does exist, this has been addressed in the estimation included in the text using robust standard errors.
No. of news
M
∆%
NER30 M
SD30 M
Duration Dev/Rev
0 10 20 30 40 −10
−5 0 5 10
−10 −5 0 5 10 0
50 100
0 50 100
0 5 10 15
a.Form= 30
No. of news
M
∆%
NER60 M
SD60 M
Duration Dev/Rev
0 10 20 30 40 −10
0 10 20
−10 0 10 20 0
50 100 150
0 50 100 150 0
5 10 15 20
[image:36.595.160.422.173.630.2]b.Form= 60
Figure 9. Scatter plot dependent and explanatory variables for m = 30,60.
Source: NERbehavior fromBanco de la Rep ´ublica(2010); Nr. of news fromCasa Editorial El Tiempo(2010).
0
5
10
15
Months
1992 1994 1996 1998 2000 2002 2004 2006 2008 2010
Duration rev Duration dev
a.Form= 30
0
5
10
15
20
Months
1992 1994 1996 1998 2000 2002 2004 2006 2008 2010
Duration rev Duration dev
[image:37.595.158.444.145.611.2]b.Form= 60
Figure 10.Cumulative count of time period with devaluation / reval-uation.
Note: Count variable of the number of days of devaluation/revaluation form = 30,60. The variable takes a value of 1 if the devaluation/revaluation period lasts one time period (a month), 1 the first time period and 2 the second time period if the devaluation/revaluation period lasts two time periods, and so forth.