doi: 10.17711/SM.0185-3325.2018.026
Validation of the Clock Drawing Test Scoring Method
in older adults with neurocognitive disorder
Sara G.Aguilar-Navarro,1Alberto J.Mimenza-Alvarado,1María A.Samudio-Cruz,1Francisco J.Hernández-Contreras,1 Lidia A.Gutiérrez-Gutiérrez,2FátimaRamírez-González,1José A.Avila-Funes1,3
ABSTRACT
Introduction. The Clock Drawing Test (CDT) is a widely used instrument for identifying neurocognitive dis-orders (NCDs) in older adults. However, there is insufficient evidence to determine the best scoring method, since current quantitative methods involve the assignment of numerical values, while qualitative ones do not allow for objectivity in the diagnosis. Parsey and Schmitter-Edgecombe (2011) proposed a scoring scheme which, in addition to providing a score of the patient’s performance, permits error analysis, thereby making it possible to identify potential underlying cognitive difficulties. Objective. The purpose of this study was to vali-date the CDT scoring scheme proposed by Parsey and Schmitter-Edgecombe (2011) for screening for NCDs in Mexican older adults. Method. There were 167 participants: 58 cognitively healthy subjects (CH), 52 with mild neurocognitive disorder (mild-NCD), and 57 with major neurocognitive disorder (major-NCD).The CDT scoring method was compared with the Mini-Mental State Examination (MMSE) and the Montreal Cognitive Assessment in Spanish (MoCA-S). Inter- and intra-observer reliability and construct validity were determined and the sensitivity and specificity of this method were calculated. Results. The age was 75 years (SD ± 8 years) and the educational attainment was 10.7 years (SD ± 5.2 years). Internal reliability was .750, with an intraclass correlation coefficient of .774. The cut-off point for the CDT in mild-NCD was 14 points (sensitivity: 40%, specificity: 70%) and 12 points for major-NCD (sensitivity: 90%, specificity: 95%).The most frequent errors in the CDT were: graphic, conceptual, spatial, and/or planning difficulties. Discussion and conclusion. This method makes it possibly to quickly and easily explore the cognitive status of the patient. It contains ideal psychometric properties for the detection of patients with major-NCD, in addition to offering the possibility of analyzing performance errors and underlying cognitive difficulties.
Keywords: Neurocognitive disorder, Clock Test, screening, older adult.
RESUMEN
Introducción. El Test del Dibujo del Reloj (TDR) es un instrumento ampliamente utilizado para identificar trastornos neurocognitivos (TNC) en adultos mayores. Sin embargo, no existe suficiente evidencia para de-terminar el mejor método para calificarlo, ya que los métodos cuantitativos actuales se abocan a la asigna-ción de valores numéricos, mientras que los cualitativos no permiten objetividad en el diagnóstico. Parsey y Schmitter-Edgecombe (2011) propusieron un método de calificación que, además de proporcionar un puntaje de la ejecución del paciente, permite el análisis de los errores y, con ello, la identificación de las potenciales dificultades cognitivas subyacentes. Objetivo. El objetivo de este estudio fue validar el método de calificación del TDR propuesto por Parsey y Schmitter-Edgecombe (2011) para el tamizaje del TNC en adultos mayores mexicanos. Método. Se contó con 167 participantes: 58 cognitivamente sanos (CS), 52 con trastorno neuro-cognitivo leve (TNC-leve) y 57 con trastorno neuroneuro-cognitivo mayor (TNC-mayor). El método de calificación del TDR se comparó con el Examen Mínimo del Estado Mental (MMSE) y la Evaluación Cognitiva de Montreal en español (MoCA-E). Se determinó la confiabilidad inter e intra-observador y la validez de constructo, y se calcularon la sensibilidad y la especificidad de este método. Resultados. La de edad fue de 75 años (DE ± 8 años) y la de escolaridad fue de 10.7 años (DE ± 5.2 años). La confiabilidad interna fue de .750, con un coeficiente de correlación intraclase de .774. El punto de corte para el TDR en TNC-leve fue de 14 puntos (sen-sibilidad: 40%, especificidad: 70%) y 12 puntos para TNC-mayor (sen(sen-sibilidad: 90%, especificidad: 95%). Los errores más frecuentes en el TDR fueron: dificultades gráficas, conceptuales y espaciales, y/o de planeación. Discusión y conclusión. Este método permite explorar breve y ágilmente el estado cognitivo del paciente y posee propiedades psicométricas ideales para la detección de pacientes con TNC-mayor, además de ofrecer la posibilidad de analizar los errores que presentan en el desempeño y las dificultades cognitivas subyacentes.
Palabras clave: Trastorno neurocognitivo, Test del Dibujo del Reloj, tamizaje, adulto mayor. 1 Servicio de Geriatría, Instituto
Na-cional de Ciencias Médicas y Nu-trición Salvador Zubirán, Ciudad de México, México.
2 Departamento de Neurología y Psiquiatría, Instituto Nacional de Ciencias Médicas y Nutrición Sal-vador Zubirán, Ciudad de México, México.
3 Le Centre de Recherche Inserm-Uni-versité de Bordeaux U1219, UMR 1219, F-33000, Bordeaux, France. Correspondence:
Sara G. Aguilar-Navarro
Servicio de Geriatría, Instituto Nacio-nal de Ciencias Médicas y Nutrición Salvador Zubirán.
Vasco de Quiroga 15, Belisario Domínguez Sección XVI, C.P. 14080, Tlalpan, Ciudad de México, México. Phone: +52 (55) 5487 - 0900, ext. 5710
Email: [email protected] Received: 25 March 2018 Accepted: 19 July 2018 Citation:
Aguilar-Navarro, S. G., Mimen-za-Alvarado, A. J., Samudio-Cruz, M. A., Hernández-Contreras, F. J., Gutiérrez-Gutiérrez, L. A., Ramírez-González, F., & Avila-Funes, J. A. (2018). Validation of the Clock Drawing Test Scoring Method in older adults with neurocognitive disorder.
INTRODUCTION
Mild and major neurocognitive disorders (mild-NCD and major-NCD) (American Psychiatric Association, 2014) are nosological conditions characterized by alterations in the functioning of one or more cognitive domains with respect to the previous level. In the case of major-NCD, this alter-ation affects functional independence. Nowadays, both are worldwide public health problems due to their increasing prevalence resulting from the phenomenon of population aging (He, Goodkind, & Kowal, 2016; National Institute of Statistics and Geography, 2015). According to Alzhei-mer’s Disease International (2015), 46.8 million people around the world present an NCD. Moreover, an increase of up to 131.5 million has been projected for 2050 (Prince et al., 2015). At the same time, it is known that an individual with mild-NCD is ten times more likely to progress to ma-jor-NCD than an individual with the same characteristics, but without mild-NCD. These data emphasize the need for evaluation instruments that allow for the timely identifica-tion of older adults with signs or symptoms of a particular NCD (Petersen et al., 2014).
One of the most widely used instruments for the detec-tion of NCDs is the Clock Drawing Test (CDT), because it is a brief test that permits the exploration of a wide range of cognitive processes including: attention, understanding of instructions, planning, visuospatial ability, visual con-struction, programming and graphomotor performance, nu-merical knowledge, abstract thinking, symbolic represen-tation, and semantic memory (Blair, Kertesz, McMonagle, Davidson, & Bodi, 2006; Cacho-Gutiérrez, García-García, Arcaya-Navarro, Vicente-Villardón, & Lantada-Puebla, 1999; Freedman, 1994; Hubbard et al., 2008; Shulman, Shedletsky, & Silver, 1986).
Given the boom it has enjoyed as a screening test for the identification and assessment of NCDs, numerous methods have been proposed for its application and scor-ing, some of which seek to quantify the scores obtained by the patient (Blair et al., 2006; Cacho-Gutiérrez et al., 1999; Freedman, 1994; Hubbard et al., 2008; Shulman et al., 1986), while others attempt to analyze the type of per-formance they present (Parsey & Schmitter-Edgecombe, 2011; Rouleau, Salmon, Butters, Kennedy, & McGuire, 1992). Although the quantitative methods used to score the Clock Drawing Test are extremely useful due to the objec-tivity and practicality of counting right and wrong answers when performing the task, most of them do not allow for the analysis of characteristics in the performance of each phase of NCDs.
At the same time, although the qualitative methods proposed to date to analyze the clock drawing facilitate the detection of specific features in the performance of patients, they lack systematization and objectivity, which creates ambiguity in the results and subjectivity in the
interpretation. The review by Pinto and Peters (2009)
showed that using both approaches (qualitative and quan-titative) improves the identification of NCDs in compar-ison with the use of each method separately. Parsey and Schmitter-Edgecombe (2011) proposed a quantitative scoring method based on the qualitative criteria of Rou-leau et al. (1992), which considers six error categories: 1. size, 2. graphic difficulties, 3. stimulus-dependent re-sponses, 4. conceptual deficits, 5. spatial/planning deficits, and 6. perseverations. On the basis of these criteria, they were scored on a scale of 0 to 16 points. A cut-off point of 11 points was determined for major-NCD, 12-13 points for mild-NCD, and 14 points for cognitively normal re-spondents. In addition, a qualitative analysis revealed that the most frequent errors across the three groups were: con-ceptual, graphic, and spatial/planning difficulties. On the basis of these findings, it was determined that, in addition to the quantitative evaluation that provides scores and cut-off points, qualitative analysis can enhance the sensitivity of the CDT, specifically to distinguish between mild-NCD and normal cognition.
Accordingly, the purpose of this study was to validate the CDT scoring method proposed by Parsey and Schmit-ter-Edgecombe (2011) for screening NCD in Mexican older adults.
METHOD
Study design
This retrospective diagnostic accuracy study was conducted between July, 2016 and July, 2017 at the Memory Clinic of a university tertiary care hospital in Mexico City.
Participants
We invited men and women over 65 who agreed to partic-ipate, after signing an informed consent form. The sample was estimated with the aim of studying diagnostic perfor-mance and validation to find a moderate to high correla-tion between the Mini-Mental State Examinacorrela-tion (MMSE) (Folstein, Folstein, & McHugh, 1975), the Montreal Cog-nitive Assessment-Spanish (MoCA-S) (Delgado, Araneda, & Behrens, 2017), and the CDT scoring method proposed by Parsey and Schmitter-Edgecombe (2011), with an er-ror of α = 5% and a power of 80%. At least 51 subjects were required per group (51 cognitively healthy individ-uals [CH], 51 with mild-NCD and 51 with major-NCD). For test-retest reliability and intra- and inter-observer re-liability, a sample of at least 23 subjects per group was estimated.
Neuro-logical and Communicative Disorders and Stroke and the Alzheimer’s Disease and Related Disorders Association (NINCDS/ADRDA) (McKhann et al., 1984), and the cri-teria of the Diagnostic and Statistical Manual of Mental Disorders, version 5 (DSM-5) (American Psychiatric As-sociation, 2014) and the Clinical Dementia Rating (CDR) (Hughes, Berg, Danziger, Coben, & Martin, 1982), making it possible to classify participants into: cognitively healthy subjects (category 0), subjects with mild-NCD (category .5), and subjects with major-NCD (≥ 1). The Brief Neu-ropsychological Assessment in Spanish (NEUROPSI) (Ostrosky, Ardila, & Rosselli, 1999) was used for the eval-uation of the cognitive sphere. This test, standardized by age and educational attainment in the Mexican population, makes it possible to explore six cognitive processes (orien-tation, attention, memory, language, reading and writing, and executive functions). It was considered that subjects who scored ≤ 1.5 standard deviations (SD) in NEUROP-SI met the criterion for mild-NCD, while those with ≤ 2 SD fulfilled the criterion for major-NCD. Functional status was evaluated using the Katz index (score of 0-6 where higher scores indicate greater independence for basic ac-tivities of daily living, BADL) (Katz, Downs, Cash, & Grotz, 1970) and the Lawton and Brody Index (score of 0-8 points, where higher scores indicate greater independence for the instrumental activities of daily living, IADL) ( Law-ton & Brody, 1969). Likewise, the informant’s report was evaluated through the B-ADL (Bayer Activities of Daily Living Scale), an instrument comprising 25 items, which evaluates activities with high and low cognitive demand (Sánchez-Benavides et al., 2009). A score above 3.3 is in-dicative of functional impact in major-NCD (sensitivity: .81, specificity: .72).
Exclusion criteria were participants who were: illiter-ate; with severe visual or auditory deficit; with the presence of severe or uncontrolled neurological, toxic, metabolic, in-fectious, or vascular diseases; psychiatric disorders such as untreated or uncontrolled depression and/or schizophrenia; heart, liver or kidney diseases, cancer, or any other type of uncontrolled systemic disease; and/or motor alterations that hinder the application of cognitive tests.
Measurements
A geriatric interview was conducted in which general data were obtained: age, sex, and educational attainment. Sub-sequently, a cognitive evaluation was performed, consist-ing of the application of the followconsist-ing instruments: MMSE (Mini-Mental State Examination) (Folstein et al., 1975). The maximum score is 30 points; the cut-off point for ma-jor-NCD is 24 points (sensitivity: 91%, specificity: 38%); the cut-off point < 26 for mild-NCD (sensitivity 92%, spec-ificity: 42%), and MoCA-S (Aguilar et al., 2017), the Span-ish version, validated in Mexican population; total score 30
points, cut-off point for major-NCD:24 (sensitivity 98%, specificity 93%); for mild-NCD with a cut-off point of 26 (sensitivity 80%, specificity 75%).
The CDT was scored based on the scoring method pro-posed by Parsey and Schmitter-Edgecombe (2011), using a version translated into Spanish by a certified translator, and subsequently reviewed and approved by an expert commit-tee (Table 1).
Procedures
The subjects performed the CDT as part of the cognitive evaluation. All participants were given an 8.5 x 11-in blank sheet and instructed to do the following:
“Draw the clock face, put in all the numbers and set the hands for 10 after 11,” If necessary, the full instructions were repeated one more time.
The CDT was rated according to the quantitative and qualitative method proposed by Parsey and Schmit-ter-Edgecombe (2011), which analyzes six categories: 1. size, 2. graphic difficulties, 3. stimulus-dependent re-sponses, 4. conceptual deficits, 5. spatial/planning deficits, and 6. perseverations.
To obtain inter-observer reliability, two previously trained assessors (MASC and FRG), blind to each other, scored 23 clocks from each group, randomly selected using the adapted criteria. For intra-observer reliability, the evalu-ators scored the 23 clocks in each group at the beginning of the study and three months later.
Statistical analysis
The content validity of the instrument had been previously established by Parsey and Schmitter-Edgecombe (2011). In this study, due to the categorical nature of the items, the val-idation process was performed with non-parametric tests. The Spearman correlation coefficient was used to determine construct validity (convergence) when comparing the total score and each of the errors analyzed in the CDT with the applied cognitive tests (MMSE and MoCA-S).One factor analysis of variance (ANOVA) was undertaken, together with the Post Hoc DSM test to identify differences between the groups in the types of errors.
The kappa coefficient was obtained from the total score to analyze inter-rater reliability. The internal consistency of the test was determined in both raters using Cronbach’s alpha coefficient. The Receiver Operating Characteristics (ROC) curve was constructed and the area under the curve was calculated to estimate sensitivity and specificity and es-tablish cut-off points and 95% confidence intervals.
Ethical considerations
All participants signed an informed consent form before taking part in the study. The protocol was presented and ap-proved by the local institutional ethics committee.
RESULTS
A total of 167 older adults were included (76% female, average age:75 [SD = ± 8], range 60-90 years, average educational attainment: 10.7 years [SD ± 5.2], range 0-2 2 years), 58 cognitively healthy subjects (CH, average age: 69.91 [SD ± 7.1]; average educational attainment: 12.4 [SD ± 3.8)]), 52 subjects with mild-NCD (average
age:75.15 [SD ± 6.2]; average educational attainment: 10.2 [SD ± 5.6]), and 57 subjects with mild-NCD (average age: 81.8 [SD ± 5.9]; average educational attainment: 9.6 [SD ± 5.8]).
Regarding the cognitive sphere, scores were lower in the group with major-NCD, with statistically significant differences across all tasks, except for register and read-ing comprehension, compared with the CH and mild-NCD group. It was observed that the three groups differed in the overall scores of the MMSE, MoCA-S and CDT, and in the domains of temporo-spatial orientation, deferred recall, language block, and copying pentagons, whereas in exec-utive function tasks, the group with major-NCD had the lowest score, followed by the group with mild-NCD and the CH group. (Table 2)
Table 1
Version translated into Spanish: CDT rating register proposed by Parsey & Schmitter-Edgecombe (2011)
Type of error Errors Points
Clock size Small: less than 1.5 inches (3.8 cm) in diameter 1
Large: more than 5 inches (12.7 cm) in diameter 1 Graphic difficulties
Inaccurate lines with distortions of the face or
numbers that are hard to read. Mild: some distortions of the clock face and/or hands and/or num-bers. Overall performance was adequate. 1 Hands that are not straight and do not
con-nect in the center of the clock. Moderate: obvious distortions, but overall performance is still in-terpretable. 2 General performance seems inaccurate or
clumsy. Serious: Obvious, severe distortions, which may result in a non-in-terpretable drawing. 3 Responses related to stimuli
The tendency of the drawing dominated or
guided by a single stimulus. The time is written with letters or numbers, near or next to the num-bers 11 and 10. 1 Hands point to the numbers “11” and “10” or absence of hands. 1 Conceptual deficits
Errors reflect a loss/deficit in accessing knowledge of the attributes, characteristics and meaning of a clock.
Poor representation of the clock (clock without numbers or missing the outer circle, outline of the clock). 1 Poor representation of time (hands missing or poorly represented, incorrect length of hands or both hands have the same length, time written with letters or numbers on the clock).
1
Numbers missing or in the wrong order (the sequence begins with “1” in the position of “12”, the sequence of numbers ends before or does not reach 12, numbers missing in the sequence).
1
Spatial and planning difficulties
Deficits in the distribution of numbers on the
clock face. Neglect of left hemispace (numbers only placed in right hemifield).Difficulty planning, with large spaces before numbers 12, 3, 6, or 9. 11 Difficulty in the spatial distribution of numbers, without any specific
pattern, disorganization. 1
Numbers written outside the clock face, or numbers written on the
circumference of the clock. 1
Numbers written in the opposite direction to the clock. 1 Perseveration
Continuation or repetition of the activity
with-out proper stimulus. Perseveration of hands more than 2 hands.Perseveration of numbers: abnormal prolongation of numbers (e.g. 1 numbers beyond number 12, or repetition of numbers). 1
In terms of functionality, as expected, the major-NCD group obtained the lowest score in a statistically significant way with respect to the mild-NCD and CH group; likewise, the NCD group had less functionality in comparison with the CH group (Table 2).
The internal consistency of the method used in this study to rate the CDT was α = .750. The test-retest correla-tion had an r = .637 (p < .001) and an intraclass correlation coefficient (ICC) of .774 (95% CI [.47, .90]; p < .001). In-ter-observer correlation was .988 with a ICC = .993 (95% CI [.99, .99]; p < .001).
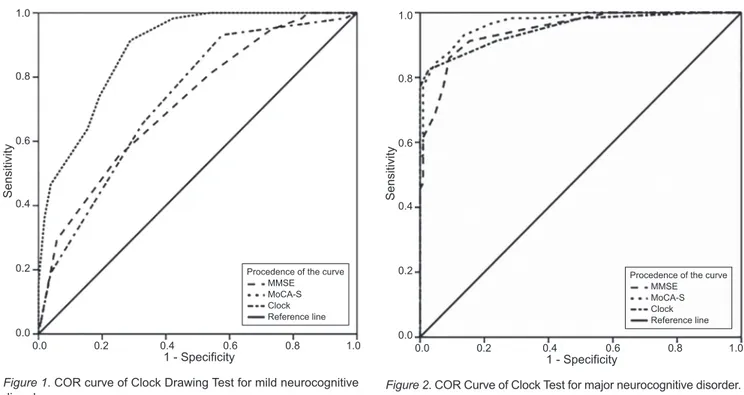
The area under the curve of the CDT rating method was .600 (95% CI [.511, .679]; p < .001), with a sensitivity of 40% and a specificity of 70% for the diagnosis of mild-NCD with a cut-off point of 14 points. For major-mild-NCD with a cut-off point of 12 points, sensitivity was 90% and speci-ficity 95% (Figures 1 and 2).
The analysis of the total score of the CDT showed sta-tistically significant differences between the groups, with the CH group obtaining a higher score superior ( = 14.8, SD ± .9) in comparison with the group with mild-NCD ( = 13.9, SD ± .9; 95% CI [.5, 1.3]; p < .001) and the group with major-NCD ( = 9.3, SD ± 2.9; 95% CI [4.6, 6.5]; p ≤ .001). The analysis showed moderate to strong positive associations between the score of the quantitative scoring method and the MMSE (r = .63) and the MoCA-S (r = .74), as well as moderate negative associations between each type of error and the scores in the MMSE and MoCA-S,
showing the high convergence between these instruments. (Table 3).
Finally, it was found that there were statistically signif-icant differences among the three groups in all the errors, except in the section that measures responses linked to stim-uli, of which the group with major-NCD had more errors than the group with mild-NCD. This group had a higher frequency of conceptual errors (93%), followed by spatial/ planning difficulties (89.5%) and a greater number of errors in graphic difficulties in relation to the CH group (42.4% and 67.3% respectively p < .001) (Table 4).
DISCUSSION AND CONCLUSION
This study showed that the combined quantitative and qual-itative method proposed by Parsey and Schmitter-Edge-combe (2011) for the CDT is valid and reliable, and could therefore represent an excellent alternative for the detection of mild-NCD and major-NCD in Mexicans. The internal consistency of this method was .750 and its temporal stabil-ity was corroborated, since the test-retest and inter-observer results obtained a reliability (concordance or reproducibil-ity) of .774. These results indicate that, despite the subjec-tivity entailed by scoring on the basis of qualitative criteria, this method is accurate, regardless of the scorer.
It was also observed that this method has satisfactory psychometric properties to detect major-NCD with a cut-off
Table 2
Sociodemographic characteristics, cognitive and functional performance across groups CH
(n = 58) Mild-NCD(n = 52) Major-NCD(n = 57) F gl p Sociodemographic variables
Agea,b,c 69.91 (7.1) 75.15 (6.2) 81.8 (5.9) 48.92 2, 164 < .001 Educational attainmenta,b 12.4 (3.8) 10.1 (5.6) 9.6 (5.8) 4.98 2, 164 .008 Cognitive assessment
MMSEa,b,c 28.6 (1.2) 27.1 (2.1) 20.4 (4.7) 110.92 2, 164 < .001 MoCA-Sa,b,c 27.3 (2) 22.9 (2.9) 13.7 (4.9) 218.48 2, 164 < .001 CDTa,b,c 14.8 (.9) 13.9 (.9) 9.3 (2.9) 147.86 2, 164 < .001 Functional assessment
BDLA Functionalitya,b,c 5.78 (.421) 5.40 (.74) 5.05 (1.18) 10.50 2, 164 < .001 IDLA Functionalitya,b,c 7.81 (.54) 6.65 (1.7) 2.67 (2.15) 154.92 2, 164 < .001 Informant’s report
B-ADLa,b,c 1.4 (.3) 1.8 (1.8) 7.2 (1.34) 19.38 2, 164 < .001
Note: The data are presented as means and standard deviations. The analysis shows the differences between groups using the ANOVA test, post hoc DSM.
CH = cognitively healthy: Mild-NCD = mild neurocognitive disorder; Major NCD = major neurocognitive disorder; MoCA-S = Montreal Cognitive Assessment-Spanish; MMSE = Mini-Mental State Examination; BADL = Basic Activities of Daily Living; IADL = Instrumental Activities of Daily Living; B-ADL = Bayer Activities of Daily Living Scale- corroborated by the informant.
Table 3
Correlation between the CDT and the cognitive assessment instruments used in this study (MMSE and MoCA-S)
Total score Clock size difficultiesGraphic linked to stimuliResponses Conceptual difficulties planning difficultiesSpatial and/or Perseverations
MMSE -.23* -.48* -.44* -.58* -.54* -.45* -.63*
MoCA-S -.35* -.50* -.49* -.65* -.62* -.49* -.74*
Note: MMSE = Mini-Mental State Examination; MoCA-S = Montreal Cognitive Assessment-Spanish. *Significant correlation, p < .01.
Table 4
Errors in the CDT in groups studied
CH
(n = 58) Mild-NCD(n = 52) Major-NCD(n = 57) p Clock sizea,b,c 9 (15.8%) 15 (28.8%) 33 (57.9%) < .001 Graphic difficultiesa,b,c 25 (42.4%) 35 (67.3%) 49 (86.0%) < .001
Slight 25 (42.4%) 35 (67.3%) 20 (35.1%)
Moderate 0 (0%) 0 (0%) 20 (35.1%)
Severe 0 (0%) 0 (0%) 9 (15.8%)
Responses linked to stimulib,c 6 (10.2%) 5 (9.2%) 31 (54.4%) < .001 Conceptual difficultiesa,b,c 13 (22.0%) 21 (40.4%) 53 (93.0%) < .001 Spatial and/or planning difficultiesa,b,c 17 (28.8%) 25 (48.1%) 51 (89.5%) < .001 Perseverationsa,b,c 2 (3.4%) 5 (9.6%) 30 (52.8%) < .001 Total errorsa,b,c 1.22 (.9) 2.10 (.9) 6.74 (2.9) < .001
Note: The data present the frequency and percentage of participants in the group that made each type of error.
CH = cognitively healthy; Mild-NCD = Mild Neurocognitive Disorder; Major-NCD = Major Neurocognitive Disorder; asignificant difference between CH and mild-NCD p ≤ .001;
bsignificant difference between CH and major-NCD p ≤ .001; csignificant difference between mild-NCD and major-NCD p ≤ .001.
Sensitivity
1.0
0.8
0.6
0.4
0.2
0.0
0.0 0.2 0.4 0.6 0.8 1.0 1 - Specificity
Procedence of the curve MMSE MoCA-S Clock Reference line
Figure 2. COR Curve of Clock Test for major neurocognitive disorder.
Sensitivity
1.0
0.8
0.6
0.4
0.2
0.0
0.0 0.2 0.4 0.6 0.8 1.0 1 - Specificity
Procedence of the curve MMSE MoCA-S Clock Reference line
point of < 12 (sensitivity: 90%, specificity: 95%), where-as for the identification of mild-NCD with a cut-off point < 14, it showed a sensitivity of 40%, and a specificity of 70%.The psychometric properties previously published for the Parsey and Schmitter-Edgecombe (2011) method, with a cut-off point of ≤ 11, were: 57% sensitivity and 100% specificity for the detection of NCD, whereas with a cut-off point of between 12 and 13 for NCD, sensitivity was 39% and specificity 87%. Accordingly, these authors suggest that this method should be complemented by a more complex cognitive evaluation system for mild forms of cognitive im-pairment.
This study also made it possible to identify the de-gree of correlation between the quantitative and qualita-tive evaluation method of the CDT and other cogniqualita-tive assessment tests used for the screening of major-NCD and mild-NCD. Both the total score and the score in each of the types of errors explored in this method showed a high correlation with the tasks evaluated (Freedman & Dexter, 1991).
At the same time, some researchers have said that the CDT is an instrument which, since it does not focus on the assessment of verbal skills like most screening instru-ments (MMSE, MoCA), makes it possible to explore other cognitive functions that are also affected in cases of cog-nitive deficit, such as visuospatial ability and visuocon-structional processes, which facilitates the complementary exploration of these aspects, in which alterations are usu-ally heterogeneous (Ainslie & Murden, 1993; Sunderland et al., 1989).
Regarding the errors identified through the qualitative method criteria, it was found that, as in the study by Parsey and Schmitter-Edgecombe (2011), the most frequent errors across all groups were: graphic, conceptual and spatial, and/ or planning difficulties.
According to these results, the three groups made per-formance errors. However, the complexity and frequency of errors was significantly lower in the CH group than in the others.
Likewise, a high frequency of conceptual errors and graphic difficulties was observed in the major NCD group. Moreover, the group with major-NCD had a higher frequen-cy of errors in all categories than the CH and mild-NCD groups. This is to be expected, given that as cognitive dete-rioration progresses, compensatory cognitive resources and strategies are insufficient for identifying and preventing the occurrence of performance failures (Suchy, Lee, & March-and, 2013).
The quantitative and qualitative scoring method of the CDT is easy to apply and has ideal psychometric proper-ties for the detection of patients with major-NCD. It also offers the possibility of rating alterations in cognitive per-formance, thereby enhancing the characterization, compre-hension, detection, and monitoring of this type of patients.
Limitations
A limitation of the study is the low sensitivity of the meth-od used for screening mild-NCD. It is therefore suggested that these patients be further explored through both error analyses of the performance of the CDT and with more specific complementary tests, which will make it possible to improve the detection and characterization of this type of condition. The effect of educational attainment on the performance of the CDT must also be considered. Sever-al authors have noted that this variable may affect graphic skills and the capacity for abstraction/conceptualization of the clock (Kim & Chey, 2010).
Funding
None.
Conflict of interests
The authors declare that they have no conflict of interests.
REFERENCES
Ainslie, N. K., & Murden, R. A. (1993). Effect of Education on the Clock Drawing
Dementia Screen in Non-Demented Elderly Persons. Journal of the American Geriatrics Society, 41(3), 249-252.
Aguilar-Navarro, S. G., Mimenza-Alvarado, A. J., Palacios-García, A. A., Samu-dio-Cruz, A., Gutiérrez-Gutiérrez, L. A., & Ávila-Funes, J. A. (2017). Validez y
confiabilidad del MoCA (Montreal Cognitive Assessment) para el tamizaje del de -terioro cognoscitivo en México. Revista Colombiana de Psiquiatría, 30(20), 1-7. Alzheimer’s Disease International. (2015). World Alzheimer Report 2015. The Global
Impact of Dementia: An analysis of prevalence, incidence, cost and trends. Alz-heimer’s Disease International, London.
American Psychiatric Association. (2014). Guía de consulta de los criterios diag-nósticos del DSM-5: Spanish Edition of the Desk Reference to the Diagnostic Criteria From DSM-5. American Psychiatric Pub.
Blair, M., Kertesz, A., Mcmonagle, P., Davidson, W., & Bodi, N. (2006). Quantita-tive and qualitaQuantita-tive analyses of clock drawing in frontotemporal dementia and Alzheimer’s disease. Journal of the International Neuropsychological Society,
12(2), 159-165.
Cacho-Gutiérrez, L., García-García, R., Arcaya-Navarro, J., Vicente-Villardón, J., Lantada-Puebla, N. (1999). Una propuesta de aplicación y puntuación del test del reloj en la enfermedad de Alzheimer. Revista de Neurología, 28(7), 648-55. Delgado, C., Araneda, A., & Behrens, M. I. (2017). Validación del instrumento Mon-treal Cognitive Assessment en español en adultos mayores de 60 años. Neu-rología. doi: 10.1016/j.nrl.2017.01.013
Folstein, M. F., Folstein, S. E., & McHugh, P. R. (1975). “Mini-mental state”: a prac-tical method for grading the cognitive state of patients for the clinician. Journal of Psychiatric Research, 12(3), 189-198.
Freedman, L. & Dexter, L. E. (1991). Visuospatial ability in cortical dementia. Jour-nal of Clinical and Experimental Neuropsychology, 13(5), 677-690. Freedman, M. (1994). Clock drawing a neuropsychological analysis. New York:
Ox-ford University Press.
He, W., Goodkind, D., & Kowal, P. (2016). An Aging World., Washington, DC: U. S.
Government Publishing Office.
Hubbard, E. J., Santini, V., Blankevoort, C. G., Volkers, K. M., Barrup, M. S., Byerly, L., ... Stern, R. A. (2008). Clock drawing performance in cognitively normal elderly. Archives of Clinical Neuropsychology, 23(3), 295-327.
Katz, S., Downs, T. D., Cash, H. R., & Grotz, R. C. (1970). Progress in development of the Index of A.D.L. The Gerontologist, 1, 20-30.
Kim, H. & Chey, J. (2010). Effects of education, literacy, and dementia on the Clock
Drawing Test performance. Journal of the International Neuropsychological Society, 16(6), 1138-1146.
Lawton, M. P. & Brody, E. M. (1969). Assesment of older people: self maintaining and instrumental activities of daily living. Gerontologist, 9(3-1), 179-186. McKhann, G., Drachman, D., Folstein, M., Katzman, R., Price, D., & Stadian, E.
(1984). Clinical diagnosis of Alzheimer’s disease. Report of the NINCDS-ADRDA work Group under the auspices of Department of Health and Hu-man Services Task Force on Alzheimer’s Disease. Neurology, 34(7), 939-944.
Ostrosky, F., Ardila, A., & Rosselli, M. (1999). Evaluación Neuropsicológica breve en Español. NEUROPSI. México: Publingenio.
Parsey, C. M. & Schmitter-Edgecombe, M. (2011). Quantitative and qualitative anal-yses of the clock drawing test in mild cognitive impairment and Alzheimer
dis-ease: evaluation of a modified scoring system. Journal of Geriatric Psychiatry and Neurology, 24(2), 108-118.
Petersen, R. C., Caracciolo, B. C., Brayne, S., Gauthier, V., Jelic, L., & Fratiglioni. (2014). Mild cognitive impairment: a concept in evolution. Journal of Internal Medicine, 275(3), 214-228.
Pinto, E. & Peters, R. (2009). Literature review of the Clock Drawing Test as a tool for cognitive screening. Dementia and Geriatric Cognitive Disorders, 27(3), 201-213.
Prince, M., Wimo, A., Guerchet, M., Ali, G. C., Wu, Y. T., & Prina, M. (2015). World alzheimer report 2015: the global impact of dementia. An analysis of preva-lence, incidence, cost and trends. London: Alzheimer’s Disease International. Rouleau, I., Salmon, D. P., Butters, N., Kennedy, C., & McGuire, K. (1992).
Quanti-tative and qualiQuanti-tative analyses of clock drawings in Alzheimer’s and Hunting-ton’s disease. Brain and Cognition, 18(1), 70-87.
Sánchez-Benavides, G., Manero, R. M., Quinones-Ubeda, S., De Sola, S., Quintana, M., & Pena-Casanova, J. (2009). Spanish version of the Bayer Activities of Daily Living scale in mild cognitive impairment and mild Alzheimer disease: discriminant and concurrent validity. Dementia and Geriatric Cognitive Disor-ders, 27(6), 572-578.
Shulman, K. I., Shedletsky, R., & Silver, I. L. (1986). The challenge of time: clock-drawing and cognitive function in the elderly. International journal of geriatric psychiatry, 1(2), 135-140.
Suchy, Y., Lee, J., & Marchand, W. (2013). Aberrant cortico–subcortical functional connectivity among women with por motor control: Toward uncovering the sub-strate of hyperkinetic perseveration. Neuropsychologia, 51(2013), 2130-2141. Sunderland, T., Hill, J. L., Mellow, A. M., Lawlor, B. A., Gundersheimer, J.,
New-house, P. A., & Grafman, J. H. (1989). Clock drawing in Alzheimer’s disease.