© 2007 Museu de Ciències Naturals ISSN: 1578–665X
García, A., Solano–Rodríguez, H. & Flores–Villela, O., 2007. Patterns of alpha, beta and gamma diversity of the herpetofauna in Mexico's Pacific lowlands and adjacent interior valleys. Animal Biodiversity and Conservation, 30.2: 169–177.
Abstract
Patterns of alpha, beta and gamma diversity of the herpetofauna in Mexico’s Pacific lowlands and adjacent interior valleys.— The latitudinal distribution patterns of alpha, beta and gamma diversity of reptiles, amphibians and herpetofauna were analyzed using individual binary models of potential distribution for 301 species predicted by ecological modelling for a grid of 9,932 quadrants of ~25 km2 each. We arranged quadrants in 312 latitudinal bands in which alpha, beta and gamma values were determined. Latitudinal trends of all scales of diversity were similar in all groups. Alpha and gamma responded inversely to latitude whereas beta showed a high latitudinal fluctuation due to the high number of endemic species. Alpha and gamma showed a strong correlation in all groups. Beta diversity is an important component of the herpetofauna distribution patterns as a continuous source of species diversity throughout the region. Key words: Latitudinal distribution pattern, Diversity scales, Herpetofauna, Western Mexico.
Resumen
Patrones de diversidad alfa, beta y gama de la herpetofauna de las tierras bajas y valles adyacentes del Pacífico de México.— Se analizaron los patrones de distribución latitudinales de la diversidad alfa, beta y gama de los reptiles, anfibios y herpetofauna utilizando modelos binarios individuales de distribución potencial de 301 especies predichas mediante un modelo ecológico para una cuadrícula de 9.932 cuadrantes de aproximadamente 25 km2 cada uno. Se organizaron los cuadrantes en 312 bandas latitudinales para las cuales se determinaron los valores de alfa, beta y gama. Las tendencias latitudinales de todas las escalas de diversidad eran similares en todos los grupos. Alfa y gama respondieron inversamente a la latitud mientras que beta registró una gran fluctuación latitudinal debida al alto número de especies endémicas. Alfa y gama mostraron una fuerte correlación en todos los grupos. La diversidad beta es un componente importante de los patrones de distribución de la herpetofauna como una fuente constante de diversidad de especies a lo largo de la región.
Palabras clave: Patrón latitudinal de distribución, Escalas de diversidad, Herpetofauna, Oeste de México. (Received: 7 III 07; Conditional acceptance: 14 V 07; Final acceptance: 25 VI 07)
A. García, Estación de Biología Chamela, Inst. de Biología, Univ. Nacional Autónoma de México, Apdo. Postal 21, San Patricio Melaque, 48980 Jalisco, México.– H. Solano–Rodríguez, Fac. de Ciencias, Univ. de Colima, 28045, Colima, México.– O. Flores–Villela, Museo de Zoología, Fac. de Ciencias, Univ. Nacional Autónoma de México. Apdo. Postal 70–399, México D. F. 04510, México.
Corresponding author: A. García. E–mail: [email protected]
Patterns of alpha, beta and gamma
diversity of the herpetofauna in
Mexico’s Pacific lowlands and
adjacent interior valleys
Introduction
Mexico is one of the richest countries in the world in herpetofauna, with about 1,165 reptile and am-phibian species (Flores–Villela & Canseco– Márquez, 2004). It is one of the 17 megadiverse countries that jointly account for more than two thirds of the earth’s plant and animal diversity (Mittermeier et al., 1988; Ramamoorthy et al., 1993; Sánchez–Cordero et al., 2005 among oth-ers). The distribution of Mexican herpetofauna is not homogeneous. The highest number of reptile and amphibian species and endemics are found in two regions, Central Mexico and Western Mexico (Flores–Villela, 1993a, 1993b; Flores–Villela & Goyenechea, 2003; Garcia, 2003, 2006). Western Mexico and specifically the Pacific lowlands and adjacent interior valleys are home to almost a third of the Mexican herpetofauna species and a fourth of the endemic species (Flores–Villela & Goyenechea, 2003; García, 2006; Ochoa–Ochoa & Flores–Villela, 2006). Previous studies on the diversity and distribution of plant and terrestrial animal species rank this region as one of the most diverse in Mexico both in species richness and endemics (Ramamoorthy et al., 1993; Bojorquez– Tapia et al., 1995; Ceballos & García, 1995; García–Trejo & Navarro, 2004).
Seasonal tropical dry forest is the dominant vegetation type in the Mexican Pacific lowlands and adjacent interior valleys (Trejo–Vazquez & Dirzo, 2000; García, 2006). Despite its importance for Mexican biodiversity conservation, such forest is at high risk since it has the second highest annual deforestation rate (2%) in Mexico, and only 27% of the original forest remains intact (Trejo– Vazquez & Dirzo, 2000; Trejo–Vazquez, 2005; García, 2006). Disappearance of this ecosystem and its associated vegetation types places Mexi-can biodiversity at risk of extinction (Ramamoorthy, et al., 1993; Sarukhán & Dirzo, 1995; Trejo– Vazquez, 2005; García, 2006). Several studies have established conservation strategies for the Mexican herpetofauna at both national and re-gional levels based on the distributional patterns of species richness, endemism and endangerment. In some cases ecological modelling has been used as a tool to determine such patterns (e.g. Flores–Villela, 1993b; Garcia, 2006; Ochoa–Ochoa & Flores–Villela, 2006). In the specific case of tropical dry forest in the Mexican Pacific lowlands and adjacent interior valleys, conservation strate-gies for the associated herpetofauna and other fauna have included the establishment of a net of protected areas. These incorporate new reserves with those already established, prioritizing areas that are unique in terms of species turn–over or habitat quality (Sonora and Sinaloa: García, 2006) and also those with high diversity (e.g. in Jalisco, Michoacán and Oaxaca).
Recently, beta diversity or species turnover has received attention as an important compo-nent of the diversity patterns of Mexican
mam-mals, especially for terrestrial species (Rodriguez et al., 2003), birds (García–Trejo & Navarro, 2004), flowering plants (Trejo–Vazquez, 2005) and the herpetofauna in general (Flores–Villela et al., 2005). Analysis of the herpetofauna found no correlation between beta diversity and species richness or endemism, though this may have been influenced by an insufficient inventory effort and an incomplete database for the study area (Flores–Villela et al., 2005). Ecological modelling has been proposed as a tool to determine spatial patterns of diversity for those areas with inad-equate inventory efforts due to time and financial constraints (e.g. Bojorquez–Tapia et al., 1995; Illoldi–Rangel et al., 2004; Sánchez–Cordero & Martínez–Meyer, 2000; Peterson et al., 2002; Midgley et al., 2003; Peterson & Kluza, 2003; Ortega–Huerta & Peterson, 2004; García, 2006; Ochoa–Ochoa & Flores–Villela, 2006).
This study presents the latitudinal distribution patterns of alpha, beta and gamma diversity of the herpetofauna in México’s Pacific lowlands and adjacent interior valleys of México using ecological modelling. The correlation of poten-tial patterns of different diversity scales among reptiles, amphibians and latitude was analysed. We u s e d i n d i v i d u a l b i n a r y m o d e l s o f t h e herpetofauna species’ potential distributions pre-dicted by GARP (Generic Algorithm for Rule set Prediction – Stockwell & Peters, 1999) produced in a previous work in the same study area (García, 2006).
Material and methods
A previous study reported 301 herptile species in the study area (63 amphibians and 238 reptiles; see Appendix I, in García, 2006). The authors used a data base that included 29,271 species locality records to produce 267 individual binary models of species potential distributions predicted by GARP using a grid covering the total surface of the study area, with 9932 quadrants of ~25 km2 each (or 0.05 x 0.05 degrees pixel size). Details regarding how the database and GARP binary models were constructed can be consulted in García (2006). In this paper we used the same grid and binary models to determine species com-position and richness for each quadrant in order to determine the latitudinal gradient of alpha, beta and gamma diversity for reptiles, amphibians and herpetofauna in the study area. For 34 herpetile species there was insufficient data to run a binary model of potential distribution. We therefore sim-ply assigned their locality records into the corre-sponding quadrants (these species are identified in Appendix I, of García, 2006).
The analysis of latitudinal patterns at different scales of diversity is based on the shape and latitudinal extension of the study area (~15.025° to 30.075° degrees of latitude north). We ar-ranged each of the 9,932 quadrants in 302 latitu-dinal bands of 0.05 degrees. We used a
latitudi-nal approach to alatitudi-nalyse these patterns due to the considerable latitudinal extension of the region, and its ecological and geological isolation (Ceballos, 1995), in view of which, the area has been considered a biogeographic unit in several studies (e.g. Escalante–Pliego et al., 1993; Fa & Morales, 1993; Flores Villela, 1993a, 1993b; Ceballos & García, 1995; Trejo–Vazquez, 1999; García, 2006). Alpha diversity was determined as the average number of species in each quadrant in a certain latitudinal band, whereas gamma diversity was measured as the total number of species in that band. Beta diversity in each latitu-dinal band was calculated as the coefficient be-tween gamma and alpha diversity as suggested by Rodríguez et al. (2003) as follows:
= S / Swhere S is the species number in each band, S is average alpha in each band based on the values of alpha from those quadrants included within and values could be from 1.0 (without species turn over) to S
.The relationship between alpha, beta and gamma with the latitudinal gradient of species richness was analyzed by Spearman correlations and linear re-gressions (Rodríguez et al., 2003).
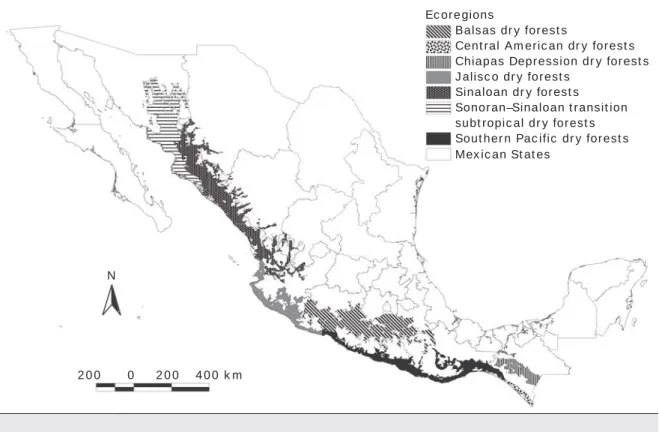
Ecoregions
Balsas dry forests
Central American dry forests Chiapas Depression dry forests Jalisco dry forests
Sinaloan dry forests Sonoran–Sinaloan transition subtropical dry forests Southern Pacific dry forests Mexican States
N
200 0 200 400 km
Fig. 1. Localisation of tropical dry forest ecoregions within the study area.
Results
Alpha and gamma diversity in reptiles, amphib-ians and herpetofauna have a statistically signifi-cant and negative inverse relationship with lati-tude, whereas beta diversity showed no correla-tion with latitude in any case (table 1). The corre-lation coefficients of alpha and latitude were slightly higher than those of gamma and latitude, except for amphibians. Neither alpha nor gamma diver-sity latitudinal gradients were statistically affected by the number of quadrants or the total surface area within each latitudinal band in any taxonomic group. As suggested by the statistically significant correlation coefficients, however, the number of quadrants had an apparent effect on the latitudinal distribution of beta diversity in both reptiles and herpetofauna.
There were several positive, statistically significant correlations of the different scales of diversity among taxonomic groups, as shown by the cross–group analysis (table 1). Beta diversity in each taxonomic group was statistically significant and correlated posi-tively with the beta diversity of the two other groups. Both alpha and gamma diversity of amphibians were correlated with reptile and herpetofauna alpha and gamma diversity. Herpetofauna gamma diversity was correlated with reptile alpha and gamma diversity, and herpetofauna alpha diversity was correlated with reptile gamma diversity (table 1).
The latitudinal gradient of different scales of diversity in reptiles, amphibians and herpetofauna followed a similar trend (fig. 2). Alpha and gamma diversity tended to decrease with latitude, whereas beta diversity tended to increase towards higher latitudes (about 28°), especially in amphibians. Table 1. Spearman correlation coefficients for different types of diversity for reptiles, amphibians and herpetofauna with respect to latitude and quadrants. Bold numbers indicate statistical significance at P < 0.05: L. Latitude; Q. Quadrants.
Tabla 1. Coeficientes de correlación de Spearman para los diferentes tipos de diversidad de reptiles, anfibios y la herpetofauna con respecto a la latitud y los cuadrantes. Los números en negritas indican una significancia estadística de P < 0,05: L. Latitud; Q. Cuadrante..
Reptiles Amphibians Herpetofauna L Q Alpha Beta Gamma Alpha Beta Gamma Alpha Beta Gamma L 1.00
Q –0.10 1.00 Reptiles
Alpha –0.86 0.19 1.00 Beta 0.04 0.56 –0.22 1.00 Gamma –0.80 0.40 0.86 0.17 1.00 Amphibians
Alpha –0.83 0.07 0.97 –0.28 0.82 1.00 Beta –0.03 0.33 –0.14 0.73 0.18 –0.19 1.00 Gamma –0.84 0.30 0.87 0.11 0.95 0.86 0.21 1.00 Herpetofauna
Alpha –0.86 0.17 1.00 –0.23 0.86 0.98 –0.14 0.88 1.00 Beta 0.06 0.50 –0.24 0.97 0.14 –0.30 0.87 0.10 –0.25 1.00 Gamma –0.82 0.35 0.87 0.14 0.99 0.85 0.20 0.98 0.88 0.12 1.00
Fig. 2. Latitudinal gradient of reptile (A), amphibian (B) and herpetofauna (C) alpha, beta and gamma diversity.
A
B
C
Alpha
Gamma
Beta
1
5.0 15.5 16.0 16.5 17.0 17.5 18.0 18.5 19.0 19.5 20.0 20.5 21.0 21.5 22.0 22.5 23.0 23.5 24.0 24.5 25.0 25.5 26.0 26.5 27.0 27.5 28.0 28.5 29.0 29.5 30.0
Latitude 180
160
140
120
100
80
60
40
20
0
Alpha and Gamma di
ve
rsity
3.5
3
2.5
2
1.5
1
0.5
0
Beta di
ve
rsity
60
50
40
30
20
10
0
1
5.0 15.5 16.0 16.5 17.0 17.5 18.0 18.5 19.0 19.5 20.0 20.5 21.0 21.5 22.0 22.5 23.0 23.5 24.0 24.5 25.0 25.5 26.0 26.5 27.0 27.5 28.0 28.5 29.0 29.5 30.0
Latitude
8
7
6
5
4
3
2
1
0
Alpha and Gamma di
ve
rsity
Beta di
ve
rsity
250
200
150
100
50
0
Alpha and Gamma di
ve
rsity
Beta di
ve
rsity
15.0 15.5 16.0 16.5 17.0 17.5 18.0 18.5 19.0 19.5 20.0 20.5 21.0 21.5 22.0 22.5 23.0 23.5 24.0 24.5 25.0 25.5 26.0 26.5 27.0 27.5 28.0 28.5 29.0 29.5 30.0
Latitude
3.5
3
2.5
2
1.5
1
0.5
According to the regression analysis, both alpha and gamma diversity were influenced by latitude in all groups while beta diversity showed no statisti-cally significant response to latitude (table 2). Both in reptiles and herpetofauna latitude had a slightly greater effect on alpha diversity (72.6% and 73.8% respectively) than on gamma diversity (65.7% and 69.3% respectively). In comparison, in amphibians latitude had a greater effect on gamma diversity than on alpha diversity, although this was less marked. There was practically no response of beta diversity to latitude.
Discussion
Our results show that latitudinal patterns of alpha, beta and gamma diversity of reptiles and amphib-ians in particular, and the herpetofauna in general, followed similar trends at a national level to those observed in other studies for these groups (Flores– Villela et al., 2005), and for terrestrial mammals (Rodríguez et al., 2003). Alpha and gamma diver-sity are correlated and both decreased with lati-tude, whereas beta diversity fluctuates across the latitudinal bands but with no clear latitudinal gradi-ent. A recent analysis of the biogeographic patterns of avian species richness and endemism from west-ern Mexico also reported a lack of latitudinal trend of beta diversity (García–Trejo & Navarro, 2004). The present study found a fluctuating pattern in beta diversity, corresponding to that found for other studies for mammals and the herpetofauna in Mexico (Rodríguez et al., 2003; Flores–Villela et al., 2005), as well as studies reporting a lack of simple gradi-ents in beta diversity (Koleff et al., 2003).
It may be more complex than expected to estab-lish a spatial pattern of beta diversity (e.g. Koleff et al., 2003; Rodríguez et al., 2003), but its influence as an important component of gamma diversity and Mexican biodiversity is well accepted (Rodríguez et al., 2003; García–Trejo & Navarro, 2004; Flores– Villela et al., 2005). The high latitudinal fluctuation of beta diversity across the study area could be explained by the high number of reptile and
am-phibian species, endemic and microendemic (Flores–Villela & Goyenechea, 2003; García, 2006; Ochoa–Ochoa & Flores–Villela, 2006), which result in a constant species turn–over throughout the region, especially at higher latitudes (central coastal Sonora for amphibians). There are two peaks of beta diversity for reptiles and herpetofauna, one in western Jalisco near the border with Nayarit (lati-tude 20.5) and the other in southern Sonora (be-tween 27.0 and 28.0). The occurrence of these two peaks may be due to the poor knowledge of the herpetofauna in these states. A similar trend was found for other northern states, such as Durango that has no published herpetofauna (Flores–Villela et al., 2005; Flores–Villela & Pérez–Mendoza, 2006). The inverse relationship of gamma diversity (spe-cies richness at each latitudinal band) with latitude found in this study is not surprising since the latitudinal decrease of species richness has been reported in a wide variety of organisms (e.g. Fischer, 1960; Simpson, 1964; Schall & Pianka, 1978; Macpherson & Duarte, 1994; Davidowitz & Rosenzweig, 1998; Kaufman & Willing, 1998; Ly-ons & Willing, 1999), as in the particular case of Mexican mammals (Ceballos, 1995; Rodríguez et al., 2003; Vázquez & Gaston 2004) and the herpetofauna (Flores–Villela et al., 2005). The lati-tudinal gradient of gamma diversity estimated in this study showed a similar trend to that recorded in a previous study in the same area. The men-tioned study, however, used latitudinal bands of a larger scale (one degree versus 0.05 degree in this study) and only species locality records were con-sidered (García, 2003).
Alpha diversity was an important component of gamma diversity in all analyzed taxonomic groups (reptiles, amphibians, and herpetofauna) in this study, indicating that a latitudinal increase in gamma diversity could be the result of a similar increment in alpha diversity, as has been suggested for Mexi-can mammals (Rodríguez et al., 2003). The impor-tant relationship between alpha and gamma diver-sity in amphibians and reptiles could also be ex-plained by the high proportion of endemic species in the study area (Flores–Villela, 1993a, 1993b; Table 2. Results of the linear regression of alpha and gamma diversity with latitude in the three groups. All results were statistically significant (P < 0.001), except for beta diversity.
Tabla 2. Resultados de la regresión linear de la diversidad alfa, beta y gama con la latitud en los tres grupos. Todos los resultados, con excepción de la diversidad beta, fueron estadísticamente significativos (P < 0,001).
Reptiles Amphibians Herpetofauna Alpha Beta Gamma Alpha Beta Gamma Alpha Beta Gamma
R–Sq(adj) 72.6 0.08 65.7 73.1 2.9 73.5 73.8 1.1 69.3
Flores–Villela & Goyenechea, 2003; García, 2006) and by the high correlations of the distribution patterns of richness and endemism of the herpetofauna in this region in particular (Flores– Villela & Goyenechea, 2003; García, 2006) and in Mexico in general (Flores–Villela, 1993b; Ochoa– Ochoa & Flores–Villela, 2006).
As we have shown, tropical dry forest is an important ecosystem with high alpha, beta and gamma diversity, and it is also one of the areas of Mexico with a rich herpetofauna as well as high endemism (Flores–Villela, 1993a, 1993b; Flores– Villela & Goyenechea, 2003; García, 2006). Never-theless, this ecosystem once occupied 14% of the vegetation in the country, while today it is at high risk of disappearance, since only 28% of the original forest remains intact today (Trejo–Vazquez, 2005). It has been suggested that the rate of deforestation of this vegetation type is comparable to that of the tropical rain forest; which in the Los Tuxtlas region is 4.2% (Dirzo & García, 1992). Official statistics from the Mexican government estimate the annual defor-estation rate for tropical vegetation at 1.58% (Flores– Martínez, 2002). Recent information for the high Balsas Basin states the annual rate of deforestation at 1.3% (Trejo–Vazquez & Drizo, 2000), indicating the high rates of transformation of tropical dry forest in Mexico. Another factor that worsens the situation is that few areas in this ecosystem are protected. Other published data report the disap-pearance of this vegetation type in some parts of Mexico such as the Central Depression of Chiapas (Trejo–Vazquez, 2005).
Some of the regions where high rates of beta diversity were determined have no protected ar-eas, and in others they are relatively few. Large extensions of territory with relatively high beta diversity with no protected areas include the coastal areas of the states of Nayarit, Colima, Michoacán, as well as large portions of Sinaloa, Guerrero and Oaxaca. In Sonora where two areas of high beta diversity were determined there is only one pro-tected area (Garcia, 2006). The only state where a high representation of tropical dry forest is in protected areas is Chiapas which has two bio-sphere reserves (La Seputura and La Encrucijada). We have no direct information on how the defor-estation rate of tropical dry forest has affected the herpetofauna inhabiting this ecosystem. A recent study in the southern coast of Michoacán compar-ing species richness in tropical dry forests with adjacent natural and human–induced vegetation types have shown the negative effects of defor-estation and habitat transformation in tropical dry forest herpetofauna (Vargas–Santa María & Flores– Villela, 2006). Such study reports that introduced grasslands have the lowest number of amphibian and reptile species in the area (6 spp.), tropical semideciduous forest has 11 species, followed by croplands and orchards with 29 species, and tropi-cal dry forest with 36 species. Trejo–Vazquez (2005) pointed out that only half of all tropical dry forests in Mexico maintain their original arboreal structure
whereas herbs and bushes are the dominant life plant forms in the others. It is likely that such transformation of the vegetation structure of these ecosystems would affect the conservation of asso-ciated herpetofauna.
In conclusion, latitudinal patterns of alpha and gamma diversity of the herpetofauna from the Pa-cific lowlands and adjacent interior valleys of Mexico are strongly correlated probably due to a high proportion of both endemic species to Mexico and species geographically restricted to the study area. Beta diversity is an important component of the herpetofauna distribution patterns as a continuous source of species diversity throughout the region. Tropical dry forest in Mexico faces enormous con-servation problems despite being one of the richest ecosystems. The main threat appears to be defor-estation and there is little information available on the impact of this process on the herpetofauna.
Studies on the effects of deforestation and habi-tat fragmenhabi-tation at different temporal and spatial scales should be promoted 1) to determine patch size and connectivity of remaining intact and dis-turbed tropical dry forest throughout the study area, in relation to hotspots of herpetofauna diversity and endemism and protected areas; and 2) to measure the responses of the reptile and amphibian commu-nity structure to perturbation of tropical dry forest.
Acknowledgements
We would like to thank Leticia Ochoa Ochoa for her constructive comments and assistance during the preparation of this manuscript. Katherine Renton kindly reviewed the manuscript to improve the writ-ten English. We would also like to express our gratitude to the Universidad de Colima for continu-ing to allow the use of their facilities durcontinu-ing the preparation of this manuscript.
References
Bojorquez–Tapia, L. A., Azuara, I., Ezcurra, E. & Flores–Villela, O., 1995. Identifying conservation priorities in Mexico through geographic informa-tion systems and modelling. Ecological Applica-tions, 5: 215–231.
Bullock, S. H., 1986. Climate of Chamela, Jalisco, and trends in the south coastal region of Mexico. Archives for Meteorology Geophysics and Biocli-matology, Series B, 36: 297–316.
Bullock, S. H., Mooney, H. A. & Medina, E. (Eds.), 1995. Seasonal dry tropical forests. Cambridge University Press, Cambridge, UK.
Ceballos, G. 1995. Vertebrate diversity, ecology, and conservation in neotropical dry forests. In: Seasonal dry tropical forests: 195–200 (S. H. Bullock, H. Mooney & E. Medina. Eds.). Cam-bridge University Press, CamCam-bridge, UK. Ceballos, G. & García, A., 1995. Conserving
western Mexico. Conservation Biology, 9: 1349– 1356.
Davidowitz, G. & Rosenzweig, M. L., 1998. The latitudinal gradient of species–diversity among North–American grasshoppers (Acrididae) within a single habitat: a test of the spatial heterogene-ity hypothesis. Journal of Biogeography, 25: 553– 560.
Dirzo, R. & García, M. C., 1992. Rates of deforesta-tion in Los Tuxtlas, Veracruz, Mexico. Conserva-tion Biology, 6: 84–90.
Escalante–Pliego, P., Navarro–Singuensa, A. & Townsend, A. T., 1993. A geographic, ecological, and historical analysis of land bird diversity in Mexico. In: Biological diversity of Mexico: Origin and distribution: 281–307 (T. P. Ramamoorthy, R. Bye, A. Lot & J. Fa, Eds.). Oxford Univ. Press, New York.
Fa, J. E. & Morales, L. M., 1993. Patterns of Mammalian diversity in Mexico. In: Biological diversity of Mexico: Origin and Distribution: 319– 361 (T. P. Ramamoorthy, R. Bye, A. Lot & J. Fa, Eds.). Oxford Univ. Press, New York.
Fischer, A. G., 1960. Latitudinal variation in organic diversity. Evolution, 14: 64–81.
Flores–Martínez, A., 2002. Informe de la situación del medio ambiente en México, compendio de estadísticas ambientales. Secretaría de Medio Ambiente y Recursos Naturales (SEMARNAT), México D.F.
Flores–Villela, O., 1993a. Herpetofauna mexicana. Special Publications Carnegie Museum of Natu-ral History, 17: 1–73.
– 1993b. Herpetofauna of Mexico: distribution and endemism. In: Biological diversity of Mexico: Ori-gin and Distribution: 253–280 (T. P. Ramamoorthy, R. Bye, A. Lot, & J. Fa, Eds.). Oxford Univ. Press, New York.
Flores–Villela, O. & Canseco–Márquez, L., 2004. Nuevas especies y cambios taxonómicos para la herpetofauna de México. Acta Zoológica Mexicana, 20: 115–144.
Flores–Villela, O. & Goyenechea, I., 2003. Patrones de distribución de anfibios y reptiles de Mexico. In: Una perspectiva latinoamericana de la biogeográfía: 289–296 (J. J. Morrone & J. Llorente–Bousquets, Eds.). CONABIO/UNAM, México.
Flores–Villela, O., Ochoa Ochoa, L. & Moreno, C. E., 2005. Variación latitudinal y longitudinal de la riqueza de especies y la diversidad beta de la herpetofauna Mexicana. In: Sobre biodiversidad: el significado de las diversidades alfa, beta y gamma: 143–152 (G. Halffter, J. Soberón, P. Koleff & A. Melic, Eds.). Monografías Tercer Milenio Vol. 4 Sociedad Entomológica Aragonesa, Zaragoza, España.
Flores–Villela, O. & Pérez–Mendoza, H. A., 2006. Herpetofaunas estatales de México. In: Inventarios herpetofaunísticos de México: avances en el conocimiento de su biodiversidad: 327–346 (A. Ramírez–Bautista, L. Canseco–Márquez & F. Mendoza–Quijano, Eds.). Publicaciones de la
Sociedad Herpetológica Mexicana, No. 3. García, A., 2003. Biogeography, ecology and
con-servation of tropical dry forest herpetofauna in western Mexico. Doctoral dissertation, Depart-ment of Biology, University of New Mexico. Albuquerque, NM., USA.
– 2006. Using ecological niche modelling to iden-tify diversity hotspots for the herpetofauna of pacific lowlands and adjacent interior valleys of Mexico. Biological Conservation, 130: 25–46. García–Trejo, E. & Navarro, A. G., 2004. Patrones
biogeográficos de la riqueza de especies y el endemismo de la avifauna en el oeste de México. Acta Zoologica Mexicana (n.s.), 20: 167–185. Illoldi–Rangel, P., Sanchez–Cordero, V. & Peterson,
A. T., 2004. Predicting distributions of Mexican mammals using ecological niche modelling. Jour-nal of Mammalogy, 85: 658–662.
Kaufman, D. M. & Willing, M. R., 1998. Latitudi-nal patterns of mammalian species richness in the New World: the effects of sampling method and faunal group. Journal of Biogeography, 25: 795–805.
Koleff, P., Gaston, J. K. & Lennon, J. J., 2003. Measuring beta diversity for presence–absence data. Journal of Animal Ecology, 72: 367–382. Lyons, S. K. & Willig, M. R., 1999. A hemispheric
assessment of scale dependence in latitudinal gradients of species richness. Ecology, 80: 2483–2491.
Macpherson, E. & Duarte, C. M., 1994. Patterns in species richness, and latitudinal range of Atlan-tic fishes. Ecography, 17: 242–248.
Midgley, G. F., Hannah, L., Millar, D., Thuiller, W. & Booth, A., 2003. Developing regional and spe-cies–level assessments of climate change im-pacts on biodiversity in the Cape Floristic Re-gion. Biological Conservation, 112: 87–97. Mittermeier, R. A., 1988. Primate diversity and the
tropical forest: case studies from Brazil and Madagascar and the importance of megadiversity countries. In: Biodiversity: 145–154 (E. O. Wilson, Ed.). Biodiversity. National Academic Press. Washington D.C.
Murphy, P. G. & Lugo, A. E., 1986. Ecology of tropical dry forest. Annual Review of Ecology and Systematics, 17: 67–88.
Noguera, F., Vega–Rivera, J. H., García–Aldrete, A. N. & Quesada–Avendaño, M. (Eds.), 2002. Historia Natural de Chamela Instituto de Biología, UNAM. México D.F. México.
Ochoa–Ochoa, L. M. & Flores–Villela, O., 2006. Áreas de diversidad y endemismo de la herpetofauna mexicana. UNAM–CONABIO, México.
Ortega–Huerta, M. A. & Peterson, A. T., 2004. Modeling spatial patterns of biodiversity for con-servation prioritization in North–eastern Mexico. Diversity and Distribution, 10: 39–54.
Peterson, A. T. & Kluza, D. A., 2003. New distribu-tional modelling approaches for gap analysis. Animal Conservation, 6: 47–54.
Ramamoorthy, T. P., Bye, R., Lott, A. & Fa, J. (Eds.), 1993. Biological diversity of Mexico: origin and distribution. Oxford Univ. Press, New York. Robichaux, R. H. & Yetman, D. A. (Eds), 2002. The
tropical deciduous forest of Alamos. The Univer-sity of Arizona Press. Tucson, USA.
Rodríguez, P., Soberón, J. & Arita, H., 2003. El componente de la diversidad beta de los mamíferos de México. Acta Zoológica Mexicana (n.s.), 89: 241–259.
Rzedowski, J., 1990. Vegetación Potencial. IV.8.2. Atlas Nacional de México. Vol II. Escala 1:4 000 000. Instituto de Geografía, UNAM. México.
Sánchez–Cordero, V., Cirelli, V., Munguía, M. & Sarkar, S., 2005. Place prioritization for biodiversity representation using species’ eco-logical niche modelling. Biodiversity Informatics, 2: 11–23.
Sánchez–Cordero, V. & Martinez–Meyer, E., 2000. Museum specimen data predict crop damage by tropical rodents. Proceedings from the Na-tional Academy of Sciences, 97: 7074–7077. Sarukhán, J. & Dirzo, R. (Eds), 1995. Mexico
con-fronts the challenges of biodiversity. CONABIO, Mexico, D.F.
Schall, J. J. & Pianka, E. R., 1978. Geographical trends in numbers of species. Science, 201: 679–686.
Simpson, G. G., 1964. Species density of North American recent mammals. Systematic Zoology, 13: 57–73.
Stockwell, D. R. B. & Peters, D., 1999. The GARP Modeling System: problems and solutions to automated spatial prediction. International Jour-nal of Geographical Information Science, 13: 143–158.
Trejo–Vazquez, I., 1999. El clima de las selvas baja caducifolia en México. Investigaciones Geográ-ficas, Boletin 39: 40–52.
– 2005. Análisis de la diversidad de la selva baja caducifolia en México. In: Sobre biodiversidad: el significado de las diversidades alfa, beta y gamma: 111–122. (G. Halffter, J. Soberón, P. Koleff & A. Melic, Eds.). Monografías Tercer Milenio Vol. 4 Sociedad Entomológica Aragonesa, Zaragoza, España.
Trejo–Vazquez, I. & Dirzo, R., 2000. Deforestation of seasonally dry forest: a national and local analysis in Mexico. Biological Conservation, 94: 133–142.
– 2002. Floristic diversity of Mexican seasonality dry tropical forests. Biodiversity and Conserva-tion, 11: 2063–2048.
Vargas–Santa María, F. & Flores–Villela, O., 2006. Estudio herpetofaunístico del Playón de Mexiquillo y áreas adyacentes en la costa sur del Estado de Michoacán, México. In: Inventarios herpetofaunísticos de México: avances en el conocimiento de su biodiversidad: 110–139 (A. Ramírez–Bautista, L. Canseco–Márquez & F. Mendoza–Quijano, Eds.). Publicaciones de la Sociedad Herpetológica Mexicana, No. 3. Vázquez, L. B. & Gaston, K. J., 2004. Rarity,