M Uribe et al.Adipokine expression in NAFLD 67
www.medigraphic.com
Annals of Hepatology 2008; 7(1): January-March: 67-71
Annals of Hepatology
Original Article
Hepatic expression of ghrelin and adiponectin and
their receptors in patients with nonalcoholic
fatty liver disease
Misael Uribe;1 Daniel Zamora-Valdés;1 Mucio Moreno-Portillo;2 Luisa Bermejo-Martínez;3 Raúl Pichardo-Bahena;1 Héctor A.
Baptista-González;3 Guadalupe Ponciano-Rodríguez;4 Martha H. Uribe;1 Roberto Medina-Santillán;5 Nahum Méndez-Sánchez1
1Liver Unit, Biomedical Research and Pathology Departments, Medica Sur Clinic & Foundation, Mexico City, Mexico. 2Departament of Surgery, «Dr. Manuel Gea Gonzalez» General
Hospital, Mexico City, Mexico.
3Clinical Investigation Center, National Institute of Perinatology, Mexico City, Mexico.
4Faculty of Medicine, National Autonomous University of Mexico, Mexico City, Mexico.
5Sección de Estudios de Postgrado e Investigación, Escuela Superior de Medicina-IPN,
México, DF, México
List abbreviations used in the manuscript:
NAFLD,nonalcoholic fatty liver disease; NASH, nonalcoholic steatohepatitis; ACC, acetyl-CoA carboxylase; CPT I, Carnitine palmitoyl transferase I; FAS, fatty acid synthase; TNF-α; tumor necrosis factor-α; BMI, body mass index; ALT, alanine aminotransferase; HDL, high-density lipoprotein; LDL, Low-density lipoprotein; HOMA-IR, Homeostasis Model Assessment Index
Address for correspondence:
Nahum Méndez-Sánchez, MD PhD. Liver Research Unit, Medica Sur Clinic & Foundation, Mexico City, Mexico. Puente de Piedra 150, Col. Toriello Guerra, Zip Code 14050, Mexico City, Mexico. Phone number: (525) 55606-6222, ext. 4215. Fax number: (525) 55666-4031 and (525) 55606-1651. E-mail: [email protected]
Manuscript received and accepted: 15 November and 27 December 2007
Abstract
Background&aim:Adiponectin and ghrelin are hor-mones that participate in hepatic lipid metabolism, and their expression in liver tissue could have important implications for nonalcoholic fatty liver disease (NAFLD).The aim of this study was to evaluate the he-patic expression of ghrelin, adiponectin, AdipoR, and IL-6 in patients with NAFLD and normal liver. Meth-ods:We studied patients with clinical-pathological di-agnosis of NAFLD or a normal liver. Patients were classified according to their diagnosis into three groups: normal liver, nonalcoholic hepatic steatosis, and nonalcoholic steatohepatitis (NASH). Adiponectin, AdipoR1, AdipoR2, IL-6, and ghrelin mRNA levels
were assessed in biopsies by reverse transcriptase-polymerase chain reaction. Results: Of the 21 patients, three had a normal liver biopsy, 14 had nonalcoholic steatosis, and four had NASH. Patients with NAFLD ex-hibited significantly higher HOMA-IR and triglyceride concentration (both P < 0.05). There was a nonsignifi-cant trend towards higher ghrelin expression in pa-tients with NASH > nonalcoholic steatosis > normal liv-er. Patients with NASH had significantly higher mRNA adiponectin levels and lower IL-6 levels than did those with a normal liver (P < 0.05). AdipoR expression did not differ significantly between groups. Conclusion: Adiponectin overexpression was observed in patients with NASH. The role of hepatic ghrelin in NAFLD re-quires further research.
Key words: Adiponectin, ghrelin, Interleukin-6, fatty acids, Non alcoholic fatty liver disease, adipokine hor-mone
Introduction
Nonalcoholic fatty liver disease (NAFLD) is a chronic disease of increasing interest worldwide because of its rising incidence and relationship with the obesity epi-demic. NAFLD has the potential to progress to liver cir-rhosis and hepatocellular carcinoma.1 The «two-hit» hy-pothesis proposes that NAFLD pathogenesis and progres-sion involve first fatty deposition and second necroinflammatory damage related to oxidative stress.2
Lipids accumulate as triglycerides in hepatocellular intracytoplasmic vesicles. This deposition depends on the relationship between the formation and degradation of fatty acids. The rate-limiting enzymes in fatty acid synthesis are acetyl-CoA carboxylase (ACC) and fatty acid synthase (FAS). Carnitine palmitoyl transferase I (CPT I) regulates fatty acid entry into the mitochondria, where it is degraded. These three enzymes are regulated by adiponectin, an adipocyte-derived enzyme, through its receptor AdipoR2.3 Adiponectin induces expression and activity of CPT I and inhibits ACC and FAS,4 reduc-ing serum and hepatic fatty acid concentrations and the
Artemisa
www.medigraphic.com
production and activity of tumor necrosis factor-α (TNF-α), an inducer of insulin resistance and a factor in NAFLD progression.5 Adiponectin serum concentration is low in obese individuals and in patients with NAFLD.6,7 In ex-perimental models, adiponectin reverses steatosis and hepatomegaly in diet-induced obese mice.4
Ghrelin is a peptide hormone produced in the stomach and other organs, including the liver and gallbladder.8 Ghrelin induces satiety by acting on its hypothalamic re-ceptor GHS1-a, and its serum level decreases after a meal and increases during fasting.9 Obese individuals and pa-tients with NAFLD exhibit hypoghrelinemia, which is re-lated to the degree of insulin resistance.10,11 The effects of ghrelin on hepatic fatty acid metabolism have been ob-served in experimental models.12 After intravenous ad-ministration in rats, ghrelin induces a rise in hepatic trig-lyceride content by activating ACC and FAS and by downregulating CPT-I. Ghrelin has been proposed as a factor causing hepatic steatosis during malnutrition. The aim of this study was to study the serum concentration and hepatic expression of ghrelin and adiponectin and their receptors in patients with NAFLD.
Materials and methods
Study design and sample
A cross-sectional clinical study was carried out at the Liver Unit of the Medica Sur Clinic & Foundation and the Surgery Department of the General Hospital Dr. Man-uel Gea González. A consecutive series of patients who were scheduled for abdominal laparoscopic surgery and who had no known chronic liver disease, alcohol con-sumption < 20 g/week, and a negative hepatitis virus panel were invited to participate. The study protocol conformed to the recommendations of the Helsinki Dec-laration of 1983 and was approved by the Ethics Com-mittee of the participating hospital and all patients gave written informed consent.
Physical examination
Height and weight were measured for patients in light clothing and without shoes, and body mass index (BMI) was calculated. Waist and hip circumferences were re-corded by the same person who measured height and weight. Blood pressure was measure according to the American Heart Association guidelines.13
Analytical methods
A blood sample was obtained from all participants during fasting, and the serum was separated by centrifu-gation. Liver function tests including the concentrations or activities of aspartate aminotransferase, alanine ami-notransferase (ALT), alkaline phosphatase,
gamma-glutamyl transpeptidase, total bilirubin, direct and indi-rect fractions, total proteins, albumin, and globulins, and prothrombin time. Serum glucose concentration was mea-sured during fasting. The concentrations of cholesterol, high-density lipoprotein (HDL), and triglycerides were measured using colorimetric enzymatic assays. Low-den-sity lipoprotein (LDL) concentration was calculated us-ing the Friedewald formula.14 High-sensitivity C-reactive protein (hs-CRP) concentration was measured by nephelometry (IMMAGE, Beckman Coulter, US). Fasting insulin concentration was measured using an immunoen-zymometric assay (MEIA; Abbott Diagnostics). Homeo-stasis Model Assessment Index (HOMA-IR) was calculat-ed as fasting insulin concentration (μU/mL) ´ fasting glu-cose concentration (mmol/L)/22.5. Values > 2.522 indicate insulin resistance.15
Liver biopsy study
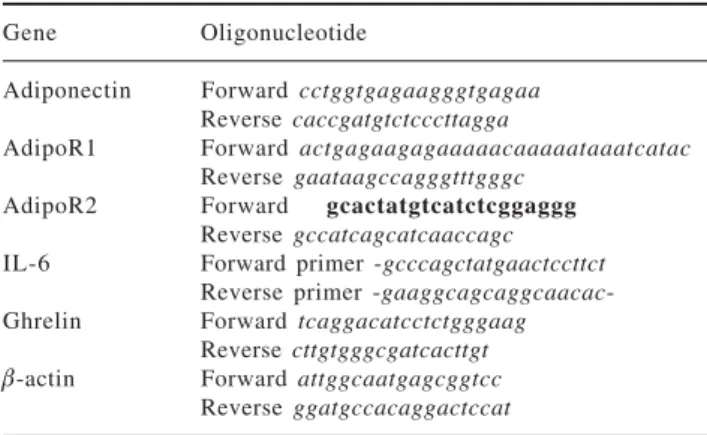
Samples were separated into two fragments. Fragment 1 was fixed in paraffin for histopathological study using hematoxylin–eosin and special staining according to the patient (Masson, Prussian blue, etc). Patients with NASH were classified using the Brunt scale.16 Fragment 2 was frozen at –70 °C and stored until it was analyzed at the Biomedical Research Center at the National Institute of Perinatology. Total RNA was extracted from liver biop-sies using the guanidine isothiocyanate single-step tech-nique (Trizol Reagent, InvitroGen). Complementary DNA was obtained from 1 μg of total RNA (Transcriptor First Strand cDNA Synthesis kit, Roche), using a 60 μM random primer, 20 U RNAse inhibitor, 1 mM of each dNTP, and 10 U of transcriptase. For reverse tran-scriptase-polymerase chain reaction (RT-PCR) amplifica-tion, 2 μL of cDNA was used, 100 nM on each probe and 200 nM of every oligonucleotide, according to the fol-lowing protocol: one cycle of preincubation at 95 °C for 10 s, 60 °C for 30 s, 72°C for 1 s, and a final cooling cy-cle at 4 °C for 30 s. Probes and oligonucy-cleotides used for amplification of every gene were determined using the program ProbeFinder v2.04 (www.roche-applied-science.com). Table I shows the oligonucleotide se-quences used. A relative quantitative analysis was per-formed using β-actin as the reference gene and crossing-point values to obtain the expression level of each gene relative to β-actin.
Statistical analysis
www.medigraphic.com
Results
Twenty-one patients were studied: 16 women and five men aged 35 ± 12 years. Nineteen patients had surgical cholecystectomy, one patient had Nissen fundoplication, and one patient had gastric bypass. The histopathologi-cal diagnoses were normal liver in three patients, hepatic steatosis in 14 patients, and NASH in four patients. Two patients with hepatic steatosis showed abnormal ALT ac-tivity (51 and 62 UI/L), and one patient with hepatic ste-atosis had hypoalbuminemia (3 g/dL); the rest of the pa-tients had no abnormalities in the liver function tests. All patients with NASH were considered as grade I in the Brunt classification. Table II shows the median and SD of the variables of interest. Patients with hepatic steatosis and NASH had a significantly higher HOMA-IR and trig-lyceride concentration than did the normal liver group. HOMA-IR was 1.85 ± 1.3 in patients with steatosis, 2.6 ± 1.7 in patients with NASH, and 0.53 ± 0.15 in the normal liver group (P < 0.05 compared with the normal liver group). Triglyceride concentration was 147.4 ± 130.2 mg/dL in patients with steatosis, 202.2 ± 92.7 mg/dL in patients with NASH, and 81 ± 8.1 mg/dL in the normal liver group (P < 0.05 compared with the normal liver group). BMI and waist-to-hip ratio did not differ
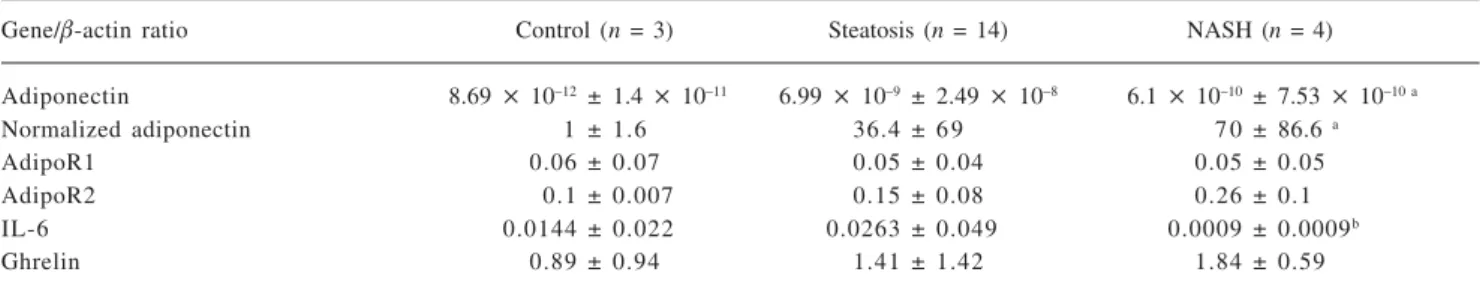
signifi-cantly between groups. A nonsignificant trend for higher hs-CRP concentration was observed in patients with NAFLD (P = 0.08).RT-PCR results are shown in Table III. Adiponectin mRNA level was significantly higher in pa-tients with NASH than in the normal liver group (P = 0.034), but did not differ significantly between patients with steatosis and either of the other two groups. Adi-poR1 and AdipoR2 mRNA levels did not differ signifi-cantly between groups. A nonsignificant trend for higher ghrelin expression was observed in patients with NASH compared with the normal liver group (normal liver group, 0.89 ± 0.94; steatosis group, 1.19 ± 0.87; and NASH group, 1.84 ± 0.59). IL-6 mRNA expression was significantly lower in patients with NASH than in pa-tients with steatosis (P < 0.05). A nonsignificant trend was observed for the difference in IL-6 mRNA expression between patients with NASH and the normal liver group (P = 0.077), but IL-6 mRNA expression did not differ sig-nificantly between patients with a normal liver and pa-tients with steatosis. IL-6 expression was negatively cor-related with adiponectin expression (r < 0.74; P < 0.01, see Figure 1).
Discussion
NAFLD is a highly prevalent disease worldwide, which affects 30% of the general population and 60–90% of obese individuals and people with diabetes.16 The per-sistence of pathogenic factors induces progression to NASH of the disease in 20% of patients, and the five-year risk of cirrhosis is 3–5%.18 The disease also has a negative impact on donor graft function and receptor survival after liver transplantation.19
Currently, the only accepted therapy for NASH is life-style modification and intervention to change the associ-ated risks factors such as obesity, diabetes mellitus, and hypertriglyceridemia.20 Hepatocellular genetic regulation of transducers involved in fatty acid metabolism is a po-tential therapeutic target to decrease the hepatic triglyc-eride content and necroinflammatory activity.
Table I. Oligonucleotide sequences used for RT-PCR analysis. Gene Oligonucleotide
Adiponectin Forward cctggtgagaagggtgagaa Reverse caccgatgtctcccttagga
AdipoR1 Forward actgagaagagaaaaacaaaaataaatcatac Reverse gaataagccagggtttgggc
AdipoR2 Forward gcactatgtcatctcggaggg
Reverse gccatcagcatcaaccagc IL-6 Forward primer -gcccagctatgaactccttct
Reverse primer -gaaggcagcaggcaacac -Ghrelin Forward tcaggacatcctctgggaag
Reverse cttgtgggcgatcacttgt
β-actin Forward attggcaatgagcggtcc Reverse ggatgccacaggactccat
Table II. Basal characteristics of the normal liver, steatosis, and NASH groups.
Variable Normal liver (n = 3) Steatosis (n = 14) NASH (n = 4)
Sex (% female) 100 71.4 2 5
Age (years) 3 5 ± 3.6 37.4 ± 1 4 30.2 ± 4.5
BMI (kg/m2) 24.7 ± 3.7 33.4 ± 13.6 27.9 ± 3.6
Waist-to-hip ratio 0.86 ± 0.07 0.86 ± 0.09 0.77 ± 0.05
Systolic pressure (mm Hg) 105 ± 5 113.6 ± 8.4 112.5 ± 5
Diastolic pressure (mm Hg) 6 9 ± 10.1 7 5 ± 8 82.5 ± 5
HOMA-IR 0.53 ± 0.15 1.85 ± 1.3 a 2.6 ± 1.7 a
Triglycerides (mg/dL) 8 1 ± 8.1 147.4 ± 130.2 a 202.2 ± 92.7 a
Cholesterol (mg/dL) 162.6 ± 3 2 182.8 ± 38.8 174 ± 18.8
HDL (mg/dL) 41.9 ± 7.1 37.7 ± 7.7 36.3 ± 2.9
LDL (mg/dL) 104.6 ± 23.8 116.2 ± 23.8 97.2 ± 14.3
hs-CRP (UI/L) 1.4 ± 1.2 4.4 ± 4.4 2.6 ± 1.3
www.medigraphic.com
ESTE DOCUMENTO ES ELABORADO POR MEDIGRA-PHIC
High adipose tissue levels of TNF-α mRNA and high serum concentrations of interleukin (IL)-6 are found in insulin-resistant states.5 IL-6 is an inflammatory cytokine that induces hepatocellular regeneration and insulin sen-sitivity.21,22 In experimental models, IL-6 reduces the grade of hepatic steatosis and ischemia–reperfusion le-sions in rats transplanted with a nonalcoholic fatty liv-er.23 Adiponectin is not produced by the human liver in normal circumstances, although CCl4-induced lesions cause adiponectin deposition in rat hepatocytes and in vitro stimulation of human HepG2 cells induces adi-ponectin expression.24 We have demonstrated previously that patients with hepatic steatosis exhibit hypoadi-ponectinemia.7 Based on our current results, we propose that, in response to IL-6 and possibly other factors, hu-man hepatocytes are capable of producing adiponectin as a compensatory response to hypoadiponectinemia and insulin resistance. IL-6 mRNA expression was signifi-cantly lower in patients with NASH, suggesting a down-regulating effect of systemic IL-6 on hepatic expression. The adiponectin mRNA level was 70 times higher in our patients with NASH than in patients with a normal liver; however, the mRNA levels were relatively low in both groups. Exogenous induction of hepatic adiponectin ex-pression may be a potential therapeutic option to reduce
triglyceride hepatic content and necroinflammatory ac-tivity in patients with NASH through TNF-α antagonism and a direct effect on fatty acid metabolism and insulin sensitivity.
Ghrelin is a multifunctional hormone normally ex-pressed in the liver, and its activity is now an integral part of the study of hepatic lipid metabolism.8 Patients with NAFLD exhibit hypoghrelinemia, whereas patients with anorexia nervosa have hyperghrelinemia, a possible factor in the induction of fatty liver associated with mal-nutrition through the induction of lipogenic enzymes.11 We studied ghrelin hepatic expression in patients with a histologically normal liver and patients with NAFLD, and we found nonsignificant hepatic ghrelin overexpres-sion in patients with NASH. Although this difference was not statistically significant, we believe that the 100% higher value in the NASH group (0.89 in the normal liver group compared with 1.84 in the NASH group) is real and may have been underestimated because of the small sam-ple size (type II error).
In conclusion, our study shows that human liver is ca-pable of producing adiponectin in vivo under pathologi-cal circumstances (e.g., NASH) and suggests that hepatic ghrelin is overexpressed, representing a potential factor responsible for lipid deposition in NAFLD despite hy-poghrelinemia.
References
1. Mendez-Sanchez N, Arrese M, Zamora-Valdes D, Uribe M. Cur-rent concepts in the pathogenesis of nonalcoholic fatty liver dis-ease. Liver Int 2007; 27: 423-33.
2. Day CP, James OF. Steatohepatitis: a tale of two «hits»? Gastro-enterology 1998; 114: 842-5.
3. Yamauchi T, Kamon J, Ito Y, et al. Cloning of adiponectin recep-tors that mediate antidiabetic metabolic effects. Nature 2003; 423: 762-9.
4. Xu A, Wang Y, Keshaw H, Xu LY, Lam KS, Cooper GJ. The fat-derived hormone adiponectin alleviates alcoholic and nonalco-holic fatty liver diseases in mice. J Clin Invest 2003; 112: 91-100. 5. Leclercq IA, Da Silva Morais A, Schroyen B, Van Hul N, Geerts A. Insulin resistance in hepatocytes and sinusoidal liver cells: Mechanisms and consequences. J Hepatol 2007; 47: 142-56. 6. Weyer C, Funahashi T, Tanaka S, et al. Hypoadiponectinemia in
obesity and type 2 diabetes: close association with insulin
resis-Table III. Relative quantification of mRNA levels of adiponectin, AdipoR1, AdipoR2, IL-6 and ghrelin in patients with a normal liver, steatosis, and NASH.
Gene/β-actin ratio Control (n = 3) Steatosis (n = 14) NASH (n = 4) Adiponectin 8.69 × 10⁻¹²± 1.4 × 10⁻¹¹ 6.99 × 10⁻⁹ ± 2.49 × 10⁻⁸ 6.1 × 10⁻¹⁰± 7.53 × 10⁻¹⁰ a
Normalized adiponectin 1 ± 1.6 36.4 ± 6 9 7 0 ± 86.6 a
AdipoR1 0.06 ± 0.07 0.05 ± 0.04 0.05 ± 0.05
AdipoR2 0.1 ± 0.007 0.15 ± 0.08 0.26 ± 0.1
IL-6 0.0144 ± 0.022 0.0263 ± 0.049 0.0009 ± 0.0009b
Ghrelin 0.89 ± 0.94 1.41 ± 1.42 1.84 ± 0.59
a P < 0.05 compared with normal liver group b P < 0.05 compared with steatosis group
Figure 1. Correlation between IL-6/β-actin mRNA ratio and adi-ponectin/β-actin mRNA ratio (r < 0.74; P < 0.001).
5
4
3
2
1
0
0 10 20 30 40 50 60
Adiponectin / -actinARNmβ
r=0.74; p<0.001
IL-6/
-actinARNm
www.medigraphic.com
tance and hyperinsulinemia. J Clin Endocrinol Metab 2001; 86:1930-5.
7. Mendez-Sanchez N, Chavez-Tapia NC, Villa AR, et al. Adiponectin as a protective factor in hepatic steatosis. World J Gastroenterol 2005; 11: 1737-41.
8. Gnanapavan S, Kola B, Bustin SA, et al. The tissue distribution of the mRNA of ghrelin and subtypes of its receptor, GHS-R, in humans. J Clin Endocrinol Metab 2002; 87: 2988-2991. 9. Kojima M, Kangawa K. Ghrelin: structure and function. Physiol
Rev 2005; 85: 495-522.
10. Mendez-Sanchez N, Chavez-Tapia NC, Uribe-Esquivel M. [Ghrelin and the gastro-hypothalamic axis]. Gac Med Mex 2006; 142: 49-58.
11. Marchesini G, Pagotto U, Bugianesi E, et al. Low ghrelin concen-trations in nonalcoholic fatty liver disease are related to insulin resistance. J Clin Endocrinol Metab 2003; 88: 5674-9. 12. Barazzoni R, Bosutti A, Stebel M, et al. Ghrelin regulates
mito-chondrial-lipid metabolism gene expression and tissue fat distri-bution in liver and skeletal muscle. Am J Physiol Endocrinol Metab 2005; 288: E228-35.
13. Pickering TG, Hall JE, Appel LJ, et al. Recommendations for blood pressure measurement in humans and experimental ani-mals: part 1: blood pressure measurement in humans: a state-ment for professionals from the Subcommittee of Professional and Public Education of the American Heart Association Coun-cil on High Blood Pressure Research. Circulation 2005; 111: 697-716.
14. Friedewald WT, Levy RI, Fredrickson DS. Estimation of the concentration of low-density lipoprotein cholesterol in plasma, without use of the preparative ultracentrifuge. Clin Chem 1972; 18: 499-502.
15. Matthews DR, Hosker JP, Rudenski AS, Naylor BA, Treacher DF, Turner RC. Homeostasis model assessment: insulin resistance and beta-cell function from fasting plasma glucose and insulin concentrations in man. Diabetologia 1985; 28: 412-9. 16. Brunt EM, Janney CG, Di Bisceglie AM, Neuschwander-Tetri
BA, Bacon BR. Nonalcoholic steatohepatitis: a proposal for grad-ing and staggrad-ing the histological lesions. Am J Gastroenterol 1999; 94(9): 2467-74.
17. Mendez-Sanchez N, Chavez-Tapia NC, Uribe M. [An update on non-alcoholic fatty liver disease]. Rev Invest Clin 2004; 56: 72-82. 18. Adams LA, Lymp JF, St Sauver J, et al. The natural history of nonalcoholic fatty liver disease: a population-based cohort study. Gastroenterology 2005; 129: 113-21.
19. Selzner M, Clavien PA. Fatty liver in liver transplantation and surgery. Semin Liver Dis 2001; 21: 105-13.
20. Dixon JB, Bhathal PS, Hughes NR, O’Brien PE. Nonalcoholic fatty liver disease: Improvement in liver histological analysis with weight loss. Hepatology 2004; 39: 1647-54.
21. Streetz KL, Luedde T, Manns MP, Trautwein C. Interleukin 6 and liver regeneration. Gut 2000; 47: 309-12.
22. Senn JJ, Klover PJ, Nowak IA, et al. Suppressor of cytokine signaling-3 (SOCS-3), a potential mediator of interleukin-6-de-pendent insulin resistance in hepatocytes. J Biol Chem 2003; 278: 13740-6.
23. Hong F, Radaeva S, Pan HN, Tian Z, Veech R, Gao B. Interleukin 6 alleviates hepatic steatosis and ischemia/reperfusion injury in mice with fatty liver disease. Hepatology 2004; 40: 933-41. 24. Yoda-Murakami M, Taniguchi M, Takahashi K, et al. Change in