Annals of Hepatology 6(3) 2007: 164-169
164
medigraphic.com
Annals of Hepatology 2007; 6(3): July-September: 164-169Annals of Hepatology
Original Article
Evaluation of gallbladder motility:
comparison of two-dimensional and
three-dimensional ultrasonography
Susanne Stads;1 Niels G. Venneman;1 Robert C.H. Scheffer;1 Melvin Samsom;1 Karel J. van Erpecum1
1Gastrointestinal Research Unit, Depts. of Gastroenterology and
Surgery, University Medical Center Utrecht, The Netherlands.
Abbreviations:
2D, 2-dimensional, 3D, 3-dimensional, FV, fasting volume; RV, residual volume; EV, ejection volume; BMI, body mass index
Grants/Financial support:
N.G. Venneman was supported by the “Dutch Digestive Foundation (Maag Lever Darm Stichting)”: grant MLDS WS 00-08, and the “Netherlands Organization for Health Research and Development”: grant ZonMW 920-02-239.
Address for correspondence: Karel J. van Erpecum MD, PhD Dept. of Gastroenterology HP F.02.618 University Medical Center Utrecht PO Box 85500
3508 GA Utrecht, The Netherlands Tel: +31 30 2507004
Fax: +31 30 2505533
E-mail: [email protected]
Manuscript received and accepted: 5 April and 25 June 2007
Abstract
Since impaired gallbladder emptying contributes to gallstone formation, the evaluation of gallbladder mo-tility requires accurate methodology. Recently devel-oped 3-dimensional ultrasonography may take into ac-count various gallbladder shapes more accurately than conventional 2-dimensional ultrasonography. There-fore, volumes of water-filled balloons of various sizes were determined in vitro by 2-dimensional ultrasonog-raphy with the sum of cylinders method and by 3-di-mensional ultrasonography. Also, in15 gallstone pa-tients and 6 healthy volunteers, fasting gallbladder vol-umes and postprandial motility were determined by both methods. Volumes of water-filled balloons as mea-sured by both methods correlated strongly with true volumes (R= 0.93 for 2-dimensional and R = 0.98 for 3-dimensional ultrasonography). Gallbladder volumes measured by both methods were also correlated (R = 0.66, P < 0.001). In gallstone patients, 3-dimensional ul-trasonography yielded smaller gallbladder volumes
than 2-dimensional ultrasonography (P = 0.007), but not in healthy subjects. With both methods, gallstone patients exhibited decreased postprandial gallbladder motility compared to healthy subjects. In conclusion, gallbladder volume measurements by 3-dimensional and 2-dimensional ultrasonography are strongly corre-lated. Nevertheless, in gallstone patients, gallbladder volumes by 3-dimensional ultrasonography tend to be smaller than by 2-dimensional ultrasonography, possi-bly due to interference of gallstones with the volume measurement.
Key words: Gallstone, ultrasonography.
Introduction
Gallstones frequently occur in the Western world (10-12% of the adult population are gallstone carriers),1 and
lead to considerable health expenses. Most of these gall-stone carriers exhibit cholesterol gall-stones.2 Cholesterol
crystallization from supersaturated bile is a prerequisite for cholesterol gallstone formation. Impaired gallbladder emptying could promote gallstone formation by provid-ing time for nucleation and subsequent aggregation of cholesterol crystals. Also, impaired emptying may en-hance concentration of gallbladder bile with increased crystallization as a result.3,4 In gallstone patients, both
postprandial and interdigestive (fasting) gallbladder mo-tility are impaired.5 Also in various conditions such as
pregnancy,6 obesity7 and treatment with somatostatin
an-alogues,8 impaired gallbladder emptying is associated
with increased risk of gallstone formation. Nevertheless, preserved gallbladder emptying is associated with risk of acute pancreatitis in gallstone patients.9 It remains
un-clear if gallbladder motility could also affect occurrence of biliary pain or other complications of gallstone dis-ease. Several agents affect gallbladder motility.10 To
study their role in pathogenesis, treatment and preven-tion of gallstone disease, accurate quantitapreven-tion of gall-bladder motility is essential.
Various methods have been used to measure gallblad-der emptying, such as oral cholecystography11 and 99
Tc-Hida scanning.12,13 Gallbladder volumes can be determined
by 2-dimensional (2D) ultrasonography by the ellipsoid
Artemisa
medigraphic.com
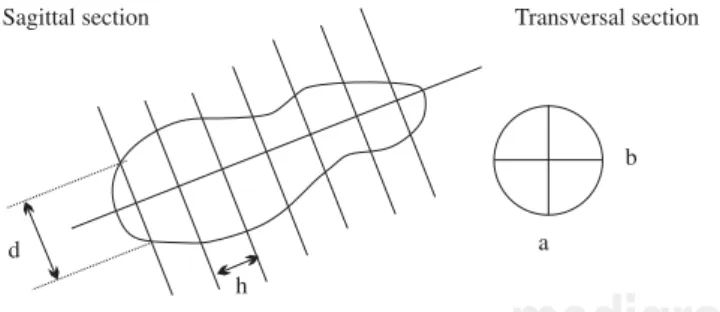
using the following formula: V = π/6 * L* W * H, ( L = maximum length, W = maximum width, H = maximum height). However, to date the gold standard to determine gallbladder volumes is real-time 2D ultrasonography with the sum-of-cylinders method.15,16 With this method, gall-bladder volume is determined by dividing the gallgall-bladder image on the sagittal scan in a series of cylinders of equal height. The volumes of the individual cylinders are then summated and, based on the transverse scan, a correction factor is applied to correct for positioning of the sagittal scan from the central axis of the gallbladder (Figure 1). Nevertheless, this method is tedious and time consuming, unless a computer program is available. Theoretically, de-viations of gallbladder shape could affect results. Recent-ly, a new modality has been developed to estimate gall-bladder volumes: 3D (3-dimensional) ultrasonography. This has been established as an adequate method for mea-surement of intragastric volumes.17-19 A potential advan-tage of 3D ultrasonography is that a sagittal section of the gallbladder at its maximal diameter is not required, which may be important in patients with irregular gallbladder shapes. Therefore, 3D ultrasonography methodology may better take into account variations in gallbladder shapes. The aim of the present study was to compare 2D and 3D ul-trasonography by in vitro measurements of water-filled balloons. We also compare postprandial gallbladder vol-umes by 3D and 2D ultrasonography in healthy volunteers and patients with uncomplicated gallbladder stones.
Methods
In vitro measurement of water-filled balloon
Volume measurements were performed by scanning water-filled balloons in a water tub. Various balloon vol-umes of 10, 20, 30 and 40 mL were investigated 3 times
The investigator performing the measurements and anal-ysis was blinded for these volumes.
Subjects
Gallbladder volume measurements were performed in 6 healthy volunteers (1 male/5 females, 23 ± 1 yrs, BMI (body mass index) 22 ± 1 kg/m2) and 15 gallstone carriers (8 males/7 females, 52 ± 8 yrs, BMI 28 ± 1 kg/m2) with uncomplicated disease (no history of obstructive jaun-dice, acute cholecystitis, acute pancreatitis or cholangi-tis). Written informed consent was obtained from all sub-jects. Approval was obtained from the ethical committee of our hospital.
Ultrasonography
Fasting and postprandial gallbladder volumes were measured by real-time 2D ultrasonography (3.5 MHz con-vex transducer, Pie Medical Scanner 250, Pie Medical, Maastricht, The Netherlands) using the sum-of-cylinders method (Figure 1). The 3D imaging system consisted of a commercially available ultrasonography scanner (Esaote-Pie Medical, Maastricht, The Netherlands) with a 3.5 MHz curved ultrasonography probe and a tracking system (Es-aote-Pie Medical, Maastricht, The Netherlands). The track-ing system consisted of a transmitter generattrack-ing a spatially varying magnetic field and a small receiver containing three orthogonal coils to sense the magnetic field strength. The receiver was firmly attached to the ultrasonography probe. Data were transferred to the computer workstation and stored on a 30 GB hard disk. Data processing was done on a Windows-NT version 4.0 workstation equipped with two 233 MHz Pentium processors and 256 MB RAM. The pulse magnetic field generator positioned closely behind the subject’s chair, or water tub, was used for 3-di-mensional orientation. A ‘sweep’ was performed from a point just medial of the gallbladder ending just lateral of the gallbladder, during breath-hold of the subject. In the water tub, a “sweep” was performed immobilizing the bal-loon, beginning where the balloon was not yet visible, ending where the balloon was no longer visible. During each sweep, about 200 images were obtained and stored within 10 seconds. Computerized post-processing (In vivo, MedCom GmbH, Germany) started with manual outlining the region of interest using the sagittal 2-dimensional slic-es that were obtained during the sweep. After re-sampling of the images, the gallbladder inner wall or balloon wall were used as a border for manual drawing in the selected images. When all images were well drawn (by manual out-lining or interpolation), a 3-dimensional image was ob-tained and the computer calculated the volume of the 3-di-mensional image (Figure 2). Subjects were positioned in a chair in the upright position while measurements by both methodologies were obtained.
Figure 1. 2-dimensional ultrasonography with the sum of cylin-ders method. A schematic representation is shown of 2-dimensio-nal ultrasonographically obtained sections with the sum of cylin-ders method. a and b represent width and height of each cylinder, whereas h represents the height of each cylinder and d the diame-ter of each cylinder. Gallbladder volume is calculated by the for-mula: V= π/4 * h * (Σdi 2) * (a + b/2* d
max)
2 Based on the transverse
section, the correction factor: (a + b/2x dmax)
2 is applied to correct
medigraphic.com
Gallbladder volumes and postprandial motility
In the fasting state, two gallbladder volume measure-ments were made by 2D ultrasonography and two sweeps were performed by 3D ultrasonography. The standard semi-solid mixed meal consisted of 30 g fat, 30 g protein and 70 g carbohydrate (2815 kJ). After meal ingestion, gallbladder volumes were determined at 15 min. inter-vals during 2 hours. Each postprandial measurement was performed by both methods. The following gallbladder contraction parameters were determined by both method-ologies in both groups: fasting volume (FV in mL), mini-mal residual volume (RV, in mL and in % of FV) and maximal decrease of gallbladder volume (ΔVmax in mL and in %).
Statistical analysis
Results are expressed as mean ± SEM. Differences be-tween 2D and 3D ultrasonography were tested by paired Student’s t-tests in all subjects, as well as in subgroups. Differences between gallstone carriers and healthy volun-teers were tested by unpaired Student’s t-tests. When data showed a non-Gaussian distribution, Mann-Whitney-U test was used to test differences. Differences between gallbladder contraction curves were tested by GLM ANOVA. Linear regression analysis was used to deter-mine correlations between volumes obtained by 2D vs
3D ultrasonography. A two-tailed probability < 0.05 was considered statistically significant.
Results
In vitro measurements of water-filled balloons
Volumes of water filled balloons determined by 2D ultrasonography correlated strongly to true volumes (R = 0.93, r = 1.19, P < 0.001). A strong correlation was also found between volumes determined by 3D ultrasonogra-phy and true volumes (R = 0.98, r = 1.09, P < 0.001).
In vivo measurements by 2D vs 3D ultrasonography in human subjects
In healthy subjects, fasting volumes determined by 2D and 3D ultrasonography were virtually identical (20 ± 2
vs 19 ± 4 mL, P = NS). Minimal residual volumes were also comparable (8 ± 2 vs 6 ± 4 mL, P = NS). No differ-ences were found between 2D and 3D ultrasonography in other gallbladder contraction parameters (not shown). Postprandial contraction curves in healthy subjects were also comparable as determined by 2D and 3D ultrasonog-raphy (Figure 3A).
Figure 2. 3-dimensional ultraso-nography. Representative 2-dimen-sional ultrasonographical image (A), manual outlining, (B) and compu-ter calculated 3-dimensional recon-struction, (C) of the gallbladder are shown.
medigraphic.com
ESTE DOCUMENTO ES ELABORADO POR MEDI-GRAPHIC
termined by 3D ultrasonography were slightly lower than by 2D ultrasonography, without reaching signifi-cance (20 ± 2 vs 23 ± 3 mL, P = NS). Minimal residual gallbladder volumes in gallstone carriers exhibited a similar tendency (9 ± 1 vs 11 ± 1 mL, P = NS). Postpran-dial contraction curves indicated smaller gallbladder volumes during the whole postprandial period in case of 3D ultrasonography compared to 2D ultrasonogra-phy, as depicted in Figure 3B (P= 0.007). Other gall-bladder contraction parameters were not significantly different (not shown).
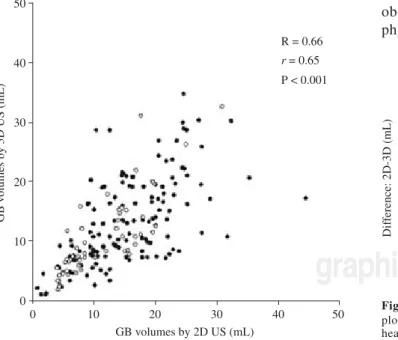
Volumes obtained by 2D and 3D ultrasonography were significantly correlated (R = 0.66, r = 0.65, P < 0.001: Figure 4). In Figure 5, differences between vol-umes of the same gallbladders according to 2D and 3D ultrasonography are given as a function of volumes ac-cording to 2D ultrasonography. This is the most appro-priate way to show potential differences between meth-ods that are highly correlated. Especially at higher gall-bladder volumes and in the gallstone group, gallgall-bladder volumes by 3D ultrasonography appear smaller than cor-responding volumes by 2D ultrasonography.
Gallstone carriers vs healthy subjects
With both methods, fasting and minimal residual gall-bladder volumes tended to be larger in gallstone carriers than in healthy subjects. Also, maximal decreases of gall-bladder volumes in mL and % of fasting volumes were smaller in the gallstone group (not shown). Overall
gall-vealed clearly larger postprandial volumes in gallstone carriers (Figure 6).
Discussion
Impaired gallbladder emptying plays an important role in cholesterol gallstone formation. Several methods have been used to determine gallbladder emptying, such as oral cholecystography,1199Tc- HIDA scanning12,13 and 2D ultrasonography with ellipsoid14 and sum of cylinders method.15,16 The current study evaluated the feasibility of 3D ultrasonography for determining gallbladder volumes and compared results to 2D ultrasonography with the sum of cylinders method, both in vivo and in vitro.In vit-ro measurements revealed that both methods estimated true volumes adequately. Also in healthy subjects, no dif-ferences were found between both methods. In gallstone patients however, postprandial gallbladder volumes mea-sured by 3D ultrasonography were smaller than those measured by 2D ultrasonography. Our impression is, that differences may be explained by difficulties outlining the gallbladder wall correctly during 3D ultrasonogra-phy: due to the presence of gallstones, the gallbladder wall was not always entirely visible after re-sampling. On the other hand, overestimation of gallbladder volumes by 2D ultrasonography cannot be excluded. In vitro mea-surement of water-filled balloons by 2D ultrasonography showed indeed some overestimation compared to true volumes. Compared to 2D ultrasonography, 3D ultra-sonography of gallbladder volumes is more time-con-suming, and resolution may be lost during re-sampling of computerized 3D ultrasonography data. Furthermore, obesity may reduce the feasibility of 3D ultrasonogra-phy more than 2D ultrasonograultrasonogra-phy, since a sweep over
Figure 4. 2- vs 3-dimensional ultrasonography scatter plot. Gall-bladder volumes obtained by 2-dimensional and 3-dimensional ultrasonography in healthy subjects ( ) and gallstone carriers ( ) are significantly correlated. GB, gallbladder.
medigraphic.com
a larger area may be more difficult than a static measure-ment in obese subjects.
Limited data are available on gallbladder volume measurements by 3D ultrasonography. Hashimoto et al. evaluated gallbladder volumes measured by 3D ultra-sonography in vitro and invivo,and compared this meth-od to 2D ultrasonography.20In vivo, gallbladder volumes of fourteen male healthy volunteers were comparable as measured by 2D and 3D ultrasonography, in agreement with the current results. In a study by Yoon et al., 3D ul-trasonography was compared to oral cholecystography for visualization of the gallbladder and gallbladder stones.21 In some gallstone carriers, the gallbladder showed no opacification, and not all gallbladder stones were visualized by oral cholecystography. This was how-ever always the case when 3D ultrasonography was ap-plied. Gallbladder volumes were not obtained by oral cholecystography in that study.
Regardless the ultrasonography method used, we found significantly larger postprandial gallbladder vol-umes in gallstone patients than in healthy subjects, indi-cating impaired gallbladder motility in the gallstone group. Since comparing gallbladder contraction in gall-stone patients and normal subjects was not the primary aim of our study, we did not match both groups for age and BMI. Nevertheless, these results are in agreement with many previous studies by our group and others.22-24
In conclusion, gallbladder volume measurements by 3-dimensional and 2-dimensional ultrasonography are strongly correlated. Nevertheless, in gallstone car-riers, gallbladder volumes by 3-dimensional ultra-sonography tend to be smaller than by 2-dimensional ultrasonography.
References
1. Barbara L, Sama C, Morselli Labate AM, Taroni F, Rusticali AG, Festi D, Sapio C, et al. A population study on the prevalence of gallstone disease: the Sirmione Study. Hepatology 1987; 7: 913-17. 2. van Erpecum KJ, Berge Henegouwen GP, Stoelwinder B, Stolk MF, Eggink WF, Govaert WH. Cholesterol and pigment gall-stone disease: comparison of the reliability of three bile tests for differentiation between the two stone types. Scand J Gastroenterol
1988; 23: 948-54.
3. van Erpecum KJ, Berge Henegouwen GP, Stoelwinder B, Schmidt YM, Willekens FL. Bile concentration is a key factor for nucle-ation of cholesterol crystals and cholesterol saturnucle-ation index in gallbladder bile of gallstone patients. Hepatology 1990; 11: 1-6. 4. van Erpecum KJ, Stolk MF, van den Broek AM, Renooij W, van de Heijning BJ, Berge Henegouwen GP. Bile concentration pro-motes nucleation of cholesterol monohydrate crystals by increas-ing the cholesterol concentration in the vesicles. Eur J Clin Invest
1993; 23: 283-88.
5. Stolk MF, van Erpecum KJ, Peeters TL, Samsom M, Smout AJ, Akkermans LM, vanBerge-Henegouwen GP. Interdigestive gall-bladder emptying, antroduodenal motility, and motilin release patterns are altered in cholesterol gallstone patients. Dig Dis Sci
2001; 46: 1328-34.
6. Everson GT, McKinley C, Lawson M, Johnson M, Kern F, Jr. Gallbladder function in the human female: effect of the ovula-tory cycle, pregnancy, and contraceptive steroids. Gastroenter-ology 1982; 82: 711-19.
7. Palasciano G, Serio G, Portincasa P, Palmieri V, Fanelli M, Velardi A, Calo’ GB, et al. Gallbladder volume in adults, and relationship to age, sex, body mass index, and gallstones: a sonographic popu-lation study. Am J Gastroenterol 1992; 87: 493-97.
8. Hussaini S, Murphy G, Kennedy C, Besser G, Wass J, Dowling R. The role of bile composition and physical chemistry in the patho-genesis of octreotide-associated gallbladder stones. Gastroenter-ology 1994; 107: 1503-13.
9. Venneman NG, Renooij W, Rehfeld JF, vanBerge-Henegouwen GP, Go PM, Broeders IA, van Erpecum KJ. Small gallstones, preserved gallbladder motility, and fast crystallization are associ-ated with pancreatitis. Hepatology 2005; 41: 738-46.
10. van Erpecum KJ, Venneman NG, Portincasa P, vanBerge-Henegouwen GP. Review article: agents affecting gall-bladder motility—role in treatment and prevention of gallstones. Aliment Pharmacol Ther 2000; 14 (Suppl 2): 66-70.
11. Shaffer EA, McOrmond P, Duggan H. Quantitative cholescintigraphy: assessment of gallbladder filling and empty-ing and duodenogastric reflux. Gastroenterology 1980; 79: 899-906.
medigraphic.com
fraction: a technique for quantitative analysis of motor function of the human gallbladder. Gastroenterology 1981; 80: 482-90. 13. Radberg G, Asztely M, Moonen M, Svanvik J. Contraction and
evacuation of the gallbladder studied simultaneously by ultra-sonography and 99mTc-labeled diethyl-iminodiacetic acid scin-tigraphy. Scand J Gastroenterol 1993; 28: 709-13.
14. Dodds WJ, Groh WJ, Darweesh RM, Lawson TL, Kishk SM, Kern MK. Sonographic measurement of gallbladder volume.
AJR Am J Roentgenol 1985; 145: 1009-11.
15. Everson G, Braverman D, Johnson M, Kern FJ. A critical evalu-ation of real-time ultrasonography for the study of gallbladder volume and contraction. Gastroenterology 1980; 79: 40-46. 16. Stolk MF, van Erpecum KJ, van Berge Henegouwen GP,
Kesselring OF, Hopman WP. Gallbladder volume and contrac-tion measured by sum-of-cylinders method compared with ellip-soid and area-length methods. Acta Radiol 1990; 31: 591-96. 17. Gilja OH, Thune N, Matre K, Hausken T, Odegaard S, Berstad A.
In vitro evaluation of three-dimensional ultrasonography in vol-ume estimation of abdominal organs. Ultrasound Med Biol 1994; 20: 157-65.
18. Scheffer RC, Gooszen HG, Wassenaar EB, Samsom M. Relation-ship between partial gastric volumes and dyspeptic symptoms in fundoplication patients: a 3D ultrasonographic study. Am J Gastroenterol 2004; 99: 1902-9.
between gastric accommodation and gastrointestinal sensations in healthy volunteers. A study using the barostat technique and two- and three-dimensional ultrasonography. Dig Dis Sci 2005; 50: 1654-60.
20. Hashimoto S, Goto H, Hirooka Y, Itoh A, Ishiguro Y, Kojima S, Hirai T, et al. An evaluation of three-dimensional
ultrasonogra-phy for the measurement of gallbladder volume. Am J
Gastroenterol 1999; 94: 3492-96.
21. Yoon HJ, Kim PN, Kim AY, Lee MG. Three-dimensional sonographic evaluation of gallbladder contractility: comparison with cholescintigraphy. J Clin Ultrasound 2006; 34: 123-27. 22. Pauletzki J, Althaus R, Holl J, Sackmann M, Paumgartner G.
Gallbladder emptying and gallstone formation: a prospective study on gallstone recurrence. Gastroenterology 1996; 111: 765-71.
23. van Erpecum K, vanBerge-Henegouwen G, Stolk M, Hopman W, Jansen J, Lamers C. Fasting gallbladder volume, postprandial emptying and cholecystokinin release in gallstone patients and normal subjects. J Hepatol 1992; 14: 194-202.