Serum lipids and chronic hepatitis C genotype 4:
interaction and significance
Mahmoud A. Khattab,* Mohammed Eslam,* Mayada M. Aly,* Mohammed Shatat,* Yousef I. Mousa,* Hesham Abd-Aalhalim,* Hanan Aly,** Yehia Shaker*
* Department of Internal Medicine, Minia University, Minia, Egypt. **Department of Internal Medicine, Beni-Suif University, Beni-Suif, Egypt.
ABSTRACT
Background & aim. Metabolic abnormalities are common in chronic hepatitis C infection (CHC). However, the genotypic differences of these disarrangements in patients infected with CHC genotype 4 (HCV-4) and its association with liver histology and viral loads remain unknown. Material and methods. We consecutive-ly enrolled 183 HCV-4 patients and 106 healthy matched controls; to compare metabolic profiles and assess pattern of association of HCV RNA levels as well as histological factors with the serum lipid profile. Results. HCV-4 infection is associated with higher homeostasis model assessment of insulin resistance (HOMA-IR) in-dex, despite that, a favourable lipid pattern, consisting of an elevation in HDL- C and a reduction in serum cholesterol (TC), LDL-C and triglyceride (TG) levels, in comparison with normal matched adults. Significant fibrosis was independently associated with HOMA-IR, portal/periportal inflammation grade, serum choles-terol and age. Univariate association was elucidated between lower LDL-C and TC and Metavir activity sco-re and between higher TG and TC and steatosis. In multivariate analysis, sevesco-re hepatitis activity, milder hepatic fibrosis, and triglyceride levels are associated with higher HCV RNA levels. Conclusion. HCV-4 is as-sociated with wide metabolic changes. A proportional relationship is found between serum lipid profiles and hepatitis C viral load and liver histology in patients with HCV-4.
Key words. Lipids. Hepatitis C virus. Genotype 4. Inflammation. Fibrosis. Viral load.
Correspondence and reprint request: Mahmoud Aboelneen Khattab M.D., Ph.D. Department of Medicine
Division of Gastroenterology and Hepatology, Minia University Minia 61111, Egypt
Tel.: +202 2519-7818, +208 6237-8181. Fax: +20 8624-2813 E-mail: [email protected]
Manuscript received: May 09, 2011. Manuscript accepted: August 20, 2011.
INTRODUCTION
Chronic hepatitis C (CHC) virus infects ~ 170 million individuals worldwide, and hepatitis C geno-type 4 (HCV-4) is the cause of ~ 20% of this num-ber.1 HCV-4 is common in the Middle East and in
Africa, where it is responsible for 80% of HCV infec-tions, and has recently spread to several European countries.1,2 Egypt has the highest prevalence of
HCV worldwide (15%)2 and the highest prevalence
of HCV-4, which is responsible for more than 90% of infections.2 HCV remains a major health concern
throughout the world. As the population exposed to
hepatitis C ages, the morbidity related to this disea-se is also increasing.
HCV infection can be considered not only as viral disease but also as a special type of metabolic disea-se. CHC interacts with lipid metabolism leading to steatosis, impairs glucose metabolism leading to in-sulin resistance (IR) and type 2 diabetes (T2DM), and is associated with an increased risk of carotid atherosclerosis.3,4 Accumulating clinical and
experi-mental evidence indicate that there is significant cross talk between HCV and host lipid metabolism. There is increasing evidence to indicate that the vi-rus uses the host lipoprotein machinery for its life cycle and dissemination. Recently owing to the ad-vances in in vitro model for HCV propagation, it has been demonstrated that lipid factors are linked to HCV RNA replication.5 The lipid rafts, scaffold for
HCV RNA replication, is made mainly by cholesterol and sphingolipid,6 and the lipid droplet, an organelle
for the storage of neutral lipids, is critical for pro-ducing infectious viruses.7 An interaction between
noted in clinical cases.8 These data suggest how
mo-lecules targeting lipid metabolism could improve HCV therapy.9
Different HCV genotypes are shown to have diffe-rent associations with hepatic steatosis. In particu-lar, in patients infected with genotype 3, steatosis is mostly virus-induced and often severe, correlates with intrahepatic viral load, and resolves after suc-cessful antiviral therapy.10,11 In contrast, in patients
infected with genotype 1, 4 steatosis is mainly asso-ciated with host metabolic factors and correlates with body mass index (BMI) and central adiposity.12
Moreover, recent clinical data suggest that HCV associated IR is genotype-dependent (1 and 4).13
Ta-king these lines of evidence together, we hypothesi-zed that there exist genotypic differences on the association of lipid profiles and HCV. Unfortunately, HCV-4 has simply not been the subject of wides-pread research and, the differential association of li-pid profiles with HCV viral load and histology between genotypes 4 infections remain largely unk-nown and deserves to be studied. We therefore con-ducted this prospective study to determine the serum lipid profile in patients with chronic HCV-4 infection, and to detect if there is any correlation between serum lipid levels and viral load, HCV geno-type or liver histology.
MATERIAL AND METHODS
Eligible patients
This prospective study was conducted between August 2009 and July 2010. One hundred eighty three eligible CHC and one hundred six matched healthy voluntaries were enrolled in this study.
Eligible patients were naive adults aged 18 years or older who had CHC based on the presence of anti-HCV and detectable serum HCV-RNA for 6 months or more, in combination with a liver biopsy obtained within 12 months of enrollment with fin-dings compatible with CHC using the Metavir sco-re.14 All patients were infected with HCV-4. The
exclusion criteria adopted in this study were pa-tients with T2DM diagnosed according to the Ameri-can Diabetes Association classification criteria;15
patients with other causes of liver disease, concomi-tant hepatitis B virus, or human immunodeficiency virus and Schistosoma co-infection; patients with autoimmune diseases, such as autoimmune hepati-tis; patients with alcohol intake > 40 g/day in the last 6 months before the liver biopsy. Patients who had clinical evidence of hepatic decompansation,
patient who have received antiviral treatment and those were taking any lipid lowering agents.
Informed consent
The study protocol was approved by the Institu-tional Ethics Committee of participating centers, and all patients gave informed consent to participate in this study. The study was conducted in accordan-ce with the ethical guidelines of the Declaration of Helsinki and International conference on Harmoni-zation Guidelines for Good Clinical Practice.
Clinical and laboratory assessment
The following data were collected at the time of li-ver biopsy: gender, age, daily alcohol intake in the past 6 months (g/day), route of HCV transmission, body mass index (BMI), waist circumference. BMI was calculated as weight divided by the square of the height (kg/m²). Overweight was defined as a BMI in the range of 25-29.9 kg/m² and obesity as a BMI ≥ 30 kg/m². Waist circumference was measured to the nearest 0.5 cm at the shortest point below the lower rib margin and the iliac crest.
• Laboratory tests. On the morning of the liverbo o t t e s biopsy, venous blood was drawn after a 12 h overnight fast to determine the serum levels of fasting blood glucose, triglyceride (TG), total cholesterol (TC), low density lipoprotein (LDL-C), high-density lipoprotein (HDL-(LDL-C), albumin, aspartate transaminase (AST), alanine transami-nase (ALT), gamma-glutamyl transpeptidase (GGT) levels, complete blood count, and differen-tial count, international normalized ratio, insu-lin, C-peptide, and adiponectin were collected.
measurements were used in the analyses. Hepatitis B surface antigen and anti-HCV were assayed with commercial kits (Abbott Laboratories, North Chica-go, IL, USA).
Virological assays
Serum HCV RNA was assessed by using Abbo-ttm2000 (lower limit of detection 12 IU/mL). Geno-typing of HCV was performed using either a line probe assay or reverse hybridization (InnoLipa; In-nogenetics, Genetics, Gent, Belgium). All samples were tested in triplicate.
Histopathology
Liver biopsy specimens were analyzed by a single experienced pathologist who was blinded to the cli-nical and biological data. Liver biopsy specimens not less than 15 mm in length or the presence of at least 10 complete portal tracts were required. Necroinfla-mmation and fibrosis were assessed using the Meta-vir score13. Necroinflammation activity (A) was graded as A0 (absent), A1 (mild), A2 (moderate), or A3 (severe). Fibrosis stage (F) was scored as F0 (ab-sent), F1 (portal fibrosis), F2 (portal fibrosis with few septa), F3 (septal fibrosis), and F4 (cirrhosis). Steatosis was assessed as the percentage of hepato-cytes containing macrovesicular fat droplets. It was graded as follows:
• 0 (absent, < 5% ). • 1 (moderate, 5-30%). • 2 (severe, > 30 %).
We chose to split them into two categories that reflect the absence (or a minimal amount) vs. the presence of larger amounts of steatosis.16
Case controls
• Healthy volunteers. One hundred six apparen-l y v l t . tly healthy volunteers were enrolled as controls after written informed consent was obtained. All had normal liver tests, negative serology for chronic viral hepatitis and no history of liver disease or T2DM.
Statistical analyses
Symmetrically distributed continuous variables were summarized as mean ± standard deviation
(SD). The median and interquartile ranges were used for skewed continuous variables. Categorical variables were presented as frequency and percen-tage. The baseline characteristics of the HCV-infec-ted patients were compared with matched controls by unpaired t-test or Mann-Whitney test for conti-nuous variables and by Chi squared test for catego-rical variables. Spearman rank correlation was used to quantify the association between continuo-us or ordered categorical variables. The differences in group distributions assessed using the Wilcoxon rank sum or a Kruskal-Wallis tests. In regression models, TG, HDL-C and TC were transformed to the natural logarithm (ln) scale to achieve normali-ty. Multiple ordinal regression with stepwise varia-ble selection was used to identify the independent predictors of steatosis, portal/periportal inflamma-tion and the fibrosis stage (ordered categorical va-riables). Linear regression was used to assess the significance of associations between variables with HCV RNA levels. Stepwise linear regression analy-sis (backward) was performed to examine the asso-ciation between HCV RNA levels and lipid profiles. SPSS software for Windows version 12 (SPSS Inc., Chicago, IL) was used to perform all analyses. Two tailed tests with a 5% level of significance were used throughout.
RESULTS
Demographic, biochemical and metabolic characteristics of HCV-infected patients
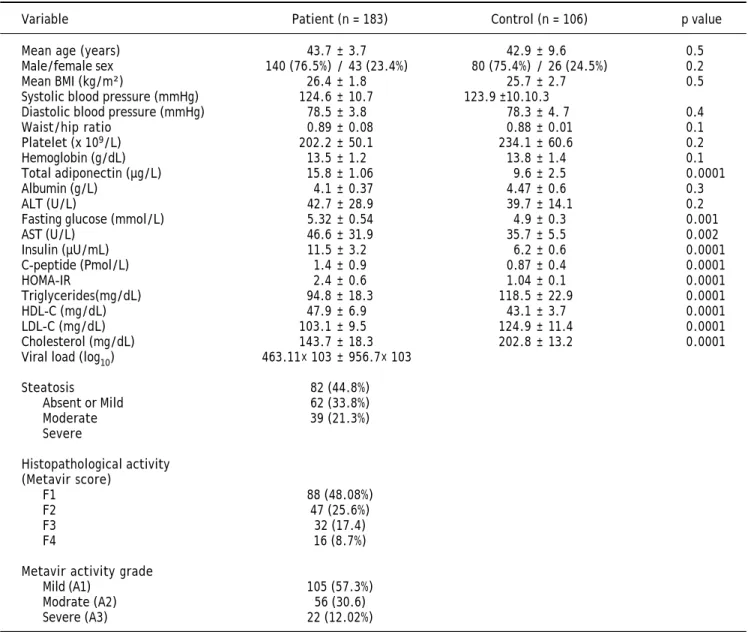
The demographic, biochemical, metabolic and his-tological characteristics of 183 patients with chronic HCV-4 are detailed in table 1. The mean age was 43.7 ± 3.7 years (range 21-57 years), the mean BMI was 26.4 ± 1.8 kg/m² (range 20-35 kg/m²) and the mean waist/hip ratio was 0.89 ± 0.08.
Lipid profile and insulin resistance
Table 1. Characteristics of patients chronically infected with HCV.
Variable Patient (n = 183) Control (n = 106) p value
Mean age (years) 43.7 ± 3.7 42.9 ± 9.6 0.5
Male/female sex 140 (76.5%) / 43 (23.4%) 80 (75.4%) / 26 (24.5%) 0.2
Mean BMI (kg/m²) 26.4 ± 1.8 25.7 ± 2.7 0.5
Systolic blood pressure (mmHg) 124.6 ± 10.7 123.9 ±10.10.3
Diastolic blood pressure (mmHg) 78.5 ± 3.8 78.3 ± 4. 7 0.4
Waist/hip ratio 0.89 ± 0.08 0.88 ± 0.01 0.1
Platelet (x 109/L) 202.2 ± 50.1 234.1 ± 60.6 0.2
Hemoglobin (g/dL) 13.5 ± 1.2 13.8 ± 1.4 0.1
Total adiponectin (µg/L) 15.8 ± 1.06 9.6 ± 2.5 0.0001
Albumin (g/L) 4.1 ± 0.37 4.47 ± 0.6 0.3
ALT (U/L) 42.7 ± 28.9 39.7 ± 14.1 0.2
Fasting glucose (mmol/L) 5.32 ± 0.54 4.9 ± 0.3 0.001
AST (U/L) 46.6 ± 31.9 35.7 ± 5.5 0.002
Insulin (µU/mL) 11.5 ± 3.2 6.2 ± 0.6 0.0001
C-peptide (Pmol/L) 1.4 ± 0.9 0.87 ± 0.4 0.0001
HOMA-IR 2.4 ± 0.6 1.04 ± 0.1 0.0001
Triglycerides(mg/dL) 94.8 ± 18.3 118.5 ± 22.9 0.0001
HDL-C (mg/dL) 47.9 ± 6.9 43.1 ± 3.7 0.0001
LDL-C (mg/dL) 103.1 ± 9.5 124.9 ± 11.4 0.0001
Cholesterol (mg/dL) 143.7 ± 18.3 202.8 ± 13.2 0.0001
Viral load (log10) 463.11× 10³ ± 956.7× 10³
Steatosis 82 (44.8%)
Absent or Mild 62 (33.8%)
Moderate 39 (21.3%)
Severe
Histopathological activity (Metavir score)
F1 88 (48.08%)
F2 47 (25.6%)
F3 32 (17.4)
F4 16 (8.7%)
Metavir activity grade
Mild (A1) 105 (57.3%)
Modrate (A2) 56 (30.6)
Severe (A3) 22 (12.02%)
an elevation in HDL-C (47.9 ± 6.9 vs. 43.1 ± 3.7; p = 0.0001) compared with the controls (Figure 1). Total adiponectin were significantly higher among cases than among controls (15.8 ± 1.06 µg/L vs. 9.6 ± 2.5 µg/L; p < 0.0001) (Table 1).
Liver histology
Complete histological analysis for portal/peripor-tal inflammatory grade, and fibrosis stage were avai-lable in all cases. Fibrosis was stage 1 in 88 (48.08%), stage 2 in 47 (25.6%) and stage 3 in 32 (17.4%). Cirrhosis (stage 4 fibrosis) was present in 16 (8.7%) patients. Inflammation were mild A1 in 105 (57.3%), moderate A2 in 56 (30.6%) and severe
22 (12.02%). 82 patients (44.8%) exhibit no or mild steatosis; moderate and severe steatosis was present in 101 subjects: moderate in 62 (33.8%) and severe in 39 (21.3%).
Factors associated with the severity of histological lesions in
chronic HCV-4 infection
aaaaaa aaaaaa aaaaaa aaaaaa aaaaaa aaaaaa aaaaaa aaaaaa aaaaaa aaaaaa aaaaaa aaaaaa aaaaaa aaaaaa aaaaaa aaaaaa aaaaaa aaaaaa aaaaaa aaaaaa aaaaaa aaaaaa aaaaaa aaaaaa aaaaaa aaaaaa aaaaaa aaaaaa aaaaaa aaaaaa aaaaaa aaaaaa aaaaaa aaaaaa aaaaaa aaaaaa aaaaaa aaaaaa aaaaaaaaaaa aaa a aaaaa aaaaa aaaaa aaaaaa aaaaaa aaaaaa aaaaaaaaaaa aaaaaa aaaaaa aaaaaa aaaaaa aaaaaa aaaaaa aaaaaa aaaaaa aaaaaa aaaaaa aaaaaa aaaaaa aaaaaa aaaaaa aaaaaa aaaaaa aaaaaa aaaaaa aaaaaa aaaaaa aaaaaa aaaaaa aaaaaa aaaaaa aaaaaa aaaaaa aaaaaa aaaaaa aaaaaa aaaaaa aaaaaa aaaaaa aaaaaa aaaaaa aaaaaa aaaaaa aaaaaa aaaaaa aaaaaa aaaaaa aaaaaa aaaaaa aaaaaa aaaaaa aaaaaa aaaaaa aaaaaa aaaaaaa aaaaaaaa aaaaaaaa aaaaaaaa a a a a
Figure 1. Serum lipid levels (mg/dL) in patients with chro-nic hepatitis C virus (HCV) vs. healthy donors. TC: total cho-lesterol. HDL-C: high-density lipoprotein chocho-lesterol. LDL-C: low-density lipoprotein cholesterol. TG: triglycerides.
250 200 150 100 50 0
Cholesterol HDL-C LDL-C Triglycerides
Figure 2. Relationship between triglyceride (TG) and hepa-titis C virus (HCV) RNA levels.
7
6
5
4
3
1.5 2.0 2.5 3.0 3.5 4.0
Log10 (triglyceride)
Log HCV/Fitted value
r = 0.32; p = 0.01
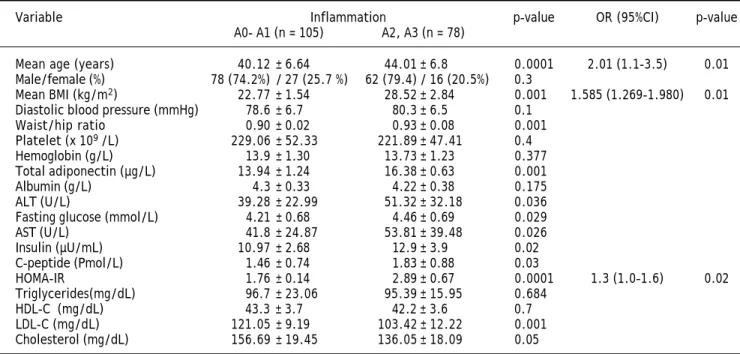
Table 2. Univariate and multivariate analyses for the factors associated with severe inflammation in patients with hepatitis C virus genotype 4 (HCV-4).
Variable Inflammation p-value OR (95%CI) p-value A0- A1 (n = 105) A2, A3 (n = 78)
Mean age (years) 40.12 ± 6.64 44.01 ± 6.8 0.0001 2.01 (1.1-3.5) 0.01 Male/female (%) 78 (74.2%) / 27 (25.7 %) 62 (79.4) / 16 (20.5%) 0.3
Mean BMI (kg/m2) 22.77 ± 1.54 28.52 ± 2.84 0.001 1.585 (1.269-1.980) 0.01
Diastolic blood pressure (mmHg) 78.6 ± 6.7 80.3 ± 6.5 0.1
Waist/hip ratio 0.90 ± 0.02 0.93 ± 0.08 0.001
Platelet (x 109 /L) 229.06 ± 52.33 221.89 ± 47.41 0.4
Hemoglobin (g/L) 13.9 ± 1.30 13.73 ± 1.23 0.377
Total adiponectin (µg/L) 13.94 ± 1.24 16.38 ± 0.63 0.001
Albumin (g/L) 4.3 ± 0.33 4.22 ± 0.38 0.175
ALT (U/L) 39.28 ± 22.99 51.32 ± 32.18 0.036
Fasting glucose (mmol/L) 4.21 ± 0.68 4.46 ± 0.69 0.029
AST (U/L) 41.8 ± 24.87 53.81 ± 39.48 0.026
Insulin (µU/mL) 10.97 ± 2.68 12.9 ± 3.9 0.02
C-peptide (Pmol/L) 1.46 ± 0.74 1.83 ± 0.88 0.03
HOMA-IR 1.76 ± 0.14 2.89 ± 0.67 0.0001 1.3 (1.0–1.6) 0.02
Triglycerides(mg/dL) 96.7 ± 23.06 95.39 ± 15.95 0.684
HDL-C (mg/dL) 43.3 ± 3.7 42.2 ± 3.6 0.7
LDL-C (mg/dL) 121.05 ± 9.19 103.42 ± 12.22 0.001
Cholesterol (mg/dL) 156.69 ± 19.45 136.05 ± 18.09 0.05 and portal/periportal inflammatory grades, fibrosis
stage, fasting blood glucose, insulin, HOMA-IR, adi-ponectin, and lipid profiles (such as TG, TC, LDL-C, HDL-C).
Patients with significant steatosis had higher BMI, HOMA values, serum triglyceride levels, cho-lesterol level, elevated systolic hypertension, eleva-ted diastolic hypertension, larger waist/hip ratio and
lower serum adiponectin levels than those with mild or absent steatosis (p < 0.05). By multiple ordinal regression analysis, a higher steatosis amount were positively and independently associated with BMI (OR; 1.5, 95% CI: 0.6-2.8; p = 0.03) and HOMA-IR (OR; 2.2, 95% CI: 1.2-4; p = 0.011), whereas a nega-tive independent correlation was observed with serum levels of adiponectin (OR; 2.8, 95% CI: 1.8-4.3; p = 0.01) (Table 4).
Patients with severe inflammation had higher age, BMI, HOMA values, serum adiponectin levels,
AST, ALT and larger waist/hip ratio and lower LDL-C and cholesterol level than those with mild hepatic inflammation (p < 0.05). By multiple ordi-nal regression aordi-nalysis, age, BMI, HOMA-IR were independently predicting increasing grades of portal/ periportal inflammation (Table 2).
Patients with severe fibrosis had higher age, BMI, HOMA values, serum adiponectin levels, larger waist/hip ratio, more severe hepatitis activity and lo-wer HDL-C and cholesterol level than those with mild hepatic fibrosis (p < 0.05). By multiple ordinal regression analysis, HOMA-IR, portal/periportal in-flammation grade, serum cholesterol and age were independently predicted severity of the stage of fibro-sis (Table 3).
Variables associated with HCV viral load
Using a Spearman’s rank correlation analysis, significant indirect direct relationships were found between the natural logarithm (ln) of TG and log10 viral level (r = 0.32, p = 0.01) (Figure 2). Unite analysis between demographic, biochemical
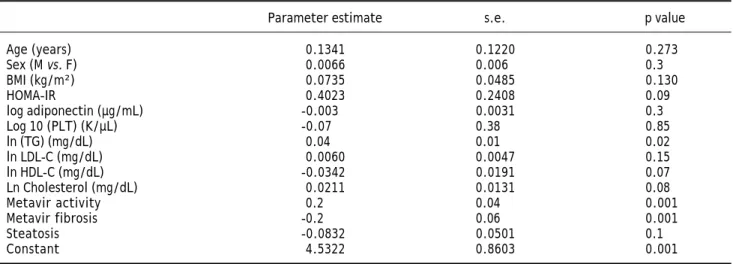
varia-bles and HCV RNA levels was done. Stepwise linear regression analyses were performed to examine the association between HCV RNA levels and lipid profi-les. The probable correlates of HCV viral load and li-pid profiles (such as TG, TC, LDL, HDL), fasting blood glucose, HOMA-IR index, hepatic inflamma-tion score, hepatic fibrosis score, hepatic steatosis score, PLT, AST, ALT, age, sex, and BMI) were se-lected in a stepwise approach and included into the multivariate models after adjustment for HOMA-IR index, age, gender, and BMI. The analysis showed that more severe hepatitis activity, milder hepatic fi-brosis and TG level (p < 0.05) were significantly as-sociated with higher HCV RNA levels (Table 5).
DISCUSSION
Although in vitro and in vivo studies have de-monstrated the associations between lipid/glucose/ insulin metabolism and HCV infection, and raised assumptions for a potential benefit of lipid-lowering drugs in the control of HCV replication,4,17-18 little
is known about the differential association of lipid
Table 3. Univariate and multivariate analyses for the factors associated with severe fibrosis (Metavir score > F2) in patients with hepatitis C virus genotype 4 (HCV-4).
Variable Fibrosis p-value OR (95%CI) p-value F1, F2 (n = 135) F3, F4 (n = 48)
Mean age (years) 40.5 ± 6.9 42.7 ± 6.3 0.04 1.066 (0.972-1.001) 0.003 Male/female (%) 105 (77.7%) / 30 (22.2%) 35(72.9%) / 13 (27.08%) 0.3
Mean BMI (kg/m2) 24.06 ± 2.5 31.5 ± 1.8 0.0001
Systolic blood pressure (mm/Hg) 120.7 ± 10.4 121.5 ± 10.9 0.8 Diastolic blood pressure (mm/Hg) 79.2 ± 5.7 81.3 ± 5.5 0.1
Waist/hip ratio 0.91 ± 0.2 0.95 ± 0.8 0.0001
Platelet (X 109 /L) 224.5 ± 50.6 206.9 ± 51.5 0.1
Hemoglobin (g/dL) 13.8 ± 1.3 13.6 ± 1.3 0.3
Total adiponectin (µg/L) 12.6 ± 0.7 15.85 ± 1.06 0.0001
Albumin (g/L) 4.3 ± 0.4 4.2 ± 0.5 0.4
ALT (U/L) 42.7 ± 33.2 53 ± 34.8 0.2
Fasting glucose (mmol/L)) 4.2 ± 0.7 4.3 ± 0.6 0.01
AST (U/L) 44.3 ± 28.9 55.6 ± 45.3 0.22
Insulin (µU/mL) 11.05 ± 3.2 17.6 ± 4.2 0.0001
C-peptide (Pmol/L) 1.3 ± 0.8 2.1 ± 0.8 0.0001
HOMA-IR 2 ± 0.4 3.6 ± 0.6 0.0001 1.271 (1.109-1.506) 0.001
Triglycerides (mg/dL) 102.8 ± 22.6 94.8 ± 18.3 0.08
HDL-C (mg/dL) 42.9 ± 3.6 34.1 ± 3.7 0.04
LDL-C (mg/dL) 103.6 ± 13.1 104.2 ± 10.05 0.8
Cholesterol (mg/dL) 152.5 ± 22.07 141.7 ± 18.5 0.05 0.03 (0.00-0.46) 0.01
Steatosis (Absent or 63 (46.6%)/ 19 (39.5%)/ 0.07 mild vs. moderate or severe) 72 (53.3%) 29 (60.4 %)
Necroinflammatory score 95 (70.3%) 10 (20.8%) 0.0001 1.397(1.097-1.780) 0.007
(A1, A2, A3)(%) 37 (27.4%) 19 (39.5 %)
profiles with HCV viral load, HCV-induced liver da-mage and steatosis between genotypes 4 infections. This study shows in a single population, that chro-nic HCV-4 infection is associated with glucose into-lerance and, despite that, a favourable lipid pattern, consisting of an elevation in HDL-C and a reduction in TC, LDL-C and TG, in comparison with normal adults matched for age and sex. This combination of favorable lipids and diabetes is unusual, as the con-ventional metabolic syndrome, a constellation of risk factors for atherosclerosis, includes, among
Table 4. Univariate and multivariate analyses for the factors associated with hepatic steatosis in patients with hepatitis C virus genotype 4 (HCV-4).
Variable Steatosis Steatosis OR (95%CI) p-value Absent or mild Moderate or severe
(n = 82) (n = 101)
Mean age (years) 41.4 ± 6.6 43 ± 7.1 0.3
Male/Female (n, %) 62 (75.6%) / 20 (24.3%) 78 (77.2%) / 23 (22.7%) 0.7
Mean BMI (kg/m2) 22.8 ± 1.5 26.9 ± 3.6 0.0001 1.5 (0.6–2.8) 0.03
Systolic blood pressure (mm/Hg) 119.2 ± 9.5 123.6 ± 11.2 0.01 Diastolic blood pressure (mm/Hg) 78.4 ± 5.2 80.4 ± 6.06 0.02
Waist/hip ratio 0.90 ± 0.03 0.95 ± 0.6 0.0001
Platelet (x 109 /L) 228.9 ± 50.9 216.5 ± 50.9 0.2
Hemoglobin (g/dL) 13.7 ± 1.2 13.9 ± 1.3 0.2
Total adiponectin (µg/L) 16.4 ± 0.6 14.6 ± 1.5 0.0001 2.8 (1.8–4.3) 0.01
Albumin (g/L) 4.3 ± 0.4 4.2 ± 0.5 0.1
ALT (U/L) 46.7 ± 20.5 50.3 ± 40.4 0.2
Fasting glucose (mmol/L) 4.2 ± 0.7 4.3 ± 0.6 0.1
AST (U/L) 47.1 ± 16.2 51.4 ± 38.7 0.09
Insulin (µU/ml) 10.07 ± 2.6 13.5 ± 4.3 0.0001
C-peptide (Pmol/L) 1.1 ± 0.7 1.7 ± 0.8 0.0001
HOMA-IR 1.6 ± 0.2 3.2 ± 0.4 0.02 2.2 (1.2-4) 0.011
Triglycerides(mg/dL) 76.1 ± 17.4 97.4 ± 20.3 0.03
HDL-C (mg/dL) 43.6 ± 3.7 42.6 ± 3.6 0.1
LDL-C (mg/dL) 102.8 ± 9.3 105.1 ± 11.2 0.1
Cholesterol (mg/dL) 138.7 ± 17.3 150.1 ± 19.2 0.0001
Viral load 354.7× 10³± 890.4× 10³ 574.5× 10³± 100.3× 10³ 0.1
Table 5. Multivariate analysis identifying factors associated with HCV RNA levels in 183 chronic hepatitis C patients.
Parameter estimate s.e. p value
Age (years) 0.1341 0.1220 0.273
Sex (M vs. F) 0.0066 0.006 0.3
BMI (kg/m²) 0.0735 0.0485 0.130
HOMA-IR 0.4023 0.2408 0.09
log adiponectin (µg/mL) -0.003 0.0031 0.3
Log 10 (PLT) (K/µL) -0.07 0.38 0.85
ln (TG) (mg/dL) 0.04 0.01 0.02
ln LDL-C (mg/dL) 0.0060 0.0047 0.15
ln HDL-C (mg/dL) -0.0342 0.0191 0.07
Ln Cholesterol (mg/dL) 0.0211 0.0131 0.08
Metavir activity 0.2 0.04 0.001
Metavir fibrosis -0.2 0.06 0.001
Steatosis -0.0832 0.0501 0.1
Constant 4.5322 0.8603 0.001
others, an atherogenic lipid profile, glucose intole-rance and IR.19 Whether the protective effect of
hypolipidemia seems to be not counterbalancing the effect of IR in the pathogenesis of atherosclerosis among HCV infected individuals, as higher grades of carotid intimal thickness was reported in HCV pa-tients comparing with healthy matched control.20
These findings are in line with previous reports in other HCV genotypes.21-23 A decrease in TG levels
mat-ched control.24 The mechanisms by which HCV
in-fection may lower serum TC are still speculative and may include, among others, the binding of HCV par-ticles to HDL-C, LDL-C and very low density lipo-protein (VLDL)25,26 and the impaired hepatocytic
assembly of VLDL through inhibition of the micro-somal transfer protein27 or through depletion of the
intra hepatocyte intermediate fatty acids as mevalo-nic28 acids and geranylgeranyl lipid required for
HCV RNA replication and formation of HCV core proteins.28 In vitro and in vivo data suggest that
statins, the widely used cholesterol-lowering drugs, may inhibit HCV RNA replication by depletion of ge-ranylgeranyl lipids. 5,9
Considering the associations between liver histo-logy and lipid profiles in HCV-4 patients, the univa-riate analysis show a close relationship among age, BMI, HOMA values, serum adiponectin levels, lar-ger waist/hip ratio, more severe hepatitis activity and lower HDL-C and cholesterol level with advan-ced hepatic fibrosis. HOMA-IR, portal/periportal in-flammation grade, serum cholesterol and age were independently associated with severe fibrosis. Uni-varite association was elucidated between hepatic inflammation and lower TC and LDL-C levels and with higher age, BMI, HOMA values, serum adipo-nectin levels, AST, ALT and larger waist/hip ratio. Age, BMI and HOMA-IR were independently correla-ted with the grades of portal/periportal inflamma-tion. These findings are consistent with other findings from both non-HCV-infected29 and
chroni-cally HCV-infected groups21,22 that have associated
liver disease with lower levels of HDL-C and TC. A higher grading score means more severe inflamma-tion, elevated serum levels of cytokines and hypo-cholesterolaemia, through a reduction of LDL-C.30
Upon that, the inverse relationship between liver di-sease and non-TG lipid profile measures may reflect the disruption of lipid and lipoprotein metabolism because of liver damage, either by host factors (e.g. poor nutrient intake or excess loss of body weight) or attributed to chronic HCV infection which use the host lipoprotein machinery for its life cycle.31
In contrast, analysis of factors associated with severe steatosis showed that steatosis was associa-ted with higher BMI, HOMA values, serum triglyce-ride levels, cholesterol level, elevated systolic hypertension, elevated diastolic hypertension, larger waist/hip ratio and lower serum adiponectin levels. Steatosis was positively and independently associa-ted with BMI and HOMA-IR, whereas a negative in-dependent correlation was observed with serum levels of adiponectin. These findings are in line with
our previous data that steatosis is posited to occur because of metabolic changes in HCV-4 infection, and follows the same pattern as those infected with genotype 1.11 In a transgenic mouse model, the HCV
core protein was found to inhibit MTP activity; this enzyme plays a key rate-limiting role in VLDL as-sembly.26 Thus, its inhibition would lead to the
accumulation of TG otherwise uploaded onto VLDL, and the morphological counterpart of this would be hepatocyte steatosis. This mechanism is supported by two epidemiological studies, which found inverse relationships between steatosis and TC, TG, and apolipoprotein B levels in a genotype 3-infected group, but not in genotype 1.8,22
Taken together, the findings indicate that in pa-tients with HCV-4 steatosis is associated with the presence of host metabolic risk factors for steatosis (such as obesity, IR and hyperlipidemia), which is associated with more progression of liver disease. With increase the severity of hepatic inflammation and fibrosis the elevated serum levels of cytokines are associated with hypolipidemia.
Another finding of this study was the correlation between HCV viral load and TG levels, the latter of which is mainly present in VLDL, and thus streng-thened the hypothesis that HCV infection can direc-tly link to lipid metabolism in the clinical setting. This is relevant to findings from in vitro work about the proposed biological mechanisms and lipid involvement in HCV entry, replication and secretion from hepatocytes.26,32-35 Our results may imply a
possible assistant role of these lipid factors on HCV-4 virions life cycle. The eradication of HCV genoty-pe 1 was associated with elevation of serum TC levels above baseline.36 No similar data are available
in HCV-4.
This study has undoubtedly some limitations. Gi-ven the cross-sectional nature of this analysis, it is not possible to infer causation or temporality of re-lationships between lipid profile and liver disease measures. Further studies with longitudinal design and paired controls are needed to elucidate possible causal relationships.
CONCLUSION
in-jury. These findings strengthened the hypothesis that HCV infection directly links to metabolic de-rangements but differently among HCV genotypes in the clinical setting. Further studies are required to clarify the temporal relation with antiviral treat-ment and the clinical implication of these findings.
DISCLOSURE OF CONFLICT OF INTEREST
Financial support: None.
Potential competing interests: None.
REFERENCES
1. World Health Organization. Hepatitis C. Fact Sheet Num-ber 164, Revised OctoNum-ber 2000. Available from: http:// www.who.int/mediacentre/factssheets/fs164len [Acces-sed 13 October 2010].
2. Khattab MA, Ferenci P, Hadziyannis SJ, Colombo M, Manns MP, Almasio PL, Esteban R, et al . Management of hepatitis C virus genotype 4: Recommendations of An International Expert Panel. J Hepatol 2011; 54: 1250-62.
3. Ishizaka Y, Ishizaka N, Takahashi E, Unuma T, Tooda E, Hashimoto H, Nagai R, et al. Association between hepati-tis C virus core protein and carotid atherosclerosis. Circ J 2003; 67: 26-30.
4. Eslam M, Khattab MA, Harrison SA. Insulin resistance and hepatitis C: an evolving story. Gut 2011; 60: 1139-51. 5. Kapadia SB, Chisari FV. Hepatitis C virus RNA replication is
regulated by host geranylgeranylation and fatty acids. Proc Natl Acad Sci USA 2005; 102; 2561-6.
6. Ikeda M, Kato N. Life style-related diseases of the digesti-ve system: cell culture system for the screening of anti-hepatitis C virus (HCV) reagents: suppression of HCV replication by statins and synergistic action with interfe-ron. J Pharmacol Sci 2007; 105: 145-50.
7. Miyanari Y, Atsuzawa K, Usuda N, Watashi K, Hishiki T, Za-yas M, Bartenschlager R, e t al. Lipid droplet is an impor-tant organelle for hepatitis C virus production. Nat Cell Biol 2007; 9: 1089-97.
8. Serfaty L, Andreani T, Giral P, Carbonell N, Chazouillères O, Poupon R. Hepatitis C virus induced hypobetalipopro-teinemia: a possible mechanism for steatosis in chronic hepatitis C. J Hepatol 2001; 34: 428-34.
9. Bader T, Fazili J, Madhoun M, Aston C, Hughes D, Rizvi S, Seres K, et al. Fluvastatin inhibits hepatitis C replication in humans. Am J Gastroenterol 2008; 103: 1383-9. 10. Poynard T, Ratziu V, McHutchison J, Manns M, Goodman Z,
Zeu-zem S, Younossi Z, et al. Effect of treatment with peginterferon or interferon alpha-2b and ribavirin on steatosis in patient in-fected with hepatitis C. Hepatology 2003; 38: 75-85.
11. Hui JM, Kench J, Farrell GC, Lin R, Samarasinghe D, Liddle C, Byth K, et al. Genotype-specific mechanisms for hepatic steatosis in chronic hepatitis C infection. J Gastroenterol Hepatol 2002; 17: 873-81.
12. Khattab MA, Abdel-Fattah ME, Eslam M, Abdelaleem A, Ab-delaleem RA, Shatat M, Ali A, et al. Hepatic steatosis in ge-notype 4 chronic hepatitis C patients: implication for therapy. J Clin Gastroenterol 2010; 44: 707-12.
13. Moucari R, Asselah T, Cazals-Hatem D, Voitot H, Boyer N, Ripault MP, Sobesky R, et al. Insulin resistance in chronic hepatitis C: association with genotypes 1 and 4, serum
HCV RNA level, and liver fibrosis. Gastroenterology 2008; 134: 416-23.
14. Bedossa P, Poynard T. An algorithm for the grading of ac-tivity in chronic hepatitis C. The METAVIR Cooperative Study Group. Hepatology 1996; 24: 289-93.
15. American Diabetes Association. Diagnosis and classifica-tion of diabetes mellitus. Diabetes Care 2004; 27(Suppl. 1): s5-s10.
16. Brunt EM, Janney CG, Di Bisceglie AM, Neuschwander-Te-tri BA, Bacon BR. Nonalcoholic steatohepatitis: a proposal for grading and staging the histological lesions. Am J Gas-troenterol 1999; 94: 2467-74.
17. Harrison SA, Rossaro L, Hu KQ, Patel K, Tillmann H, Dhaliwal S, Torres DM, et al. Serum cholesterol and statin use pre-dict virological response to peginterferon and ribavirin therapy. Hepatology 2010; 52: 864-74.
18. Negro F, Sanyal AJ. Hepatitis C virus, steatosis and lipid abnormalities: clinical and pathogenic data. Liver Int 2009; 29(Suppl. 2): 26-37.
19. Expert Panel on Detection, Evaluation, and Treatment of High Blood Cholesterol in Adults. Exec. Summary of the National Cholesterol Education Program (NCEP) Expert Panel on Detec-tion, Evaluation and Treatment of High Blood Cholesterol in Adults (Adult Treatment Panel III). JAMA 2001; 285: 2486-97. 20. Aslam F, Alam M, Lakkis NM. Hepatitis C and carotid
athe-rosclerosis: a retrospective analysis. Atherosclerosis 2010; 209(2): 340-3.
21. Siagris D, Christofidou M, Theocharis GJ, Pagoni N, Papa-dimitriou C, Lekkou A, Thomopoulos K, et al. Serum lipid pattern in chronic hepatitis C: histological and virological correlations. J Viral Hepat 2006; 13: 56-61.
22. Ramcharran D, Wahed AS, Conjeevaram HS, Evans RW, Wang T, Belle SH, Yee LJ. Serum lipids and their associatio-ns with viral levels and liver disease severity in a treat-ment-naïve chronic hepatitis C type 1-infected cohort. J Viral Hepat 2011; 18: e144-e152.
23. Petit JM, Benichou M, Duvillard L, Jooste V, Bour JB, Minello A, Verges B, et al. Hepatitis C virus-associated hypobetali-poproteinemia is correlated with plasma viral load, steatosis, and liver fibrosis. Am J Gastroenterol 2003; 98: 1150-4. 24. Marzouk D, Sass J, Bakr I, El Hosseiny M, Abdel-Hamid M,
Rekacewicz C, Chaturvedi N, et al. Metabolic and cardio-vascular risk profiles and hepatitis C virus infection in ru-ral Egypt. Gut 2007; 56: 1105-10.
25. Thomssen R, Bonk S, Thiele A. Density heterogeneities of hepatitis C virus in human sera due to the binding of beta-lipoproteins and immunoglobulins. Med Microbiol Immunol 1993; 182: 329-34.
26. Thomssen R, Bonk S, Propfe C, Heermann KH, Köchel HG, Uy A. Association of hepatitis C virus in human sera with B-lipoprotein. Med Microbiol Immunol 1992; 181: 293-300. 27. Perlemuter G, Sabile A, Letteron P, Vona G, Topilco A, Chrétien Y, Koike K, et al. Hepatitis C virus core protein inhibits microsomal triglyceride transfer protein activity and very low density lipoprotein secretion: a model of vi-ral-related steatosis. FASEB J 2002; 16: 185e94.
28. Goldstein JL, Brown MS. Regulation of the mevalonate pa-thway. Nature 1990; 343: 425-30.
29. Kotronen A, Westerbacka J, Bergholm R, Pietiläinen KH, Yki-Järvinen H. Liver fat in the metabolic syndrome. J Clin Endocrinol Metab 2007; 92: 3490-7.
30. Hardardottir I, Grunfeld C, Feingold KR. Effects of endo-toxin and cytokines on lipid metabolism. Curr Opin Lipidol 1994; 5: 207-15.
32. Ye J. Reliance of host cholesterol metabolic pathways for the life cycle of hepatitis C virus. PLoS Pathog 2007; 3: e108.
33. von Hahn T , Rice CM. Hepatitis C virus entry. J Biol Chem 2008; 283: 3689-93.
34. Fanning L, Kenny E , Sheehan M, Cannon B, Whelton M, O’Connell J, Collins JK, et al. Viral load and clinicopatholo-gical features of chronic hepatitis C (1b) in a homoge-neous patient population. Hepatology 1999; 29: 904-7.
35. Gastaminza P, Cheng G, Wieland S, Zhong J, Liao W, Chisa-ri FV. Cellular determinants of hepatitis C virus assembly, maturation, degradation and secretion. J Virol 2007; 82: 2120-9.