Comparison of model estimates of
phase two on-transient
V
O
2uptake
kinetics during submaximal exercise in old men
Javier Padilla,*,** John M. Kowalchuk,**,*** Albert W. Taylor,**,**** Donald H. Paterson**,****
* Escuela Superior de Medicina del Instituto Politécnico Nacional. ** Canadian Centre for Activity and Ageing, School of Kinesiology. *** Department of Physiology and Faculties of Health Sciences &
**** Medicine and Dentistry, The University of Western Ontario, London, Ontario, Canada N6A 3K7.
RESUMEN
Introducción. El análisis cinético de las respuestas transitorias de captación pulmonar de oxígeno (VO2) durante ejercicio moderado (MOD) e intenso (INT) (MOD + INT = SUB) fueron comparados con estrategias comunes de modelado para evaluar
el mejor. Material y métodos. Comparamos el parámetro estimado constante de tiempo para la fase 2 de VO2 (τΦ2VO2) en adultos mayores (n = 9; 71(± 5) años; media (± DE)). Estos hicieron una prueba de rampa (12 W•min-1) hasta el límite de su tolerancia para determinar el VO2pico y estimar el umbral láctico (qL). También hicieron ejercicio de carga constante a 50
Watts (MOD) y a 80% (MOD) y 120% qL (INT). Cada transición de cada carga duró 6 min, fue precedida por 6 min de pedaleo a una línea de base de 20 W y se repitió de 4 a 6 veces por intensidad. El VO2 se medió de respiración por respiración. Los datos de cada transición fueron filtrados, interpolados a intervalos de 1 s y promediados en ensamblado para obtener un perfil de respuesta única por persona e intensidad y ajustados con regresión no lineal a base de modelos exponenciales de uno (1C; ventana apropiada desde 0.3333 min MOD hasta su final o hasta la fase de transición 2 3 INT), dos (2C) y tres componentes (3C) desde el inicio hasta el final del ejercicio. Además, los datos fueron colocados en “bins” discretos de tiempo de 10 s (10 s bins) para modelarlos con 1C. Resultados. El 1C,4P0.3333 → 3 min fue el más apropiado para modelar la Φ2VO2 SUB y distinguir τΦ2VO2. Los datos de la Φ2VO2 fueron fisiológicamente mejor modelados con 2C,7PLíneaBasal_Inicio hasta FinalEjercicio
MOD y 3C,10PLíneaBasal_Inicio hasta FinalEjercicioINT y, permitieron describir dentro del modelado la τΦ2VO2. Estas τΦ2VO2 fueron similares entre ellas en nuestros voluntarios (media general ± DE: τdatos deVO2 segundo-por-segundo= 46 ± 15 s, τdatos de VO2 10-s bins=
43 ± 7 s).
Palabras clave: Adultos mayores, cinética de la captación de O2, fase dos del O2; modelado exponencial, constante de tiempo.
ABSTRACT
Introduction. The kinetic analysis of the VO2 on transient response during moderate (MOD) and heavy (HVY) intensity (MOD+HVY = SUB) exercise was compared by using several common modelling strategies to assess the best one. Material and methods. We compared the parameter estimate for the phase 2 VO2 time constant (τΦ2VO2) in older male adults (n = 9; 71 (± 5) yrs; mean (± sd)). Subjects performed an incremental ramp test (12 W•min-1) to the limit of tolerance to determine VO
2peakand the
estimated lactate threshold (qL). Constant load cycle exercise was performed at 50 W (MOD) and work rates corresponding to 80% (MOD) and 120% qL(HVY). Each transition in work rate lasted 6 min and was preceded by 6 min cycling at a baseline of 20 W; transitions at each intensity were repeated 4 6 times. VO2 was measured breath by breath. Data from each transition were filtered, interpolated to 1 s intervals and ensemble averaged to yield a single response profile for each subject and intensity. Responses were modelled by means of nonlinear regression techniques with one (1C; fitting window 0.3333 min from exercise onset to either end MOD or phase 2 3 transition HVY), two (2C) and three component (3C) (fitting window from start exercise to end exercise) exponential models. In addition to this, data were placed into discrete time bins of 10 s (10 s bins VO2 data) to be modelled using 1C exponential model. Results. The 1C,4P0.3333 → 3 min best fitted Φ2VO2 data for SUB and allowed us to characterize τΦ2VO2. The Φ2VO2 data were physiologically best fitted with models 2C,7PBaseLine_Start to End exercise for MOD and 3C,10PBaseLine_Start to Endfor HVY and they allowed us an intra modelling characterization of the τΦ2VO2. These τΦ2VO2 were similar to each other in our old male volunteers (Overall mean ± SD: τsecond-by-second VO2 data= 46 ± 15 s, τ10-s bins VO2 data= 43 ± 7 s).
INTRODUCTION
During whole-body exercise in normal people, the increa-sed vascular conductance to improve muscle blood flow and oxygenation is the key to this on-transient elevation in pulmonary oxygen uptake (VO2). At the start (onset) of exercise, muscle blood flow and therefore O2 delivery, increase to meet the metabolic demand of contracting muscle mass. Because O2 delivery can have a profound effect on muscle metabolism and function,1 it has been of considerable interest to understand the nature of car-diovascular control mechanisms responsible for adjusting muscle blood flow and O2 delivery to muscle metabolic demand in terms of O2 consumption (VO2 consumption), spe-cially in the ageing process of the human beings.2-5 A simple and common approach has to investigate the dy-namic response of VO2 to step transitions in exercise in-tensity, by mathematical modelling1,6 of this VO
2 .on-tran-sient response. In consequence, different exponential mathematical models has been used, in studies oriented to the quantification of the dynamic response characteris-tics of this physiological regulatory VO2 and VO2 consumption system, in the search of unique insight into underlying mechanisms not obtainable through examination of the steady state.1 Quantifying the three parameters of a dyna-mic response, that is:
1. The time delay (TimeDelay) from onset of stimulus to on-set of response.
2. Rate of adaptation of the response (τ, the time cons-tant).
3. The magnitude of the response (amplitude or gain); and also determining the number of distinct phases of a O2 on-transient response.2-5
Three main theoretical phases has been observed (Φ1,
Φ2, Φ3,) of the on-transient VO2 responses (Φ1VO2,
Φ2VO2, Φ3VO2,) to an ergometric exercise.1,6 The first Φ1VO2 named by Whipp1 cardiodynamic phase, consists in an increased pulmonary perfusion with no significant change in the mixed venous O2 and carbon dioxide (CO2) tensions1 and Whipp2 postulated (p) that during Φ
1VO2, the VO2 increases its response following the onset of exer-cise lasting approximately 20 s; so that, Φ2VO2 starts approximately 20 s after the beginning of exercise and fi-nishes at 3 min exercise (Φ2postulatedVO2).1 The Φ2VO2 is an exponential instantaneously rate of change2 that is pro-portional to the magnitude of response from a baseline or required level and it is of the most importance be-cause it reflects the rate of increasing of VO2 M. The Φ2VO2 begins at the end of Φ1VO2 and slows progressively towards
its steady-state (asymptotic) value for moderate-intensity exercise (MODERATE) or unsteady-state (slow component) for heavy- intensity exercise (HEAVY); (MODERATE + HEAVY SUBMAXIMAL) . The end of Φ2VO2 is associated with a tran-sient decrease of pulmonary respiratory exchange ratio as a result of increased muscle tissue storage of metabolic CO2.3 The Φ3VO2 is a slow increase in VO2 that ends in a plateau for MODERATE.2 The Φ3VO2 consists in slow increase in VO2 named slow component for HEAVY4 and whether or not the slow component is an exponential response is motive of debate.4,5
These Φ1VO2, Φ2VO2, and Φ3VO2 on-transient respon-ses to ergometric exercise have been described by monoex-ponential functions7 that include T
imeDelay such as a one-component model (1C), an exponential function with one TimeDelay; twocomponent model (2C), two exponential ter-ms with one TimeDelay each one; and threecomponent mo-del (3C), three exponential terms with a TimeDelay for each one.7 These exponential empirical 1C, 2C, and 3C mo-dels, allow us to screen for VO2 on-transient mass rate of change per unit of time (VO2 kinetics) during SUBMAXIMAL. The VO2 kinetics assessment is based on the time requi-red for the transient VO2 response to reach 63% of final amplitude named the kinetic parameter, time constant (τ).5,7-9
The purpose of this work consisted in assessing the best mathematical exponential models, previously publis-hed, to characterize the Φ2VO2 on-transient response (Φ2postulatedVO2 and Φ2IsolatedVO2) to SUBMAXIMAL, in search for determinant mechanisms of the VO2 kinetics in old men. The comparison of modelling assessment techni-ques have been used to characterise VO2 kinetics during the on-transient of SUBMAXIMAL in young5,8 but in old men it has not.
On one hand, VO2Φ2 on-transient kinetics is slow-age related;10 on the other hand, body constitution is age-rela-ted;11,12 and also the VO
2Φ2 on-transient3 is characterized by reduced venous oxygen content consequent to the increa-sed muscle oxygen extraction due to the metabolic rate, which leads to a further increase in VE and pulmonary gas exchan-ge;3,12 however, we do not know if the VO
2Φ2 on-transient response to exercise intensity below estimated lactate threshold (below qL) and above qL (above qL) (SUBMAXIMAL) could be modelled differently in old men by the empirical exponential mathematical models already tested in young men.5,8
• Is there any exponential mathematical model that fitted statistically best Φ2postulatedVO2 on-transient SUBMAXIMAL response?
• Which exponential mathematical model fitted either statis-tically or physiologically (or both) best the Φ2VO2 into the entire VO2 on-transient SUBMAXIMAL (Φ2 IsolatedVO2) response? • Are the Φ2VO2 time constant values, from best fitting
models, different from each other?
Hypothesis
If the exponential phase two VO2 on-transient response to SUBMAXIMAL, is similarly modelled by different fitting models like the single monoexponential function, one-two-, and 3-component models in terms of time constant dura-tion, thus these Φ2VO2 kinetic parameter (τΦ2VO2) esti-mated values from best fitting models should not be significantly different from each other, in old adults.
MATERIAL AND METHODS
The cardiopulmonary methodology used in this study has been already described somewhere else.5,8 However, in brief as follows:
• Ventilation and pulmonary gas exchange (VO2, VCO2):
Ventilation, VO2 and VCO2 were calculated breath-by breath by a computer based programme (Beaver, et al., 1981). Inspired and expired air was sampled continuo-usly (1 mL•s-1) at the mouth, and analysed for fractional concentrations of O2, CO2, and N2 using a respira-tory mass spectrometer (Perkin Elmer MGA-1100 or Airspec MGA2000) daily calibrated.5 The electrocar-diograph (Harco, Sauborn Model 500-1100) measures the bioelectric potentials of the heart, inputs the ECG signals into a computerized oscilloscope (Perking Elmer EM 530 B), and records these voltages in a microcompu-ter.5 All the input signals were stored on a hard disc sys-tem for later analyses.
• Testing subjects: Nine old healthy male adults participa-ted in this study. The University’s Review Board for Re-search Using Human subjects approved this reRe-search. • Ramp test: On the initial visit to the laboratory each
subject performed and incremental exercise test in the upright position on an electrically-braqued cycle ergo-meter (Lode, Model H-300-R), in which after initiated at 60 rpm by 4 min “loadless” (actual constant power output approximately 20 W) pedaling, the power output increased as a ramp function at 15 W•min-1 to volitio-nal fatigue8 for the determination of the q
L, peak O2 uptake (VO2peak), heart rate peak and maximal work rate.8
• VO2peak: The VO2 averaged over the final 15 s of the incremental test prior to fatigue was taken as VO2peak. • Estimated lactate threshold (qL): The qL as a non-invasive
method was expressed as a percentage of the VO2max. The qL was defined as the VO2 at which there was a syste-matic increase in the ventilatory equivalent for VE /VO2 and end-tidal PO2, with no concomitant increase in the
VE /VCO2, or decrease in the end-tidal PCO2.2,13-15 The
VO2 corresponding to the time of the qL was calculated as Wasserman, et al.;16 as well as, the work rate corres-ponding to the VO2 at 80% and 120% qL was calcula-ted.5 For example,5 from the VO
2 corresponding to the time of the qL (qLVO2 1875, mL•min-1 52.1%VO2max) it was calculated the work rate correspon-ding to both the:
i) 80%qLVO2 expected (mL•min-1) qLVO2 • 0.8 1875 • 0.8 1650, mL•min-1, and the
ii) 120%qLVO2 expected (mL•min-1) qLVO2 • 1.2 1875 • 1.2 2220, mL•min-1; evermore, since the VO
2 equivalent (mL•min-1) (10•Watts
BaseLine) + VO2BaseLine (10 • 20) + 500 700, mL•min-1, then the 100%q
LVO2 equivalent (power in Watts) (qLVO2 - VO2 equiva-lent) / 10 (1875 - 700) / 10 117.5, W; conse-quently, the
iii)80%qLVO2 equivalent (W) [(qLVO2 • 0.8) - VO2 equi-valent] / 10 (1650 - 700) / 10 95, W, and the iv)120%qLVO2 equivalent (W) [(qLVO2 • 1.2) - VO2
equivalent] / 10 (2220 - 700) / 10 152, W.
• Submaximal constant-load leg cycling exercise tests (SUBMAXIMAL): Subjects performed constant-load leg
cycling exercise where the power output increased as a step function from “loadless” cycling to a power output corresponding to MODERATE or HEAVY.4,16 Three different intensities of SUBMAXIMAL were studied to determine VO2 on-transient kinetics and consisted in square waves
of 50 W (absolute power output, MODERATEAbs),
calculated breath-by-breath14 by a computer based pro-gramme.5
• Data analysis: The breath by breath MODERATE and H
EA-VY data were interpolated to 1 s interval, and each re-petition was time aligned and assemble averaged to provide a single response for each subject for determi-ning the kinetics of the VO2 on-transient response to SUBMAXIMAL.5 We determined in Φ3 the magnitude of the ΔVO2 data as the difference between the VO2 at the end exercise and the VO2 at 3 min of exercise (ΔVO2(6-3min)). The VO2 at 3 min (VO2_3min) was taken as mean between 2.75 and 3.15 min, and the end exer-cise VO2 (VO2_6min) was taken as the mean VO2 during the last 0.25 min exercise. We also calculated the slope subthreshold VO2 - power relationship and the VO2 du-ring loadless pedalling cycling.5,8.
• Modelling: The breath-by-breath VO2 on-transient single response from each subject was modelled by using the 1C, 2C and 3C exponential mathematical expressions with eight different fitting models as follows.5 The M
ono-ExponentialFunction of the form VO2(t) amplitude0 + amplitude • [1-e-(t/τ)]; presented as VO
2(t) is the mass rate of change per unit of time (dVO2•dt-1) assuming TimeDelay 0; amplitude0 is the baseline; amplitude is the VO2 distance va-lue from amplitude0 to the VO2 required, or the difference between unloaded pedalling and end-exercise VO2 res-ponse (VO2EE); 1-e-(t/τ) is the negative exponential distri-bution,17 e-(t /τ) is the die-away factor with the time cons-tant τ, for an exponential on-transient VO2 response increase, t is the time in which the transient VO2 respon-se is gradually (exponentially) dying away; when t τ it means that the time required for the transient VO2 res-ponse to die away to e-1 part (e-1 1/2.71828 0.3678) of its original value, thus, τ 1 - 0.3678 0.63, and e 2.718281 [(1 + n-1)]n, n ≥ 10 and ‘e’ is incom-mensurable with 1. This single MonoExponentialFunction mo-dels with three parameters (3P: amplitude0, amplitude, and τ) (1C,3P). The 1C is the MonoExponentialFunction with the in-clusion of TimeDelay (named onecomponent)7 that it broug-ht about the 1C with 4P (amplitude0, amplitude, TimeDelay, and
τ),5,18,19, expressed as follows (1C,4P): VO
2(t) amplitude0 + amplitude • [1-e-[(t-TimeDelay)/τ]].
The 2C consists in a doble MonoExponentialFunction with TimeDelay1 and TimeDelay2 included, and for this reason it models two gapped exponential transient periods of time with 7P (amplitude0, amplitude1, TimeDelay1, τ1, amplitude2, TimeDelay2, and τ2),6,20,21 expressed as follows (2C,7P):
VO2(t) amplitude0 + amplitude1 • [1-e-[(t-TimeDelay1)/τ1]] + amplitude2 • [1-e-[(t-TimeDelay2)/τ2]].
The 3C consists in a triple MonoExponentialFunction with TimeDelay1, TimeDelay2 and TimeDelay3 included, and for
this reason it models three gapped exponential
tran-sient periods of time with 10P (amplitude0,
amplitude1,TimeDelay1, τ1, amplitude2, TimeDelay2, τ2, amplitude3, TimeDelay3, τ3,),6 expressed as follows (3C,10P): VO2(t) amplitude0 + amplitude1 • [1-e-[(t - TimeDelay1) / τ1]] + amplitude2 • [1-e-[(t - TimeDelay2) / τ2]] + a
mplitude3 • [1-e-[(t - TimeDelay3 ) / τ3]]. When 3C,10P is constrained to TimeDelay2 TimeDelay3 then the threecomponent model is identified as 3C,9P (constrained 3C,10P).22 The Φ
2VO2τ estimate para-meter of the response was compared together with a statistical analysis of how well each model fit the VO2. We specifically addressed:
° The effect of incorporating the analysis of Φ1VO2 data within a model to physiologically isolate Φ2. ° The effect of incorporating the analysis of Φ3VO2 data
within a model to physiologically isolate Φ2 and to statistically isolate Φ2, based on Fisher test.23 ° Differences between fitting entire VO2 on-transient
response versus a fitting window for Φ2VO2 on-transient data.
The acceptability of the fitting models were also asses-sed primarily on whether the information provided by the models was consistent with current understanding of the VO2 on-transient response (Φ2_PhysBestFitVO2); as well as, statistical merits (Φ2_StatBestFitVO2). In addition to this, data were placed into discrete time-bins of 10 s (10-s bins VO2 data) to be modelled using 1C exponential mathematical expression. Eight fitting models were ex-pressed as follows: 1C,4P0 3333 → 3 min, 1C,4P0.3333 → 6 min, and 2C,7PBL2 → 3 min (BL2, two min baseline) to estimate
τΦ2postulated; 2C,7PBL2 → 6 min, 3C,9PBL2 → 6 min, and 3C,10PBL2 → 6 min to estimate τ from an isolated Φ2 (τΦ2 Isolated) with the second exponential term of these multi-component fitting models. These multi-compo-nent fitting models were used to assess the best physio-logical (Φ2 IsolatedPhysBestFit), statistical (Φ2_StatBestFit) and both (Φ2 Isolated_PhysStat BestFit) fit of Φ2VO2 on-transient respon-se to submaximal exercirespon-se. The 1C,4PBL2 → 6 min and 1C,3PBL2 → 6 min that fitted the entire on-transient VO2 data set, were used to assess the best fit compared to multiple component models. The kinetic analysis of phase two VO2 was assessed in terms of the τΦ2 (τ2, time constant two).
• Statistical analyses: The goodness of fit for each fitting model was assessed using the lowest residual sum of squares (RSS values) from a computerized nonlinear re-gression technique:24
Where SS is the residual sum of squares of each fit, df is the number of degrees of freedom, the suffixes 1 and 2 refer to the models being compared where suffix 1 refers to the model with the fewest parameters. The best statistical fit exponential mathematical model was assessed using the RSS values for models that fit the same number of experi-mental data points or the mean square error (MSE values, the deviations within- models mean square) for models which fit a different number of experimental data points by performing a Fisher’s test (Fvalue, at 0.05 level of signifi-cance and one tailed).5,23,25 The number of circular permu-tations for model comparisons (nP´x) was calculated ac-cording to Zar25 and expressed as a factorial function:5
nP´x = n! / [(n - x) ! (x)]
Were nP´x is the number of different ways of arranging two out (x 2) of n (n 8) mathematical models in circular
“arrangement”. For example,5,23,25 on the assessment of the:
i) 2C,7P BaseLine_0 to 6 min for Hvy (data: RSS1 19743532, NDP1 360, NP1 7, df1 360 - 7 353) versus 3C,10Pfrom MinBaseLine_0 to 6 min for Hvy (data: RSS2 11826244; NDP2 360, NP2 10, df2 360 - 10 350) with FvalueRSS [(RSS1 - RSS2) / (df1 - df2)] / (RSS2 / df2) [(197435321 - 118262442) / (3531 - 3502)] / (118262442 / 3502), FvalueRSS (21.3) resulted significantlyhigh com-pared Ftab,1α (1.10, P < 0.05); consequently, complex
model (3C,10P) statistically best fitted VO2 on-transient experimental data for heavy intensity exercise.5 On the assessment5,23,25 of the
ii) 1C,4Pfrom 0.3333 to 3 min for ModAbs (data: MSE1 280528, NDP1 160, NP1 4, df1 160 - 4 156) versus 2C,7Pfrom BaseLine_0 to 6 min for ModAbs (data: MSE2 1348; NDP2 360, NP2 10, df2 360 - 7 353) with FvalueMSE [(MSE1 - MSE2) / (df1 - df2)] / (MSE2 / df2) [(2805281 - 13482) / (1561 - 3532)] / (13482 / 3532), FvalueMSE (371.1) resulted significantlyhigh compared Ftab,1α
(1.23, P < 0.05); consequently, complex model (2C,7P) statistically best fitted VO2 on-transient experimental
data for moderate absolute intensity exercise.5 The eig-ht exponential mathematical fitting models used in this study were four simple (1C,4P0.3333 → 3 min, 1C,4P0 3333 →
6 min, 1C,3PBL2 → 6 min, 1C,4PBL2 → 6 min) and four complex (2C,7PBL2 → 3 min, 2C,7PBL2 → 6 min, 3C,9PBL2 → 6 min and,3C,10PBL2 → 6 min) models. Data treatment consisted of group analyses performed using either a ANOVA with Student-Newman-Keuls and Tukey post-hoc analyses or
Kruskal-Wallis ANOVA on Ranks procedure Dunns’
Method when variances of the dependent variable were unequal or the distribution of the dependent variable was not normal, to compare kinetic temporal parame-ters from the exercise square waves.25 Student t-test was used to assess for significant differences between the estimated parameter means from two groups with the same number of parameters.25 The probability level denoted significance at p ≤ 0.05. Except where otherwise stated, the estimated parameters are presen-ted as mean ± sTANDARDdEVIATION.
RESULTS
Physical characteristics and ramp exercise test
The physical characteristics, maximal cardiorespiratory and qL values are presented in table 1. The VO2End Exercise, exercise intensity expressed as absolute power output (MODERATEAbs) and relative (MODERATERel, HEAVYRel) to the qL (%qL) are pre-sented in table 2. The power output (W), significantly lasted MODERATE low compared HEAVY (Table 2). The square wave test VO2End Exercise, significantly lasted {MODERATE lower than HEAVY} (Table 2) different from VO2 qL (except MODERATE) (Table 1). The VO2 relative exercise intensity the qL (%qL) lasted MODERATE low compared HEAVY (Table 2). The W rela-tive exercise intensity the qL, calculated as W_intensity exercise / W_qL, lasted (%): MODERATEAbs (82.2 ± 16.3) lower than-MODERATERel (57.0 ± 4.6) lower than HEAVYRel (143.2 ± 4.7) (Fratio 29, P < 0.0001). The VO2_6min on-transient significantly lasted MODERATE low compared HEAVY (Fratio
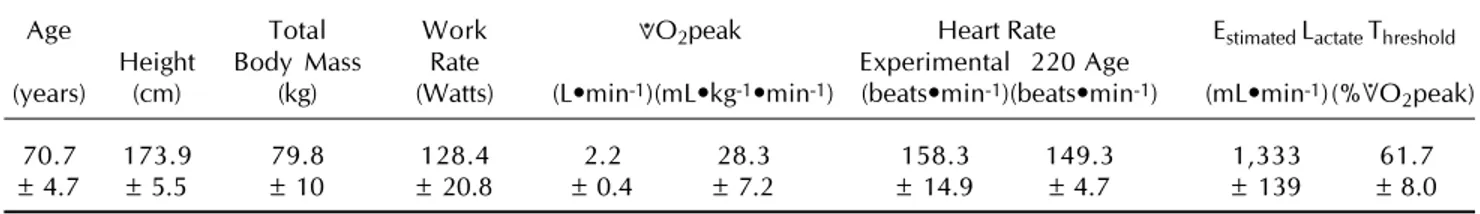
Table 1. Anthropometric, maximal ramp test and estimated lactate threshold cardiorespiratory data in nine old men.
Age Total Work VO2peak Heart Rate Estimated Lactate Threshold
Height Body Mass Rate Experimental 220 Age
(years) (cm) (kg) (Watts) (L•min-1)(mL•kg-1•min-1) (beats•min-1)(beats•min-1) (mL•min-1)(%VO2peak)
70.7 173.9 79.8 128.4 2.2 28.3 158.3 149.3 1,333 61.7
± 4.7 ± 5.5 ± 10 ± 20.8 ± 0.4 ± 7.2 ± 14.9 ± 4.7 ± 139 ± 8.0
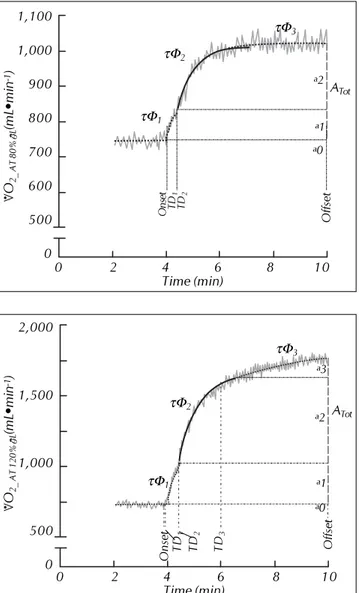
Figure 1. Oxygen uptake (VO2) time course during the on tran sient of moderate intensity (50 W) exercise. Exercise onset (start) is at six min. Exercise offset (end) is at six min. The best intra phase two data fit for the postulated (p) phase two (Φ2postulated) VO2 was 1C,4P0.3333 → 3 min (Φ2postulated) fitting model. The best physiologically (Phys) fit for the isolated phase two (Φ2Iso) VO2 was the 2C,7PBL2 → 6 min (Φ2Iso_Phys) fitting model (2C,7PBaseline_Onset to Offset ). Estimates for the time required to re ach 63% of final amplitude (τ) are with reference to phase two (τΦ2postulated; τΦ2Iso_Phys). The characteristic seven parameters (7P) of a twocomponent exponential model (2C) describing this VO2 time course data are as followed: a0 is the baseline VO2 (2C model started fitting from 2 min baseline, BL2, before the onset
Experimental data
1C,4P0.3333 → 3 min: τΦ2P = 36 s 2C,7PBL2 → 6 min: τΦ2Iso_Phys = 41 s
to the offset of the exercise); a1 and a2 (long dashed lines) are the increases in the amplitude of VO2 above the baseline value; τ1 and τ2 are the time constants; TD1 and TD2 are the time delays; and ATot = a1 + a2. The 2C,7PBL2 → 6 min Phys differentiates Φ2VO2 from both Φ1VO2 and Φ3VO2 on transient entire response data.
Table 2. Data for exercise at the same absolute power output (PO), and during relative intensity exercise below (moderate) and above (heavy) the estimated lactate threshold (qL) in nine old men.
Absolute PO (50 Watts)e Moderate Relative(80%q) Heavy relative (120%q)
VO2 %qL %VO2peak PO VO2 %qL %VO2peak PO VO2 %qL %VO2peak qL
(mL•min-1) (W) (mL•min-1) (W) (mL•min-1) (W)
1180a 89i 56k 37e,g 1050a,c 79i 49k 90f 1,770b 121j 81l 63h
± 145 ± 15 ± 15 ± 11 ± 198 ± 12 ± 11 ± 17 ± 333 ± 17 ± 14 ± 14
Numeric values are mean ± sd. Significant differences between means with different letter, allocated by ANOVA procedure Tukey test: a≠b;c≠dFratio = 19.5, P < 0.001 (included differences from mean VO2VET = 1333 ± 139a,d, mL•min-1); Kruskal Wallis ANOVA based on Ranks: e≠f;g≠hHratio
= 26.8, P < 0.001; Student Newman Keuls test: i≠jFratio = 35.6, P < 0.001; Student Newman Keuls test: k≠lFratio = 12, P < 0.001 (included differences from mean VO2VET %VO2peak = 62 ± 7.8k, %). %VET calculated as (VO2 exercise intensity) / VO2VET) • 100. %VO2peak calculated as (VO2 exercise intensity)/VO2peak) • 100.
7.5, P < 0.0001) (Table 2), and the VO2_3min on-transient also lasted as followed (mL•min-1): {M
ODERATEAbs (1119 ± 153) similar MODERATERel (1022 ± 193)} lower than H
EA-VYRel (1574 ± 235) (Fratio 13, P < 0.0001). Finally, only HEAVYRel showed VO2_6min (mL•min-1) on-transient signifi-cantly (Fratio 4, P < 0.03) higher (1770 ± 333) than
VO2_3min on-transient (1574 ± 235), confirming that this exercise intensity was below qL (ΔVO2(6-3min) 197 ± 70).
VO2 linear regression
The slope (coefficient) of the MODERATEVO2 - power output relationship and the VO2 during loadless cycling (constant) were: VO2 MODERATE 569.53 + (12.43 • W), n 18, R 0.98, P < 0.001 and VO2_loadless 751 ± 127 mL•min-1.
Mathematical Modelling
We have compared estimates of on-transient phase two pulmonary O2 uptake time constant (Φ2 VO2 τ) by eight empirical exponential mathematical fitting models of VO2 data during moderate- and heavy-intensity exercise in old men. For MODERATE, the most convenient best intra- Φ2VO2 fit was provided by a onecomponent exponential model, which omitted Φ1VO2 data, that fitted from 20 s after the exercise onset to a presumed steady-state at 3 min and un-derestimated TimeDelay2. The estimate of Φ2VO2 τ provi-ded by onecomponent exponential model was similar to that provided by the best physiologically Φ2VO2 fit, a two exponential model, that fitted from baseline_exercise on-set to exercise offon-set. Both models (1C and 2C) had
phy-V
O2_ AT 50 Watts
(mL•min
-1)
1,200
1,100
1,000
900
800
700
600
500
0
ATot
0 2 4 6 8 10
Time (min)
Onset TD
1
TD
2
Offset
τΦ1
τΦ3
τΦ2
a1 a2
Figure 2. Oxygen uptake (VO2) time course during the on tran sient of moderate intensity (80%qL) exercise. Exercise onset (start) is at six min. Exercise offset (end) is at six min. The best intra phase two data fit for the postulated (p) phase two (Φ2postulated) VO2 was 1C,4P0.3333 → 3 min (Φ2postulated) fitting model. The best physiologically (Phys) fit for the isolated phase two (Φ2Iso) VO2 was the 2C,7PBL2 → 6 min (Φ2Iso_Phys) fitting model (2C,7PBaseline_Onset to Offset). Estimates for t (time required to reach 63% of final amplitude) are with reference to phase two (τΦ2postulated; τΦ2Iso_Phys). qL, estimated lactate threshold.
Experimental data
1C,4P0.3333 → 3 min: τΦ2P = 37 s 2C,7PBL2 → 6 min: τΦ2Iso_Phys = 44 s
V
O2_ AT 80%
q
L
(mL•min
-1)
1,100
1,000
900
800
700
600
500
0
ATot
0 2 4 6 8 10
Time (min)
Offset
τΦ1
τΦ3 τΦ2
a0 a1 a2
siological significance as they focussed, 1C,4P0.3333 → 3 min modelling intra- Φ2VO2 and 2C,7PBaseLine_Onset to Offset mode-lling into the entire data and also physiologically isolating
Φ2VO2, upon the area of the on-transient data which re-flected working muscle VO2. For HEAVY, VO2 was best mo-delled with a threecomponent exponential model that was fit throughout the entire data set. The 3C,10PBaseLine_Onset to Offset modelling HEAVY response data was both statistically best compared 2C,7PBaseLine_Onset to Offset and physiologically best compared 1C,4P0 3333 → 3 min, 2C,7PBaseLine_Onset to Offset and 3C,9PBaseLine_Onset to Offset. These more convenient (1C,4P0.3333 → 3 min modelling SUBMAXIMAL response data) and
best physiological fitting models (2C,7PBaseLine_Onset to Offset modelling MODERATE response data or 3C,10PBaseLine_Onset to
Offset modelling HEAVY response data) showed on-transient
Φ2VO2 τ estimated values similar in older men, that seem to be correct in order to kinetically compare the on-tran-sient pulmonary Φ2VO2 data (Φ2VO2 τ) of submaximal exercise in young versus old men. Our research on this topic is guaranteed.
An example of the VO2 time course for MODERATEAbs, MODERATERel and HEAVYRel tests are presented in figures 1-3 respectively. Examples of the best fitting models for Φ2postulated with 1C,4P0.3333 → 3 min and Φ2Iso with 2C,7PBL2 → 6 min
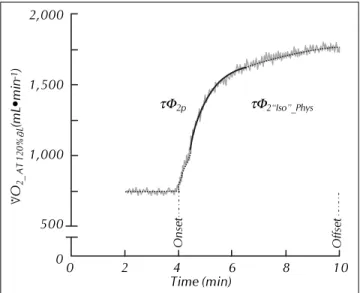
Figure 3. Oxygen uptake (VO2) time course during the on tran sient of heavy intensity (120%qL) exercise. Exercise onset (start) is at six min. Exercise offset (end) is at six min. The best intra phase two data fit for the postulated (p) phase two (Φ2postulated) VO2 was 1C,4P0.3333 → 3 min (Φ2postulated) fitting model. The best both physiologically (Phys) and statistically (Stat, based on Fis her’ test) fit for the isolated phase two (Φ2Iso) VO2 was the 3C,10PBL2 → 6 min (Φ2Iso_PhysStat) fitting model (3C,10PBaseline_Onset to Offset). Estimates for τ (time required to reach 63% of final ampli tude) are with reference to phase two (τΦ2postulated; τΦ2Iso_P). The characteristic ten parameters (10P) of a threecomponent exponential model (3C) describing this VO2 time course data
Experimental data
1C,4P0.3333 → 3 min: τΦ2P = 45.48 s 3C,10PPBL2 → 6 min: τΦ2Iso_Phys&Stat = 43.59 s
are as followed: a0 is the baseline VO2 (3C model started fitting from 2 min baseline, BL2, before the onset to the offset of the exercise); a1, a2 and a3 (long dashed lines) are the increases in the amplitude of VO2 above the baseline value; τ1, τ2 and τ3 are the time constants; TD1, TD2 and TD3 are the time delays; and ATot = a1 + a2 + a3. The 3C,10PBL2 → 6 min Phys differentiates Φ2VO2 from both Φ1VO2 and Φ3VO2 on transient entire response data. qL, estimated lactate threshold.
V
O2_ AT 120%
q
L
(mL•min
-1)
2,000
1,500
1,000
500
0
ATot
0 2 4 6 8 10
Time (min)
Onset TD
1
TD
2
TD
3
Offset
τΦ1
τΦ3
τΦ2
a0 a1 a3
a2 Onset TD
1
TD
Table 3. Residual sum of squares and mean square error estimates for kinetic analysis of VO2 during the on transient of steady state submaximal exercise as estimated by eight different exponential mathematical models in nine old men.
Work Rate
Estimated Ventilatory Threshold
50 Watts 80% 120%
RSS Mean Square Error RSS Mean Square Error RSS Mean Square Error
Fitting Model (x105) (x105) (x105)
1C,4P0.3333 → 3 min 2.07 ± 0.64 1324 ± 408 3.07 ± 2.70 1965 ± 1731 6.31 ± 8.31 4050 ± 5332 1C,4P0.3333 → 6 min 4.73 ± 1.75 1409 ± 522 6.29 ± 4.60 1870 ± 1369 14.85 ± 20.15 4420 ± 5997 1C,3PBL2 → 6 min 7.61 ± 3.47 1536 ± 619 7.77 ± 5.61 1787 ± 1155 18.96 ± 23.76 3612 ± 3902 1C,4PBL2 → 6 min 6.77 ± 2.61 1402 ± 504 7.12 ± 5.30 1643 ± 1094 17.65 ± 21.12 3707 ± 4436 2C,7PBL2 → 3 min 3.79 ± 1.50 1294 ± 512 4.61 ± 2.86 1666 ± 1118 8.82 ± 9.37 3010 ± 3198 2C,7PBL2 → 6 min 6.43 ± 2.61 1359 ± 552 6.98 ± 5.05 1657 ± 1103 15.86 ± 20.68 3503 ± 4350 3C,9PBL2 → 6 min It did not fit these data It did not fit these data 15.97 ± 19.93 3391 ± 4231 3C,10PBL2 → 6 min It did not fit these data It did not fit these data 17.70 ± 17.83 3035 ± 3030 Numeric values are mean ± sd. RSS: Residual Sum of Squares and is expressed as RSS x 105. 1C, 2C, and 3C are the onecomponent, twocompo nents, and threecomponents exponential mathematical models. 3P: three parameters. 4P: four parameters. 7P: seven parameters. 9P: nine parameters. 10P: ten parameters. BL2: two min baseline. →: fitting period of time window: 0.3333 → 6 min, from 20 s after start to end exercise; BL2 → 6 min, from two min baseline to end exercise.
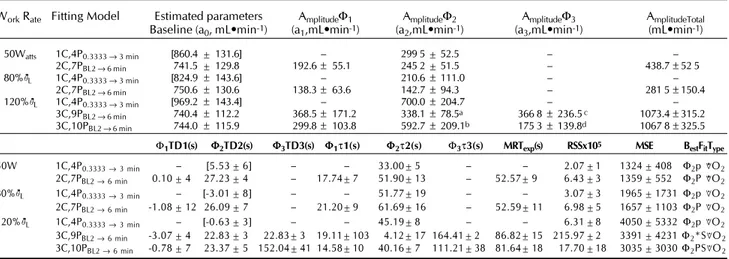
Experimental data
1C,4P0.3333 → 3 min: τΦ2P = 45.48 s 3C,9PBL2 → 6 min: τΦ2“Iso”Phys = 30.5 s
Figure 4. Oxygen uptake (VO2) time course during the on tran sient of heavy intensity (120%qL) exercise. Exercise onset (start) is at six min. Exercise offset (end) is at six min. The best fit for the postulated (p) phase two (Φ2postulated) VO2 was the simple 1C,4P0.3333 → 3 min (Φ2postulated) fitting model. The best statistica lly fit for “isolated” phase two (Φ2) VO2 was the restricted (TimeDelay2 = TimeDelay3) 3C or 3C,9PBL2 → 6 min (Φ2“Iso”_Stat) fitting model (3C,9PBaseline_Onset to Offset ). Estimates for τ (time required to reach 63% of final amplitude) are with reference to phase two (τΦ2postulated; τΦ2“Iso”_Phys). The 3C,9PBL2 → 6 min Phys differen
tiates Φ2 VO2 from Φ1 VO2 but not from Φ3 VO2 on transient entire response data. qL, estimated lactate threshold.
are presented in figures 1 and 2 for MODERATE. Examples of the best fitting models for Φ2postulated with 1C,4P0.3333 → 3 min are shown in figures 3 and 4 and for Φ2 Isolated are also presen-ted in figure 3 with 3C,10PBL2 → 6 min (Φ2 Isolated_PhysStat BestFit) and figure 4 with 3C,9PBL2 → 6 min, Φ2“Isolated”_Stat BestFit for HEAVY.
The RSS and MSE estimates for kinetic analysis of VO2 during the on-transient of steady-state SUBMAXIMAL as esti-mated by eight different fitting models are presented in table 3. The mathematical model permutations of 1C,
2C and 3C comparisons for the on-transient VO2
SUBMAXIMAL responses are presented in table 4. The am-plitude and the parameter estimates determined from kinetic analyses of VO2 during the on-transient of
steady-state exercise, as estimated by the best fitting models from these study, are presented in table 4 for MODERATE and HEAVY. Amplitudes from Φ2 IsolatedVO2 and Φ3VO2 during the on-transient of steady-state HEAVY were diffe-rent in model 3C,9PBL2 → 6 min compared to model 3C,10PBl2 → 6 min (Table 5).
Onecomponent fitting model comparisons
Both 1C,4PBL2 → 6 min and 1C,3PBL2 → 6 min were not phy-siologically useful for fitting VO2 on-transient entire res-ponse data to characterize Φ2 VO2 for SUBMAXIMAL. The simple one model 1C,4P0.3333 → 3 min fitted (Figures 1-3)
V
O2_ AT 120%
q
L
(mL•min
-1)
2,000
1,500
1,000
500
0
0 2 4 6 8 10
Time (min)
τΦ2p τΦ2“Iso”_Phys
Table 4. The best statistical fit from the two out mathematical model permutations of onecomponent, twocomponent and threecomponent mathematical exponential models for the on transient VO2 submaximal exercise in nine old men.
Estimated Lactate Threshold
Fitting Model 50 Watts 80% 120%
Number of “Simple” versus “Complex” FvalueCalculateda
Permutations (Si) (Co) FRS FMSE FRSS FMSE FRSS FMSE
Onecomponent model vs. Onecomponent model.
1 1C,3PBL2 → 6 min 1C,4PBL2 → 6 min 42*,Co 28*,Co 17*,Co
2 1C,3PBL2 → 6 min 1C,4P0.3333 → 6 min 1.33*,Co 0.01,Si 0.21,Si
3 1C,3PBL2 → 6 min 1C,4P0.3333 → 3 min 0.01,Si 0.01,Si 0.07,Si
4 1C,4P0.3333 → 3 min 1C,4P0.3333 → 6 min 0.08,Si 0.04,Si 0.17,Si
5 1C,4P0.3333 → 3 min 1C,4PBL2 → 6 min 0.06,Si 0.71,Si 0.01,Si
6 1C,4P0.3333 → 6 min 1C,4PBL2 → 6 min 0.17,Si 0.77,Si 0.74,Si
Onecomponent model vs. {Twocomponent model / Threecomponent mode}].
1 1C,4P0.3333 → 3 min 2C,7PBL2 → 3 min 0.03,Si 0.44,Si 0.76,Si
2 1C,4P0.3333 → 3 min 2C,7PBL2 → 6 min 0.03,Si 0.07,Si 0.14,Si
3 1C,4P0.3333 → 3 min 3C,9PBL2 → 6 min The three components model did 0.24,Si
4 1C,4P0.3333 → 3 min 3C,10PBL2 → 6 min not fit moderate exercise intensity 0.28,Si
Twocomponent model vs. Twocomponent model.
1 2C,7PBL2 →3 min 2C,7PBL2 → 6 min 0.09,Si 0.03,Si 0.14,Si
Twocomponent model vs. Threecomponent model.
1 2C,7PBL2 → 3 min 3C,9PBL2 → 6 min The three components model did 0.06,Si
2 2C,7PBL2 → 6 min 3C,9PBL2 → 6 min not fit moderate exercise intensity 45*,Co
3 2C,7PBL2 → 3 min 3C,10PBL2 → 6 min 0.02,Si
4 2C,7PBL2 → 6 min 3C,10PBL2 → 6 min 14*,Co
Threecomponent model vs. Threecomponent model.
1 3C,9PBL2 → 6 min 3C,10PBL2 → 6 min 0.13,Si
Fisher’s test (Fvalue, at 0.05 level of significance and one tailed*: Ftabulated0.05 (1α) = 1.15). If Fcalculated > Ftabulated then Co model fits best; if Fcalculated < Ftabulated then “Simple” model fits best. C: component; P: parameters.
Table 5. Amplitude and parameter estimates determined for kinetic analysis of VO2 during the on transient of steady state submaximal exercise as estimated by the best fit exponential mathematical models in nine old men.
Work Rate Fitting Model Estimated parameters AmplitudeΦ1 AmplitudeΦ2 AmplitudeΦ3 AmplitudeTotal
Baseline (a0, mL•min-1) (a1,mL•min-1) (a2,mL•min-1) (a3,mL•min-1) (mL•min-1)
50Watts 1C,4P0.3333 → 3 min [860.4 ± 131.6] – 299 5 ± 52.5 – –
2C,7PBL2 → 6 min 741.5 ± 129.8 192.6±55.1 245 2 ± 51.5 – 438.7±52 5
80%qL 1C,4P0.3333 → 3 min [824.9 ±143.6] – 210.6±111.0 – –
2C,7PBL2 → 6 min 750.6 ±130.6 138.3±63.6 142.7±94.3 – 281 5±150.4
120%qL 1C,4P0.3333 → 3 min [969.2 ±143.4] – 700.0±204.7 – –
3C,9PBL2 → 6 min 740.4 ±112.2 368.5±171.2 338.1±78.5a 366 8±236.5 c 1073.4±315.2
3C,10PBL2 → 6 min 744.0 ±115.9 299.8±103.8 592.7±209.1b 175 3±139.8d 1067 8±325.5
Φ1TD1(s) ΦΦ2TD2(s) ΦΦ3TD3(s) ΦΦ1τ1(s) ΦΦ2τ2(s) Φ3τ3(s) MRTexp(s) RSSx105 MSE BestFitType
50W 1C,4P0.3333 → 3 min – [5.53 ± 6] – – 33.00± 5 – – 2.07 ±1 1324 ± 408 Φ2p VO2
2C,7PBL2 → 6 min 0.10 ± 4 27.23 ± 4 – 17.74± 7 51.90± 13 – 52.57± 9 6.43 ±3 1359 ± 552 Φ2P VO2
80%qL 1C,4P0.3333 → 3 min – [-3.01 ± 8] – – 51.77± 19 – – 3.07 ±3 1965 ± 1731Φ2p VO2
2C,7PBL2 → 6 min -1.08 ± 12 26.09 ± 7 – 21.20± 9 61.69± 16 – 52.59± 11 6.98 ±5 1657 ± 1103Φ2P VO2
120%qL 1C,4P0.3333 → 3 min – [-0.63 ± 3] – – 45.19± 8 – – 6.31 ±8 4050 ± 5332Φ2p VO2
3C,9PBL2 → 6 min -3.07 ± 4 22.83 ± 3 22.83± 3 19.11± 103 4.12± 17 164.41± 2 86.82± 15 215.97 ±2 3391 ± 4231Φ2*SVO2
3C,10PBL2 → 6 min -0.78 ± 7 23.37 ± 5 152.04± 41 14.58± 10 40.16± 7 111.21± 38 81.64± 18 17.70 ±18 3035 ± 3030Φ2PSVO2
: No estimated parameter value. qL: Estimated lactate threshold. a ≠ b (t = 9) and c ≠ d (t = 57) Student tα0.05, p < 0.05. Φ: Phases of the increase
in VO2 during the on transient of submaximal exercise. [ ]: “virtual” either baseline VO2 or TD2. TD: time delay. τ: time constant. MRTexp:
exponential mean response time (the time required for the transient VO2 response to reach 63% of final amplitude): MRTexp 1C = TD + τVO2; MRTexp 2C = [a1 / ( a1 + a2)] • (TD1 + τ1) + [a2 / (a1 + a2)] • (TD2 + τ2 ); MRTexp 3C = [a1 / (a1 + a2 + a3)] • (TD1 + τ1) + [a2 / (a1 + a2 + a3)] • (TD2 +τ2) + [a3 / (a1 + a2 + a3)] • (TD3 + τ3). 1C, 2C, and 3C, One , two , and three component exponential mathematical model. RSS:
best intra Φ2VO2 data (Φ2postulatedVO2) for SUBMAXIMAL (Ta-ble 4).
One-, two-, and three-component fitting model comparisons
The 2C,7PBL2 → 6 min showed physiological best fit Φ2VO2 on-transient response data to MODERATE (Table 4, Figures 1 and 2); Φ2 Isolated_PhysBestFitVO2). The 3C model (3C,9P, 3C,10P)BL2 → 6 min fitted statistically better (based on Fisher’s test) than 2C,7PBL2 → 6 min (Table 4) the Φ2VO2 on-transient response data for HEAVY. The 3C,9PBL2 → 6 min was neither
physiologically nor statistically better than 3C,10PBL2 → 6
min (Tables 4 and 5, Figure 4) on fitting Φ2VO2 on-transient response data for HEAVY. The 3C,10PBL2 → 6 min showed phy-siological sense in terms of amplitude and temporal para-meter estimates of the three VO2 phases of response data for HEAVY and allowed us to physiologically characterize the Φ2VO2 (Table 5, Figure 3) response data for HEAVY.
Phase Two VO2 On-Transient Kinetics (τ τ Φ 2VO2)
The 1C,4P0.3333 → 3 min characterized τΦ2postulatedVO2 on-transient data for MODERATEAbs (τΦ2postulated 33 ± 4.95 s),
Table 7. Final summary best fit exponential mathematical models that characterized the Phase two VO2 during the on transient of steady state moderate intensity (50 W, 80%qL) and heavy intensity (120%qL) exercise, respectively, in nine old men.
Exponential Mathematical Model Fitting Model τ Φ2VO2 Comments
Submaximal Exercise
VO2(t) = a0(virtual) + a1 • [1 e-[(t-TD1)/τ1]] 1C,4P0.3333 → 3 min Exercise τΦ2 postulated (Practical Phys τΦ2VO2)
Moderate-Intensity Exercise
VO2(t) = a0 + a1 • [1 e-[(t-TD1)/τ1]] + a2 • [1 e-[(t-TD2)/τ2]] 2C,7PBaseline → End Exercise “Φ1”, τΦ2Phys Isolated, Φ3
∴Φ2 Isolated VO2(t) = a0 + a2 • [1 e-[(t-TD2)/τ2]] Heavy-Intensity Exercise
VO2(t) = a0 + a1 • [1 e-[(t-TD1)/τ1]] + a2 • [1 e-[(t-TD2)/τ2]] + a3 • [1 e-[(t-TD2)/τ2]] 3C,10PBaseline → End Exercise “Φ1”, τΦ2Phys Isolated, Φ3
∴Φ2 Isolated VO2(t) = a0 + a2 • [1 e-[(t-TD2)/τ2]]
→:Fitting period of time arrow. On transient, the output of a system from the onset to the offset of the exercise; Onset and Offset, the start and the
end, respectively, of an application of an ergometric forced function. qL: Ventilatory threshold. Phys: physiological sense (it differentiated Φ2VO2
from both Φ1VO2 and Φ3VO2). VO2: Pulmonary oxygen uptake. VO2(t): Mass rate of change per unit of time (dVO2•dt-1), mL•min-1. TD: Time
delay, s. a0:Baseline (the VO2 at the start of the model). a: the VO2 distance value from a0 to the VO2 required for phase one (a1), phase two (a2)
and phase three (a3) amplitudes, mL. 1 e-(t/τττττ): The negative exponential distribution (Evans, Hasting and Peacock, 1993). e-(t/τττττ): The die away factor
with the time constant τ (s), for an exponential increase (on transient VO2 response). t: The time in which the transient VO2 response is gradually
(exponentially) dying away, when t = τ means the time required for the transient VO2 response to die away to e-1 part (e-1 = 1/2.71828 = 0.3678)
of its original value, thus, τ = 1 0.3678 = 0.63, and e = 2.718281 = [(1 + n-1)]n, n ≥ 10 and ‘e’ is incommensurable with 1. Onecomponent
(1C), TD1: Twocomponents (2C), TD1 and TD2; Threecomponents (3C), 2C and TD3. 4P: Four parameters (a0, a1, TD1, τ1). 7P: Seven parameters
(4P, a2, TD2, τ2). 10P: Ten parameters (7P, a3, TD3, τ3).
Table 6. Parameter estimated by the best fit onecomponent mathematical model from kinetic analysis of VO2 data placed into discrete time bins of 10 s during the on transient of steady state submaximal exercise in nine old men.
Work Rate Baseline(a0) AmplitudeΦ2(a2) Φ2TimeDelayed(TD2) Φ2postulatedτ(τ2) ± 95
(mL•min-1) (mL•min-1) (s) (s) (confidence interval)
50 Watts [740± 137] 438± 55 [10.32 ± 12] 42.61± 9.1 3 ± 0.9
80%qL [727± 87] 293± 134 [7.94 ± 8.8] 42.73± 4.83 6 ± 2.2
120%qL [741± 112] 922± 260 [7.08 ± 5.5] 43.70± 7.8 2 ± 0.7
qL: estimated lactate threshold. ΦΦ2: refers to phase 2 of the increase in VO2 during the on transient of submaximal exercise. a0: represents the
baseline VO2 prior to the transition to submaximal exercise. The a0 shown in square brackets is the VO2 corresponding to 0.3333 min (20 s) with
the exercise transient, and thus represents a “virtual” baseline VO2. Data was fitted with onecomponent exponential mathematical model of four
parameters (a0,a2,TD2, τ2 ). Fitting window 20 s from exercise onset to either end exercise (MOD: 50 Watts, 80%qL) or phase 2 3 transition
(HVY: 120%qL). The TimeDelay2 shown in square brackets represent a “virtual” TD2. τ: time constant. Φ2postulatedVO2 started 20 s after de onset
MODERATERel (τΦ2postulated 51.77 ± 18.75 s) (Φ2postulatedVO2τ MODERATE 42.38 ± 16 s) and HEAVYRel (τΦ2postulated 45.19 ± 8.15 s) responses (Table 5) that kinetically characterized this submaximal exercise-intensity (τΦ2postulated for SUBMAXIMAL 46.34 ± 14.87 s) (Figures 1-3). The Φ2 IsolatedVO2 characterized from entire on- transient data showed that model 2C,7PBL2 → 3 min did not properly fit the VO2 on- transient entire HEAVY data. Thus, it followed that the physiological best fitting model for MODERATE was 2C,7PBL2 → 6 min (Table 5) because it fitted three VO2 phases and kinetically characterized τΦ2 Isolated (Table 5), in agree-ment with the morphology of the VO2 entire response data for the MODERATE response (Figures 1 and 2). Thus
τΦ2 Isolated_PhysBestFit for MODERATE was 53.68 ± 15.59 s. The 3C,10PBL2 → 6 min kinetically characterizing Φ2 Isolated
VO2 (Table 5) from entire on-transient data showing a
τΦ2 Isolated_PhysBestFit VO2 for HEAVY equal to 40.16 ± 7.35 s ( F i g u r e 3 ) . T h e s e VO2 τΦ2 p o s t u l a t e d SU B M A X I M A L,
τΦ2 Isolated_PhysBestFit MODERATE, and τΦ2 Isolated_PhysBestFit HEAVY values from those best fitting models were not significan-tly different from each other and, gave an overall τΦ2VO2 value of 46 ± 15 s in our old group of men. The
τΦ2data of VO2 10-s bins value (43 ± 7 s) (Table 6) was not significantly different from τΦ2VO2. Table 7 showed the final summary of all these best fitting models characteri-zing phase two VO2 on-transient response to moderate-and heavy- intensity (SUBMAXIMAL) exercise.
DISCUSSION
Physical characteristics,
ramp exercise test, and constant load tests
The physical characteristics, maximal cardiorespiratory and qL values from all of our subjects were above average fitness.26 In this study the observations were that subject showed low power output and low square wave test
VO2End Exercise for MODERATE compared to HEAVY. Subjects showed MODERATEAbs VO2 (%qL) similar to VO2 qL. MODERATE Rel VO2 (%qL) resulted low compared VO2 qL and they were lower that the HEAVYRel VO2 (%qL). However, these diffe-rences in the numeric values of these variables, showed
Φ2VO2τ values not to be kinetically different between the work rates of MODERATE. Our study showed the well known observation that cycle exercise resulted in a linear increase in VO2 of approximately 10 mL•min-1 (this study 12 mL•min -1 for M
ODERATE) for every one W increase in work rate.27 The HEAVY showed a positive on-transient ΔVO2(6-3min) value be-cause the metabolic requirement for performance of this heavy work rate, is known to be over and above that predicted from below qLVO2 - work rate relationship.4
Mathematical Modelling
• Onecomponent fitting model comparisons: The 1C
fit-ting models 1C,4P0.3333 min to Offset, 1C,4PBaseLine_Onset to Offset, and 1C,3PBaseLine_Onset to Offset oversimplifying the VO2 response data for MODERATE and HEAVY,28 they poorly fitted in terms of large MSE through the phase due to an increase in pulmonary blood flow15,19,27 followed by a further exponential increase in pulmonary VO2 that re-flects muscle VO2,29,30 and they showed also no phy-siological sense of the estimates of Φ1VO2τ. All these observations are in agreement with those ones observed in a similar study done with young adults.8,9 Thus, from 1C fitting model comparisons, the most convenient best intra-fit Φ2postulatedVO2 on-transient response data to SUBMAXIMAL in terms of both τ2 value and physiological meaning, was the 1C,4P0 3333 → 3 min, in agreement with previous observations in young adults.8,9 The fact that 1C,4P0.3333 → 3 min physiologically best intra-fitted Φ2
VO2 on-transient response data to SUBMAXIMAL compared to either 2C,7P for SUBMAXIMAL or 3C for HEAVY, is ex-plained because this Φ2VO2 is an exponential transient response7 and also because the shorter the period of time modelled the better both the fit and the simple the mathematical model.8,23
• Twocomponent fitting model comparisons: We fit
the same SUBMAXIMAL data set with three different 2C fitting models (2C,7PBaseLine_Onset to 3 min, and 2C,7PBaseLine_Onset to Offset) which varied mainly in their fitting window and consideration of the phases of increase in VO2 in our group of old men. Taking in consideration that the VO2 response data during the on-transient of MODERATE, culminating in a steady-state va-lue, is less complicated relative to the response during the on-transient of HEAVY; the 2C,7PBaseLine_Onset to 3 min omitted Φ1 VO2 and arbitrary limits of 3 min the Φ2
VO2 end, had the inconvenient, that it did not neither physiologically differentiate nor isolate Φ2VO2 from the MODERATE entire data in young5,8,9 and old men in this study. Thus, the 2C,7PBaseLine_Onset to Offset fitting models was physilogically best fit in old men for the MODERATEΦ2 IsolatedVO2 on-transient entire response data, because this model included a baseline when it diffe-rentiated this Φ2 IsolatedVO2 with its second exponential term from the three phases of this entire MODERATEVO2 on-transient response.5,8,9 If M
of the MODERATEΦ2VO2 (Φ2 Isolated_PhysVO2 τ) response data to constant-load leg cycling. In consequence, we preferred 2C,7PBaseLine_Onset to Offset to characterize
τΦ2 IsolatedVO2 on-transient response data to MODERATE in old men, because it properly fitted with double ex-ponential functions (with twocomponent included: TD1 and TD2)7 the cardiodynamic (Φ
1), exponential (Φ2), and steady state (Φ3) VO2 responses to MODERATE.31 These observations are in agreement with the fact that Mod being less complicated response thus it may be described adequately by relatively less complex (2C instead 3C) mathematical models. In consequence, the 2C,7PBaseLine_Onset to Offset fitting model was physiologica-lly best fit in old men for the MODERATEΦ2 IsolatedVO2 on-transient entire response data, because it differen-tiated this Φ2 Isolated VO2 with its second exponential term from the three phases of this entire MODERATEVO2 on-transient response data.8
• Threecomponent fitting model comparisons: The 3C
mo-dels fitted statistically better than 2C,7PBaseLine_Onset to Offset for HEAVY constant-load leg cycling, because the supe-rimposed morphology of the slow component in the HEAVYΦ2VO2 on-transient response data cannot be pro-perly fitted by 2C models.8,9,32,33 These assessments lead us from the physiological system, VO2 on-transient SUBMAXIMAL, to a mathematical formulation, modelling
Φ2VO2, with the best fitting exponential mathemati-cal models, and to the physiologimathemati-cal interpretation of the results in terms of Φ2VO2 τ.
• Phase Two VO2 On-Transient Kinetics (ττΦ2VO2): The 1C,4P0.3333 → 3 min kinetically (τ) characterized SUBMAXIMALΦ2 postulatedVO2 on-transient response data to constant-load leg cycling, because this SUBMAXIMALΦ2
VO2 on-transient response data is an exponential one7 and also because by fitting the period of time from 20 s after the onset of the exercise to 3 min exercise, we were mainly modelling in the whole Φ2 experimental data, as well as because the probability of kinetic in-fluences on Φ2VO2 from both Φ1 VO2 and Φ3 VO26 were minimized; in particular Φ3VO2 that it has been considered to overlap Φ2VO2 during HEAVY constant-load leg cycling.6,9 In consequence, the 1C,4P
0.3333 → 3 min fitting model seems to be closely implying dependence in nature, because there is a high probability that this
Φ2 postulated VO2 on-transient kinetic (Φ2 postulated VO2τ) response data to SUBMAXIMAL is related at peripherical level (energy- metabolism kinetics) in terms of
VO2_comsumptionτ and PCr τ (cause) and Φ2VO2_pulmonary uptakeτ ( e f f e c t ) .34
We preferred 2C,7PBaseLine_Onset to Offset to kinetically cha-racterize SUBMAXIMALΦ2 IsolatedVO2 on-transient response
data, because it showed also physiological sense as a fitting model that isolated the MODERATE Φ2VO2 on-transient response data (Φ2 Isolated_PhysBestFit) to constant-load leg cycling. This 2C,7PBaseLine_Onset to Offset properly fits with double exponential functions (with TimeDelay1 and TimeDelay2 included)7 the cardiodynamic (Φ1), ex-ponential (Φ2), and steady state (Φ3) VO2 responses to MODERATE.31 The TimeDelay2 from both theMODERATEAbs (26 s) and the MODERATERel (27 s), were different from that assumed prior to phase two of approximately 20 s for fitting model 1C,4P20s → 3 min,28 because Φ1VO2 on-transient response data finished approximately 20 s after the onset MODERATE but individual variability and the in-tensity of the MODERATE test may be responsible for small significant differences like those observed of 6 s for M
O-DERATEAbs and 7 s for MODERATERel power output. If Φ1
VO2 were and exponential response to MODERATE, then the fitting model 2C,7PBaseLine_Onset to Offset would proba-bly perfectly match the entire VO2 morphology of res-ponse to MODERATE. Nevertheless, 2C,7PBaseLine_Onset to Offset supported in physiological and in kinetical terms the iso-lation of the M-ODERATEΦ2VO2 (Φ2 Isolated_PhysBestFitVO2 τ) response data.
The 3C,10PBaseLine_Onset to Offset showed both statistical merits and physiological sense in kinetically characteri-zing the isolated HEAVYΦ2 (τΦ2 Isolated_ PhysStat BestFit) VO2 on-transient response data to constant-load leg cycling. The 3C,10PBaseLine_Onset to Offset kinetically cha-racterized with its second exponential term the HEAVY
Φ2 Isolated_PhysStat BestFitVO2 on-transient response data to cons-tant-load leg cycling.4,7,9,28 The 3C,9P
BaseLine_Onset to Offset did not model in physiological terms the estimated pa-rameters (i.e., τ) of the entire VO2 on-transient response data to HEAVY, because it was 3C,10PBaseLine_Onset to Offset restricted to TimeDelay2 TimeDelay3. Evermore, during HEAVY both the amplitude Φ2 and amplitude Φ3VO2 were different in 3C,9PBaseLine_Onset to Offset compared to 3C,10PBaseLine_Onset to Offset; and these amplitude value di-fferences, particularly the one from the slow compo-nent (amplitude Φ3VO2), is one of the reasons for the lack of physiological sense in the way of modelling entire VO2 on-transient response data to HEAVY by the fitting model 3C,9PBaseLine_Onset to Offset.5,8,9 These no sense in the estimated values of the temporal parameters, is explained because the Φ3VO2 on-transient response data to HEAVY, elicited no steady- state (ΔVO2(6-3min) positive, slow component).4 In M
ODERATE, not only is
study in kinetically characterizing Φ2VO2 only, then 3C,10PBaseLine_Onset to Offset characterized HEAVY Φ2 Isolated_PhysBestFitVO2 τ response data to constant-load leg cycling. When modelling the Φ2VO2 on-transient res-ponse data to MODERATE, it is useful to use the fitting model 1C,4P20 s → 3 min28 as we did in this study, 1C,4P0.3333 → 3 min, and did also previously5,8,9 as a gene-ral reference of τ values of the postulated on-transient
Φ2 VO2 to feedback the kinetic (τ) values from the isola-ted Φ2 VO2 with either 2C,7PBaseLine_Onset to Offset for SUBMAXIMAL or 3C,10PBaseLine_Onset to Offset for HEAVY; these
τ2 values should be similar to each other, as it was observed in young adults5,8,9 and in this study for S
UB-MAXIMAL as well.
The Φ2VO2 on-transient data of response to SUBMAXIMAL is very important from the kinetically and physiologically points of view because they allow us to study the oxygen mass rate of change per unit of time during a non steady-state condition response to exercise, in terms of mathema-tical modelling of this response, to assess the dynamics of the blood,35 cardiovascular and energy metabolism4,18 in human beings. The τ for expired ventilation exceeds that of VO2 by some 50-70%.3 This kinetic dissociation of expired ventilation from VO23 has been explained as a transient hypoxemia during phase two of a constant-load exercise, and it has been demonstrated.20,36 Interestingly, pulmonary τΦ2VO2 uptake seems to be similar to the kinetics of VO2 consumption by the exercising body mass.29,37 Finally, whether the rate of increase in oxidative phosphorylation is limited by the adaptation of oxygen utilization or oxygen transport mechanisms, is motive of debate.30,34,38,39 In consequence, there is a need for a con-sensus in the way to model the oxygen uptake on-transient kinetics of the response to different intensities of exercise, in search of a cause- effect relationship, underlaying the mechanisms of the non steady- state response in exercise physiology, to match the mathematical model with the physiological one to come. Finally, these findings in old men seem to be correct in order to kinetically compare them properly with those from young men.
CONCLUSIONS
The simple (practically) onecomponent, four parameters, exponential mathematical model (1C,4P), conveniently best intramodelled and fitted VO2 on-transient data and allo-wed us to kinetically characterize the estimated VO2 on-transient time constant for postulated phase two VO2 on-transient data of submaximal exercise (fitting model 1C,4Pfrom 0.3333 → 3 min exercise). The complexes twocomponent seven parameters (2C,7P) and threecomponent, ten
para-meters (3C,10P) exponential mathematical models, were physiologically and statistically best fit, respectively, on kinetically characterizing the estimated VO2 on-transient time constant for the isolated phase two VO2 on-transient data, for moderate-intensity exercise with the fitting model 2C,7Pfrom baseline_start to end exercise and for heavy exercise intensi-ty with the fitting model 3C,10Pfrom baseline_start to end exercise. These 2C,7P and 3C,10P fitting models differentiated from the three VO2 phases of the entire on-transient data and kinetically characterized, the estimated VO2 on-transient time constant for phase two of response by intra modelling the phase two VO2 into the entire on-transient data with their second exponential term. The phase two VO2 on-tran-sient time constant estimated values from these one-, two- and three-component best fitting models of the VO2 on-transient response data to submaximal exercise, were similar to each other.
ACKNOWLEDGEMENTS
We express our indebted to the volunteers who participated in this research and to Brad Hansen for their excellent tech-nical assistance. The Centre for Activity Ageing is affiliated with the School of Kinesiology, The University of Western Ontario and The Lawson Research Institute of St. Joseph’s Health Centre. This work was supported by The Natural Scien-ces and Engineering Council, Canada. Javier Padilla was supported by Escuela Superior de Medicina, COFAA-EDD-SIP-COTEPABE, Instituto Politécnico Nacional, CONACyT (2236), México. Special thanks to Dra. Alma Rosa Sánchez Conejo and Gustavo Acosta Altamirano, MD, DSci for their visionary facilities to publish this manuscript.
REFERENCES
1. Whipp BJ. Dynamics of pulmonary gas exchange. Circulation 1987; 76(Suppl. VI): VI18-VI28.
2. Whipp BJ, Davis JA, Torres F, Wasserman K. A test to deter-mine parameters of aerobic function during exercise. J Appl Physiol 1981; 50: 217-21.
3. Whipp BJ, Ward SA. Coupling of ventilation to pulmonary gas exchange during exercise. In: Whipp BJ, Wasserman K (eds.). Exercise: Pulmonary physiology and pathophysiology. New York, N.Y.: Marcel Dekker, Inc.; 1991, p. 271-307.
4. Whipp BJ. The bioenergetics and gas exchange basis of exercise testing. Clin Chest Med 1994; 15: 173-92.
5. Padilla JP, Kowalchuk JM, Taylor AW, Paterson DH. Determina-ción de la cinética de la fase dos transitoria de la VO
2 durante
6. Paterson DH, Whipp BJ. Asymmetries of oxygen uptake transients at the on- and off-set of heavy exercise in humans. J Physiol 1991; 443: 575-86.
7. Lamarra N. Ventilatory control, cardiac output, and gas-exchange dynamics during exercise transients in man. Ph. D. Thesis Dissertation, University of California, Los Angeles, California, U.S.A.; 1982, p. 1-300.
8. Bell C, Paterson DH, Kowalchuk JM, Padilla J, Cunningham DA. A comparison of modelling techniques used to characterise oxygen uptake kinetics during the on-transient of exercise. Exp Physiol 2001; 86(5): 667-76.
9. Poole DC, Barstow TJ, McDonough P, Jones AM. Control of Oxygen Uptake during Exercise. Med Sci Sports Exerc 2008; 40: 462-74.
10. Paterson DH, Cunningham DA, Babcock MA. Oxygen kinetics in the elderly. In: Swanson GD, Grodins FS, Hughson RL (eds.). Respiratory Control: A Modelling Perspective. New York: Plenum Press; 1989, p. 171-8.
11. Marsh GD, Paterson DH, Govindasamy D, Cunningham DA. Anaerobic power of the arms and legs of young and older men. Exp Physiol 1999; 84: 598-597.
12. Coggan AR, Spina RJ, King DS, Rogers MA, Brown M, Nemeth PM, Hollozy JO. Histochemical and enzymatic comparison of the gastrocnemius muscle of young and elderly men and women. J Gerontology 1992; 47: B71-B76.
13. Davis JA, Frank MH, Whipp BJ, Wasserman K. Anaerobic threshold alterations caused by endurance training in middle-aged men. J Appl Physiol 1979; 46: 1039-46.
14. Beaver WL, Lamarra N, Wasserman K. Breath-by-breath measurements of true alveolar gas exchange. J Appl Physiol 1981; 51: 1662-75.
15. Beaver WL, Wasserman K, Whipp BJ. A new method for detecting the anaerobic threshold by gas exchange. J Appl Physiol 1986; 60: 2020-7.
16. Wasserman K, Hansen JE, Sue DY, Whipp BJ. Principles of exercise testing and interpretation. Philadelphia: Lea Febiger; 1987.
17. Evans M, Hastings N, Peacock B. Statistical Distributions. 2nd Ed. Toronto: John Wiley Sons, Inc., A Wiley-Interscience Publication; 1993, p. 59-64.
18. Petrella RJ, Cunningham DA, Paterson DH. VO
2 on- transients
kinetics with a centrally acting calcium channel blocker. Adv Exp Med Biol 1995; 393: 201-5.
19. Chilibeck PD, Paterson DH, Petrella RJ, Cunningham DA. The influence of age and cardiorespiratory fitness on kinetics of oxygen uptake. Can J Appl Physiol 1996; 21: 185-96. 20. Young IH, Woolcock AJ. Changes in arterial blood gas
tensions during unsteady-state exercise. J Appl Physiol 1978; 44: 93-6.
21. Barstow TJ, Jones AM, Ynugen PH, Casaburi R. Influence of muscle fibre type and pedal frequency on oxygen
uptake kinetics of heavy exercise. J Appl Physiol 1996; 81: 1642-50.
22. MacDonald MJ, Pedersen PK, Hughson RL. Acceleration of VO
2 kinetics in heavy submaximal exercise by hyperoxia
and prior high- intensity exercise. J Appl Physiol 1997; 83: 1318-25.
23. Motulsky HJ, Ransnas A. Fitting curves to data using nonlinear regression: a practical and nonmathematical review. FASEB J 1987; 1: 365-74.
24. Marquardt DW. An algorithm for least-squares estimation of nonlinear parameters. J Soc Induct Appl Math 1963; 11(2): 431-41.
25. Zar JH. Biostatistical Analysis. 3rd Ed. New Jersey: Prentice Hall, Inc.; 1996, p. 50-1.
26. Åstrand I. Aerobic work capacity in men and women with special reference to age. Acta Physiol Scand 1960; 49(Suppl. 169).
27. Åstrand PO, Cuddy TE, Saltin B, Stenberg J. Cardiac output during submaximal and maximal work. J Appl Physiol 1964; 19: 268-74.
28. Whipp BJ, Lamarra N, Davis JA, Wasserman K. Parameters of ventilation and gas exchange dynamics during exercise. J Appl Physiol 1982; 52: 1506-13.
29. Rossiter HB, Ward SA, Doyle VL, Howe FA, Griffiths JR, Whipp BJ. Inferences from pulmonary O
2 uptake with respect to
intramuscular [PCr] kinetics during moderate exercise in humans. J Physiol 1999; 518: 921-32.
30. Grassi B. Skeletal muscle VO
2 on-kinetics: set by O2 delivery
or by O
2 utilization? New insights into an old issue. Med Sci
Sports Exerc 2000; 32(1): 108-16.
31. Casaburi R, Barstow TJ, Robinson T, Wasserman K. Influence of work rate on ventilatory and gas exchange kinetics. J Appl Physiol 1989; 67: 547-55.
32. Barstow TJ, Molé PA. Linear and nonlinear characteristics of oxygen uptake kinetics during heavy exercise. J Appl Physiol 1991; 71: 2099-106.
33. Bangsbo J. Muscle oxygen uptake during exercise. Acta Physiol Scand 2000; 168: 457-64.
34. Rossiter HB, Ward SA, Kowalchuk JM, Howe FA, Griffiths JR, Whipp BJ. Effects of prior exercise on oxygen uptake and phosphocreatine kinetics during high- intensity knee- extension exercise in humans. J Physiol 2001; 537: 291-303.
35. MacDonald MJ, Shoemaker JK, Tschakovsky ME, Hughson RL. Alveolar oxygen uptake and femoral artery blood flow dynamics in upright and supine leg exercise in humans. J Appl Physiol 1998; 85: 1622-8.
36. Oldenburg FA, McCormack DW, Morse JLC, Jones NL. A comparison of exercise responses in stair-climbing and cycling. J Appl Physiol 1979; 46: 510-16.
and O
2 uptake kinetics during whole body NMR spectroscopy.
J Appl Physiol 1999; 86: 742-7.
38. Tschakovsky ME, Hughson RL. Interaction of factors determining oxygen uptake at the onset of exercise. J Appl Physiol 1999; 86: 1101-13.
39. Brittain CJ, Rossiter HB, Kowalchuk JM, Whipp BJ. Effect of prior metabolic rate on the kinetics of oxygen uptake during moderate-intensity exercise. Eur J Appl Physiol 2001; 86: 125-34.
Solicitud de sobretiros:
Javier Padilla P. MD, MSc Fisiología del Ejercicio,
Escuela Superior de Medicina 3º Piso Instituto Politécnico Nacional, Casco de Santo Tomás, DMH, C.P. 11340, México, D.F.