Cell based high throughput screening assay for identification of G protein coupled receptors agonists and antagonists
6
0
0
Texto completo
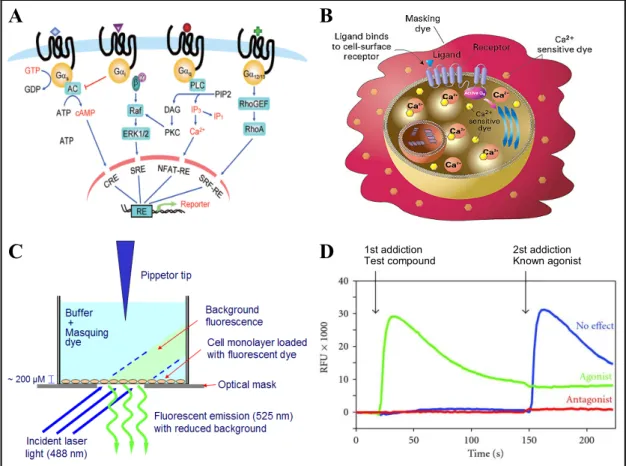
(2) Cell-Based HTS Assay GPCR Agonists and Antagonists. A. B. C. D. 1st addiction Test compound. 2st addiction Known agonist. Figure 1. A. Receptor binding and G-protein-dependent assays. Schematic representation of receptor binding and major pathways activated by different G proteins. Red indicates the detection points of commonly used HTS assays. B. Calcium mobilization assay. The calcium sensitive dye is taken into the cytoplasm of the cell during incubation. The masking dye remains outside the cell and blocks background fluorescence. Upon ligand binding to the receptor, calcium is released into the cytoplasm of the cell. The dye binds to the intracellular calcium and becomes fluorescent. C. FLIPR features. FLIPR system combines multiwell liquid addiction, simultaneous data acquisition and optic system for illumination and fluorescence detection. D. Assay format for the identification of an agonist and antagonist from a single screen. Test compound is added first followed by a second addition of a known agonist. An agonist will induce a FLIPR response immediately upon the addition of a test compound. An antagonist will cause a pharmacological blockade of the GPCR resulting in attenuation or complete lack of response to a known agonist. In the event of no receptor engagement, a normal agonist response will be observed from known agonist addition.. The introduction of simple statistical measurements, such as the Z prime factor (Z'), has facilitated creating a common tool to compare the quality of different assays [10]. In an ideal test assay, the active compounds must have a completely distinguishable behaviour from that of inactive compounds, which should allow its discrimination. The maximum and minimum control values must be reproducible and widely separated from each other and there would be no false positives or false negatives [11]. For a more detailed description on terminology related to HTS, see the glossary of terms used in biomolecular screening following IUPAC recommendations [12].. Materials and methods U-2 OS/Ga chimera stable cell line and BacMam Virus generation. U-2 OS (human osteosarcoma ATCC HTB-96; ATCC, Manassas, VA) stably expressing chimeric Gαqprotein was generated by the Biological Reagent Assay Development Division (BRAD). The cells are frozen and sent to the department of Screening and Compound Profiling (S&CP) where the assay was conducted. Recombinant GPCR BacMam was generated according to established protocols by BRAD. Transduction of U-2 OS/Gα Cells. Cells are thawed according to established protocols. U-2 OS/Gα are re-suspend in DMEM/F12 with 10% FBS to a final density of 250,000 cells/ml. BacMam are added with a titer of 7.4·108/ml. 50 µL of cells were plated in 384-well clear black bottomed poly-d-lysine tissue culture treated plates (12.500 cells/well). Cells were placed in an incubator at 37°C, 5% CO2, 95% humidity for 18-24 h to allow for GPCR expression.. dianas − Vol 2 | No 1 | marzo 2013 | e20130302 − 2.
(3) Cell-Based HTS Assay GPCR Agonists and Antagonists. Small-molecule library used for HTS and compound plates. Compound 384-well plates were prepared by Sample Management Technologies Department (SMTech) with 250 nL of the compounds dissolved in DMSO (dimethyl sulfoxide) at 1 mM using an Echo 555 acoustic liquid handler (Labcyte Inc.) and stored at 4 ºC. The small-molecule library of the Centro de Investigación Básica (CIB) at GlaxoSmithKline (GSK) in Tres Cantos was screened. The CIB library compound library contains approximately 2.5 million compounds. Column 6 was plated as unstimulated negative control, containing only DMSO and in the column 18 was added 30 mM of a known agonist as a positive control. FLIPR functional studies. The HTS campaign was conducted using a fully automated assay system with dual FLIPR384 fluorescence imagers (Molecular Devices). On the day of assay, cell plates were removed from the incubator, and culture medium was removed and replaced with a cell staining buffer containing calcium-sensitive dye prepared following manufacturer’s instructions (Calcium assay kit; Molecular Devices). Cells were dyeloaded with 20 µL of cell staining buffer at 37°C for 1 h. The dye is excited at the 488 nm wavelength with an Argon ion laser and a 515 nm emission filter was used. In each experiment baseline fluorescence after dye loading was adjusted to ≈15,000 fluorescence counts by adjusting the strength of the laser or changing the exposure time. Compounds were dissolved in 20 µL Tyrodes Buffer (Sigma) supplemented with 20 mM HEPES and 12 mM sodium bicarbonate. For the double addition protocols, initial readings by the first FLIPR (3 images at 1 sec intervals) of the cell plate were taken to assess loading uniformity. Following addition of 10 µL from the compounds plate to the cell plate at a final assay concentration of 4.1 µM with a 0.5% DMSO, 30 images were recorded at 1 sec intervals and then 30 at 2 sec intervals. This first read was used to determine direct agonist activation of the GPCR by the test compounds. Plates were then returned to the 37°C incubator for 30 to allow system to equilibrate. After the compound equilibration time, 10 µL of known agonist at a final concentration of 16 µM (EC80) was added by the second FLIPR in all wells and 30 readings were taken at 1 sec intervals and then 30 at 2 sec intervals. This second read was used to determine direct antagonist inactivation of the GPCR by the test compounds. Ca2+ mobilization was monitored as an increase in relative fluorescence units (RFU), by the FLIPRs and the AUC as well as difference between maximum and minimum RFU was calculated. ScreenWorks 3.1 software (Molecular Devices) is used for data collection. Data analysis was performed using ActivityBase (ID Business Solutions). Statistical analysis. Assay performance was judged by calculating the Z′ factor value and coefficient of variation (CV). Z′=1– 3(SDc++SDc–)/|Mc+–Mc–|; CV=SDc+/|Mc+–Mc–|. Signal-to-background ratio (S/B) was also used as a reference to evaluate the performance of the assay: S/B = Mc+/Mc–. SDc+ and SDc– represent standard deviation (SD) for the positive control and negative control, respectively. Mc+ and Mc– represent the mean for the positive control and negative control, respectively. The Z' was calculated from the measurements from the 8 positive and 8 negative control wells located in each plate. Only plates with a Z' < 0.4 were accepted.. Results and discussion Assay development and library screen. A dual-addiction assay format that could allow both agonists and antagonists to be distinguished in a single screen was developed. The diagram in Figure 1D describes the two step protocol where addition of the test compound (addition 1) is followed by the addition of known agonist (addition 2). Upon ligand binding to the receptor, Ca2+ is released into the cytoplasm of the cell. The calcium sensitive dye is taken into the cytoplasm of the cell during incubation. The kit's masking technology remains outside the cell and blocks background fluorescence. The dye binds to the intracellular calcium and becomes fluorescent. A Ca2+ mobilization response to the addition of a test compound would indicate its agonist activity. Besides, if the compound behaves as an antagonist, not only will there be an absence of response to this test compound, it will also decrease the effects of the following addition of known agonist. If there is no receptor inhibition by the test compound, a normal agonist response will be observed to a known agonist. Assay validation. The validation of the test consists of a series of steps necessary to ensure good assay robustness, performance reproducibility over the course of the screen and ability to discriminate active from nonactive compounds. This process is composed of 4 steps, the first of which applies to all assays transferred from an external laboratory. Step 0 consists of the initial test of the reagents that are going to be used in the HTS process. Step 1 is about the design of the operational procedure or workflow of the dianas − Vol 2 | No 1 | marzo 2013 | e20130302 − 3.
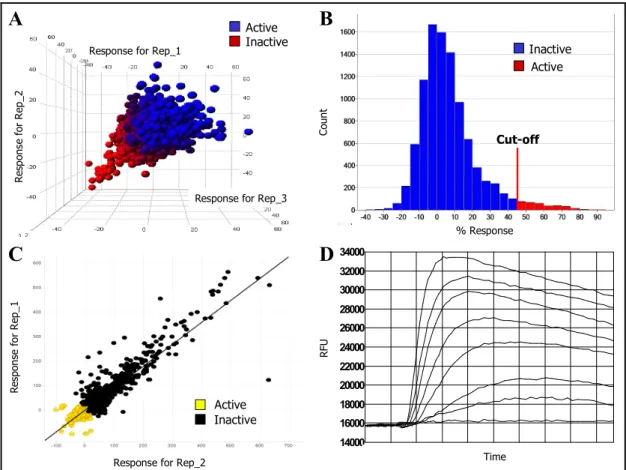
(4) Cell-Based HTS Assay GPCR Agonists and Antagonists. campaign. The objectives of steps 2 and 3 include the validation of HTS hardware and process but also the testing of statistical parameters of the assay as the values to determine the baseline values to monitor the quality of the primary trial, check the reproducibility of the assay, as well as the ability to distinguish correctly hits from no hits [13]. In step 3 was assayed a pilot screen of a small set of the compound collection in triplicate to estimate screening performance (Fig. 2A). In this step 28 plates were tested in triplicate in different days and on random order. This small collection includes a representation of a great diversity of chemotypes present in the GSK collection. The workflow was tested in a fully automated platform with 2 readers on line. Throughput was 180 plates/day in a 10 h operation time. Using a 45% activation threshold, the calculated hit rate was 0.7% for agonists and a 45% inhibition threshold submitted a 0.5% hit rate.. A. Active Inactive. Inactive Active. Count. Response for Rep_2. Response for Rep_1. B. Cut-off. Response for Rep_3 % Response. C. D 34000 32000. Response for Rep_1. 30000 28000 RFU. 26000 24000 22000 20000. Active Inactive. 18000 16000 14000 0. Response for Rep_2. 10. 20. 30. 40. 50 60 Time. 70. 80. 90. Figure 2. A. Assay Validation. Correlation plot for the 3 replicates of the validation collection. Compounds with more of 45% effect in 2 repetitions are defined as actives. B. Distribution of total agonist compound activities in the HTS campaign. The hit cut-off was set at 45 % response (3 times the standard deviation), generating a 0.7% hit rate. C. Hits Confirmation. Secondary screen of candidate GPCR agonists using parental cell line in the Ca2+ mobilization assay with the objective of removing compounds not interesting for the project. D. Example of dose dependent response induced by a candidate GPCR agonist as measured in Ca2+ mobilization assay.. The quality of assay results was monitored by determination of the Z' factor for each assay plate. The Z' factor remained greater than 0.7 for all plates, indicating the robustness and the suitability of the assay test, so the assay was validated. Primary screening. Figure 2B shows the primary screen of nearly 2.2 million compounds identified ≈14.000 compounds that behaved as agonists and ≈10.000 as antagonists. Compounds with more than 45% activation or 45% inhibition of GPCR at a concentration of 5 µM were designated as “hits” and subjected to further verification of activity. The cut-off for active agonist and antagonist was based on the mean effect of the minimum control and 3 times their SD. Hit Confirmation. Over-expression of chimeric G-proteins as well as GPCRs may cause artefacts, possibly caused by the interference of these proteins with multiple signal transduction pathways. Thus, the selected primary hits were “cherry-picked” and rescreened against the parental cell line, which lacks the chimeric G-protein and the receptor of interest, in order to discriminate compounds with endogenous activity. The assay was dianas − Vol 2 | No 1 | marzo 2013 | e20130302 − 4.
(5) Cell-Based HTS Assay GPCR Agonists and Antagonists. performed in duplicate on different days. The agonist confirmation hit response cut-off was set at 10% activation response (Fig. 2C). Compounds titration. The potency of a compound is indicative of the amount of it needed to obtain a certain effect. The potency of the agonist and antagonist compounds confirmed was the determined by assaying compounds as 11-point titrations (Fig. 2D). These compounds had a potency range, expressed as the EC50, of 0.1 to 5 µM. Lead generation. Once obtained a list of confirmed hits, along with supporting information on their potency and chemical features, it is decided which of them will continue in a lead generation program. It is very important set a quality assessment to include compounds with good drug-like properties to prevent attritions in a posterior development phase. For this it is necessary from the beginning to determine the characteristics of chemical integrity, structure-activity-relationship (SAR) as well as bio-physicochemical and absorption, distribution, metabolism and excretion (ADME) properties required [14].. Acknowledgements The author thanks his tutor Ana Ruiz for her assistance during the realization of this work and for her advice on the world of HTS. The author also thanks Maria Angeles Vivas for her technical assistance on the robotics platforms, FLIPR and many more devices, and in particular for teaching him to manufacture little boxes. A special thanks to Dr. Sergio Senar for his ideas and suggestions. The author also would like to acknowledge to the many people at GlaxoSmithKline for the good time we have enjoyed together.. References 1.. Pierce KL, Premont RT and Lefkowitz RJ. 2002. Seven-transmembrane receptors. Nat Rev Mol Cell Biol. 3(9):639-50.. 2.. Hopkins AL and Groom CR. 2002. The druggable genome. Nat Rev Drug Discov. 1(9):727-30.. 3.. Bourne HR, Sanders DA and McCormick F. 1991. The GTPase superfamily: conserved structure and molecular mechanism. Nature. 10;349(6305):117-27.. 4.. Hepler JR. 2003. RGS protein and G protein interactions: a little help from their friends. Mol Pharmacol. 64(3):547-9.. 5.. Liu K, Southall N, Titus SA, Inglese J, Eskay RL, Shinn P, Austin CP, Heilig MA and Zheng W. 2010. A multiplex calcium assay for identification of GPCR agonists and antagonists. Assay Drug Dev Technol. 8(3):367-79.. 6.. Inglese J, Johnson RL, Simeonov A, Xia M, Zheng W, Austin CP and Auld DS. 2007. Highthroughput screening assays for the identification of chemical probes. Nat Chem Biol. 3(8):466-79.. 7.. Schroeder KS and Neagle BD. 1996. FLIPR: A New Instrument for Accurate, High Throughput Optical Screening. J Biomol Screen 1996 1:75-80. 8.. Emkey R and Rankl NB. 2009. Screening G protein-coupled receptors: measurement of intracellular calcium using the fluorometric imaging plate reader. In: Janzen WP, Bernasconi P, editors. High Throughput Screening, Methods and Protocols. 2nd edition. Cambridge, MA. Humana Press. 14558.. 9.. Gribbon P, Chambers C, Palo K, Kupper J, Mueller J and Sewing A. 2006. A novel method for analyzing Ca2+. flux kinetics in high-throughput screening. J Biomol Screen. 11(5):511-8.. 10. Zhang JH, Chung TD, Oldenburg KR. 1999. A Simple Statistical Parameter for Use in Evaluation and Validation of High Throughput Screening Assays. J Biomol Screen. 4(2):67-73. 11. Shun TY, Lazo JS, Sharlow ER and Johnston PA. 2011. Identifying actives from HTS data sets: practical approaches for the selection of an appropriate HTS data-processing method and quality control review. J Biomol Screen. 16(1):1-14. 12. Proudfoot J, Nosjean O, Blanchard J, Wang J, Besson D, Crankshaw D, Gauglitz G, Hertzberg R, Homon C, Llewellyn L, Neubig R, Walker L and Villa P. 2011. Glossary of terms used in biomolecular screening (IUPAC Recommendations. Pure Appl. Chem. 83(5):1129-58. 13. Coma I, Clark L, Diez E, Harper G, Herranz J, Hofmann G, Lennon M, Richmond N, Valmaseda M and Macarron R. 2009. J Biomol Screen. 14(1):66-76. dianas − Vol 2 | No 1 | marzo 2013 | e20130302 − 5.
(6) Cell-Based HTS Assay GPCR Agonists and Antagonists. 14. Bleicher KH, Böhm HJ, Müller K and Alanine AI. 2003 Hit and lead generation: beyond highthroughput screening. Nat Rev Drug Discov. 2(5):369-78.. dianas − Vol 2 | No 1 | marzo 2013 | e20130302 − 6.
(7)
Figure
Documento similar
Thus, while SF significantly increases cell adhesion on the channel surface due to the supply by SF of additional binding motifs, still cell···cell binding is preferred
In the present study we have i) rationally designed variants of the CAC1 peptide to increase its solubility and CTD binding affinity; ii) mapped the binding site in CTD of CAC1
11 Deciphering the role of protein-protein interaction networks in the functional profiling of high-throughput experiments 81 11.1 Ppi networks in Gene Ontology
In many of the examples of compounds with direct coordination of the sulfonate group to the metal, there is an additional functional group in the ligand, or even an auxiliary
The results of gp15 lipid-binding assays showed an absence of interaction of the isolated gp15 oligomer with the lipid mixture, suggesting that gp15 tubular protein is unable
Toll-like receptor-4 (TLR4) signaling augments chemokine- induced neutrophil migration by modulating cell surface expression of chemokine receptors. Overexpression of G
In this work, we have undertaken the study of SUZ12, a Polycomb group protein and the microRNAs (miRNA) expressed by the oncogenic Epstein Barr Virus (EBV) in
Quería dar las gracias a todas esas personas con las que he compartido pasillos, sonrisas y buenos momentos durante estos años. Los vecinos
