ON THE USE OF ACOUSTIC PARTICLE VELOCITY TO FACE AIRBORNE
SOUND INSULATION
43.55.Rg
Rodríguez-Fernández, Cástor1; Fernández-Comesaña, Daniel2; San Millán-Castillo, Roberto3
1Sound of Numbers, S.L.; Av. Peregrina 21 P9 2A Ames - A Coruña (SPAIN); [email protected]
2 Microflown Technologies;Tivolilaan 205 - 6824 BV Arnhem(NETHERLANDS); [email protected]
3Rey Juan Carlos University; Campus de Fuenlabrada – Madrid(SPAIN); [email protected]
Key words: Particle Velocity, sound insulation, intensity measurements.
ABSTRACT
Airborne sound insulation testing by means of acoustic intensity is a versatile alternative to sound pressure classical methods. An extension of traditional p-p intensity-based method is used, assessing sound power in both sides of a sample under test. Direct particle velocity measurements let a proper estimation of walls transmission lost when having flanking contributions and complex sound fields. Pressure, velocity, and intensity mapping are provided to research sound power through a building element. Results are compared with ISO 10140 standard testing. An analysis of method benefits and drawbacks, and future research lines are presented.
RESUMEN
Another method for measuring Sound Transmission Loss using Sound Intensity is shown in this paper. Using PU probes instead of PP probe for Sound Intensity measurements, and acquiring and managing the data with Scan & Paint software make it possible to go through this method [3] easier and faster.
In this paper, a deeper study from a previous publication [4] was performed. In the following point 2, the same Experimental Evaluation than [4] is being described.
2. EXPERIMENTAL EVALUATION
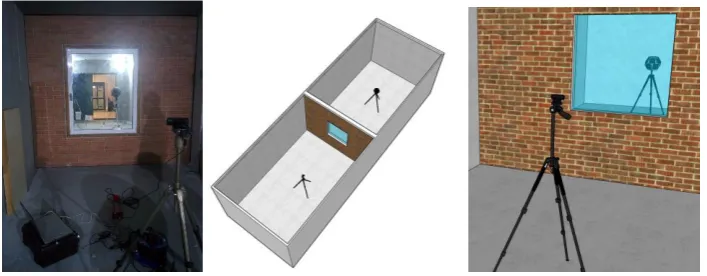
Thanks to the invaluable cooperation of the windows manufacturer Aluminios Cortizo, a validity test could be performed on a normalized chamber, where tests according to ISO 10140 are being usually performed.
2.1. Measuring Procedure
With the setup shown in Figure 1, using only one noise source position, we could perform Sound Intensity scanning on both sides of the sample. This test facility has been designed for windows sound insulation tests, thus the sample is composed by a brickwall and a window. The scanning is basically performed over the window sample.
[image:2.595.122.476.533.671.2]
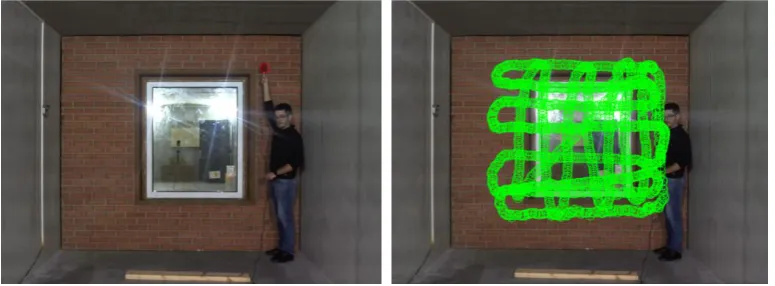
Figure 2 - Receiver room scanning
Figure 3 - Source room scanning
Scan&Paint software captures the position and acquires the sound data: sound pressure and particle velocity, in every position. It can be seen in Figure 2 and Figure 3 all the tracked positions when performing the scanning on both sides of the sample.
2.2. Data analysis
The data is processed following a grid structure.
With Scan&Paint we can visualize any of the performed scannings, getting Particle Velocity, Sound Pressure and Intensity (among others).
[image:3.595.105.493.297.440.2]Figure 4 - Averaged Particle Velocity 3000Hz-5000Hz
Figure 5 - Averaged Sound Pressure 3000Hz-5000Hz
[image:4.595.114.481.408.666.2]Figure 6 - Grid configuration for TL calculations
As shown in Figure 7, three different scanning distances from the sample have been chosen. The values acquired were quite similar, showing the diffusivity of the sound field in the source room, so only the closest scanning surface has been chosen.
Figure 7 – Source room positions
2.3. Results
Scan&Paint software calculates Transmission Loss and displays the results in an overlaid colormap, as it can be seen in Figure 8 and Figure 9. Figure 8 shows the averaged Transmission Loss in the frequency bands between 100 Hz and 3150 Hz. Figure 9 displays Transmission Loss in the 4000 Hz frequency band.
[image:5.595.87.510.381.480.2]Scan&Paint software can process the Transmission Loss spatial values and create a frequency averaging graph as it can be seen in Figure 10, where the results are also compared with the Transmission Loss values obtained following the process defined in the ISO 10140.
Figure 8 - Averaged Transmission Loss 100Hz-3150Hz
Figure 9 - Transmission Loss in 4000Hz band
Figure 10 - Comparison of Sound Transmission Loss results
3. CONCLUSIONS
As shown in Figure 10, a very good agreement is obtained between the Sound Transmission Loss measured in the test chamber using the sound intensity method and a PU probe, compared with the standardized 2 room method. Slightly better results are obtained using PU Intensity measurements since they are scarcely influenced by flanking paths as in ISO 10140 methods. So, on site sound insulation measurements can be comparable to those performed in a acoustic transmission suite.
20 25 30 35 40 45 50 55 60
[image:7.595.141.455.419.609.2]to the performance of the particle velocity sensor.
4. REFERENCES
[1] Lai, J.C.S.; Qi D., 1993. "Sound Transmission Loss Measurements Using the Sound Intensity Technique Part 1: The Effects of Reverberation Time", Applied Acoustics 40, 311 – 324.
[2] van Zyl, B-G-; Erasmus, P-J.; Anderson, F., 1987. “On the Formulation of the Intensity Method for Determining Sound Reduction Indices”, Applied Acoustics 22, 213 - 228.
[3] Fernández Comesaña, D.; Steltenpool, S.; Carrillo Pousa, G.; de Bree, H-E.; Holland, K., 2013. “Scan & Paint: Theory and Practice of a Sound Field Visualisation Method”, ISRN Mechanical Engineering 2013, Article ID 241958.