Factors Influencing the Usage and Selection of
Project Management Software
Matthew J. Liberatore and Bruce Pollack-Johnson
Abstract—The purpose of this paper is to analyze and assess those factors that influence the extent of usage, type of usage (plan-ning only versus plan(plan-ning and control), and selection of project management (PM) software by professionals in the field. Discrim-inant analysis is used to analyze hypotheses relating to these three issues. The analysis is based on the results of a random survey of members of the Project Management Institute. This research was guided by an organizing framework that considers environmental factors (demographics and work environment characteristics), in-termediate factors (PM software usage category and historical use patterns), and outcomes (level of software package selected). The analysis reveals strong differences in extent of usage, type of usage, and software selection based on individually significant environ-mental and intermediate factors. It also provides strong support for the hypotheses relating to extent of software use and level of software package used, while providing qualified support for the hypothesis relating to software use for planning only versus plan-ning and control. These results together validate the organizing framework. Adopters of PM software are advised to consider the findings concerning industry practice as well as their specific needs when selecting and deciding how to use PM software packages.
Index Terms—Business practice, practitioner survey, project management (PM), software, software selection, software use, technology adoption.
I. INTRODUCTION
A
S ORGANIZATIONS become flatter and leaner and more work is assigned to teams, project management (PM) has become more important than ever. The growth in using projects to organize and manage work in recent decades has led to a need for improved approaches for project analysis. Methods such as critical path analysis (CPM) with time-cost tradeoffs and the program evaluation and review technique (PERT) for risk analysis were developed to improve project planning and control. Additional methods such as Monte Carlo simulation for enhanced risk analysis and earned value for better tracking of work completed were developed to further improve project scheduling and cost management.The development of the personal computer (PC) in the mid-1980s accelerated the use of PM by making these tools and tech-niques easily available as part of integrated software packages. Most of the literature concerning these packages is descriptive
Manuscript received December 27, 2000; revised March 15, 2002. Review of this manuscript was arranged by Department Editor R. Balachandra.
M. J. Liberatore is with the Department of Decision and Information Tech-nologies, College of Commerce and Finance, Villanova University, Villanova, PA 19085 USA (e-mail: [email protected]).
B. Pollack-Johnson is with the Department of Mathematical Sciences, Col-lege of Liberal Arts and Sciences, Villanova University, Villanova, PA 19085 USA (e-mail: [email protected]).
Digital Object Identifier 10.1109/TEM.2003.810821
in nature. This literature describes the available packages and their features [10], [11], surveys desired software features [1], [2], and reviews and compares specific packages [4], [5], [8], [14], [16]. However, these studies give no indication of the ex-tent to which these packages are used in practice, how they are used, and why they are selected.
Decisions concerning PM software selection and usage have significant resource implications. The Gartner Group [6] estimates that vendors in the PM software tools market who also offer consulting services and support have total revenues of $800–$900 million per year which are expected to grow by as much as 20% per year. A recent survey [12] has shown that almost all PM professionals use PM software to some extent. Potential adopters and current users of PM software are faced with the problem of deciding the extent to which they will use PM software and the level of software package(s) that will best suit their needs. Fox and Spence [5] do a limited analysis of the relationships between industry and project duration as they affect PM software selection. However, there are no reported studies that statistically analyze a broader set of influencing factors.
The purpose of this paper is to provide a statistical anal-ysis and assessment of those factors that influence the extent of usage, type of usage, and selection of PM software. Specifically, this study provides guidance for individuals or organizations in the selection of level of package depending upon their work en-vironment and specific needs; and improved understanding of the relationships between work environment factors and soft-ware usage patterns.
II. SURVEY
To address these issues, we randomly surveyed members of the Project Management Institute (PMI), the largest PM pro-fessional organization in the world. The survey comprises 31 questions (see the attached appendix), and gathers information on work environment and demographic factors, PM software usage, and PM technique usage. The survey was evaluated and pretested by several PMI members as well as an evaluation pro-fessional with extensive survey development experience.
With the cooperation of PMI, the survey was sent to a random sample of 688 members. After two mailings and a telephone fol-lowup, we obtained 240 responses, for a response rate of 35%. This response rate is quite a bit higher than the 10%–20% rate usually obtained for surveys of this kind [3].
Validation: The distribution of respondents across industries matches very closely that of PMI as a whole, with the exception of the engineering category (Fig. 1). The latter result apparently
Fig. 1. Type of firm. Comparison of respondent data with PMI membership data.
occurred because more respondents selected engineering as a second category option on our survey than was done by PMI members when joining. Selection of a second category was al-lowed on our survey but is not possible on the PMI membership application.
Nonresponse Bias: A random sample of 100 nonrespon-dents was contacted via telephone to check for nonresponse bias. After repeated attempts, we were able to reach 20 of these individuals. The main reasons given for nonresponse were lack of involvement or interest in the field (people who had retired or moved on to other jobs or fields). This suggests that one pos-sible bias would be that the respondents are likely to be more engaged in the profession than would be true proportionately on the rolls of PMI. This may in fact be a preferable population for the purposes of this study.
III. BACKGROUND ANDSUMMARY OFKEYFINDINGS
In this section, we briefly present highlights of our initial find-ings that led to the hypotheses tested in this study (see [12] for further details).
A. Demographics
About 57% of the respondents work for organizations having 1000 or more employees, while 15% work in organizations having fewer than 50 employees. The respondents display a fairly uniform range of experience in PM activities, with a median of 13 years in the profession. Over 90% of the respondents spend 20% or more of their time in PM activities, and nearly 40% spend all of their time in PM. Of the specific typical projects reported by the respondents, the median size is a little over 150 activities. Over 40% of the respondents work on four or fewer projects during the 12 months previous to the study, and the percentage drops smoothly from that point for larger numbers of projects.
B. PM Software Use
A dramatic surge in growth in the initial usage of PM soft-ware occurred in the early 1980s, which undoubtedly reflects
the introduction of the PC. This period was followed by high and fairly steady growth in initial users thereafter, until satura-tion at a little over 90% occurred around 1995. The percent of respondents using software over time can be thought of as the adoption of a new technology and so can be modeled using a logistic curve ( ; see Fig. 2). About 90% of respon-dents planned to use PM software during the year following the survey (5% were unsure). The latter result is reasonably consis-tent with a reader survey of industrial engineers that found 80% used PM software [2]. Over the five years before our survey, the percentage of those not using software dropped from 35% to 9%, while the percentage of those using software for all of their projects increased from 28% to 51%.
The biggest self-reported factors influencing the use of PM software, both positively and negatively, are the size and com-plexity of projects. Requests or requirements, software capabil-ities, and hardware/software availability are also strong positive influencing factors, but less significant on the negative side.
C. PM Software Package Selection
Survey respondents indicated which PM software package they used most frequently during the previous 12 months. The top package mentioned was Microsoft Project (nearly 50% of respondents), followed by Primavera Project Planner (P3) at 21%, with all others at 5% or less (see Table I on package use overall and by industry). Notice that the patterns of software package used vary considerably across industries. In a more detailed analysis, we tested whether respondents from one in-dustry versus all others had significantly different usage pat-terns when the packages were categorized as MS Project, P3, and all others (grouped together because of small cell counts). Significant differences were found for the construction, com-puters/software/data processing services, telecom services, and engineering services, and are noted in Table I.
Fig. 2. Logistic model for adoption of PM software. Note: The fitted logistics model isy = 100%/(1 + 3 260 000 000e ^ (00:250x)).
TABLE I
PRIMARYUSAGE OFPM SOFTWAREPACKAGES BYINDUSTRY
NOTES: =Not applicable because cell counts were too small.
* Significant at the 0.10 level based on a chi-square test of industry versus non-industry respondents. ** Significant at the 0.05 level based on a chi-square test of industry versus non-industry respondents. *** Significant at the 0.01 level based on a chi-square test of industry versus non-industry respondents. y percentages shown in each cell (by industry)
yy all respondents answering those questions (N=210)
features and/or the ability to handle larger-sized projects and perform more multiproject management tasks. The most prominent high-end package used by the respondents is P3, while its low-end counterpart is Microsoft Project. There are about twice as many low-end users as high-end users.
D. Type of PM Software Use
Fig. 3. Organizing framework.
resources required to complete each project task, identifying project milestones, and developing a work breakdown struc-ture, schedule, and budget. “Control” includes the activities of monitoring project performance and making changes to the project plan as necessary. “Planning only” users employ the software primarily during the startup of the project, while those that apply it for control as well are employing it continually throughout the project life cycle. This distinction is important since it provides a broad classification of how PM professionals assess their software needs [9].
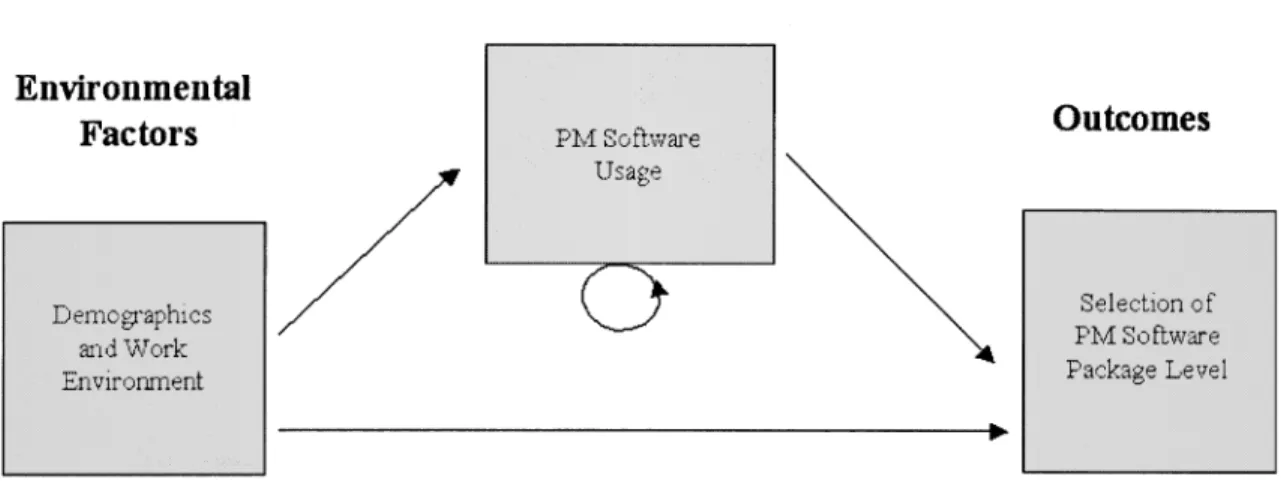
IV. ORGANIZINGFRAMEWORK
An organizing framework was created to guide a deeper anal-ysis of the survey results summarized previously (see Fig. 3). This framework consists of environmental factors, intermediate factors, and outcomes. Each of these is described in the fol-lowing.
Environmental Factors: Demographics and Work Environ-ment: This group includes the following factors:
1) firm size category based on total number of employees;1
2) percent of work effort in PM;
3) years of experience in PM as a team member or leader; 4) number of activities in a typical project;
5) number of projects worked on during the preceding 12 months.
Intermediate Factors: PM Software Usage: This group in-cludes the following factors:
1) software use category (project planning only versus plan-ning and control);
2) initial year of software usage;
3) percent of projects worked on that used PM software (in the preceding year, two years earlier, and five years ear-lier).
Outcomes: Selection of PM Software Package Level: This group considers the level (high- versus low-end) of the
respon-1The firm size categories are as follows: under 50, 50–99, 100–999,
1000–9999, 10 000–99 999, 100 000 or more.
dent’s most frequently used software package over the year pre-ceding the study.
The arrows in Fig. 3 represent the hypothesized relationships of this study. Higher values of each of the environmental factors were thought to positively influence the use of PM software for planning and control, extent of PM software usage, and the selection of high-end PM software packages. Higher levels of PM software use for planning and control, earlier initial year of PM software use and higher extent of use of PM software were thought to mutually influence each other and also lead to the selection of high-end PM software packages.
Specifically, the following hypotheses are addressed in this study.
H1: The environmental and intermediate factors given in the organizing framework are significant in explaining higher versus lower usage of PM software during the previous year.
H2: The environmental and intermediate factors given in the organizing framework are significant in explaining the use of PM software for planning only versus plan-ning and control.
H3: The environmental and intermediate factors given in the organizing framework are significant in explaining the selection of high- versus low-end PM software packages.
V. ANALYSIS
A. Approach
TABLE II CORRELATIONS
multicollinearity among the research variables [7]. This group of variables was used as the source of the independent variables used to test the three hypotheses.
For H1, the dependent variable is derived from the percent of projects that used PM Software during the year prior to the study. Since 51% of the respondents used software for all of their projects, the dependent variable called extent of use is cat-egorical, where the first category includes software usage at less than 100% of their projects during the year to the prior to the study, while the second category is usage at the 100% level during the same time period.
For H2, the dependent variable is categorical, where the first category is PM software usage for project planning only, while the second category is software usage for planning and control. For H3, the dependent variable is categorical, where the first cat-egory is primary use of a low-end PM software package, while the second category is primary use of a high-end package.
The capability of the variables representing the environ-mental and intermediate factors to explain differences in the three dependent variables is tested using discriminant analysis. Discriminant analysis is a technique that is used to study the ability to discriminate or predict membership in two or more groups using two or more independent variables simultaneously. It is appropriate when the dependent variable is categorical and the independent variables are metric; that is, when the variables have a constant unit of measurement, such as interval or ratio scale data [7]. Other approaches can also be used to model the adoption of new information technologies and software, such as the Technology Acceptance Model (TAM) [13].
For each hypothesis, we begin by performing a one-way anal-ysis of variance (ANOVA) for each of the dependent variables versus all of the independent variables included in the correla-tion analysis.2 Only those independent variables that are
signif-icant at the 0.10 level are included in the discriminant analysis.
B. H1: Extent of PM Software Use
Table III shows the results of the ANOVA tests for the equality of group means. Firm size, years of experience, and initial year of software use are not significant at the 0.10 level and so are eliminated from further analysis. The discriminant analysis includes percent work in PM, number of projects, percent software use two years and five years ago, and number of activities as independent variables. According to the Wilks’ lambda of 0.606 (chi-square 94.447, degrees of freedom 5, 0.001, 193 valid cases) the discriminant function is sig-nificant in explaining the difference between those respondents using PM software on less than 100% of their projects versus those using it for all projects.
A test of the effectiveness of the discriminant function is the degree of its predictive accuracy, as measured by the percentage of cases classified correctly. The discriminant function classifies 78.2% of the cases correctly, which exceeds by 74% the hit ratio of 50.7% that would be expected due to chance. This result sat-isfies the rule of thumb that the percentage of cases classified correctly should be at least 25% greater than that achieved by
2The only exception is in the testing of H1, where the percent of software use
TABLE IV
DISCRIMINANTANALYSIS OFEXTENT OFPM SOFTWAREUSE: FULLMODEL
chance [7]. The individual correct classification rates are 76.5% for the less than 100% group and 79.6% for the 100% group.
Press’ statistic is used to test the discriminatory power of the classification matrix when compared to a chance model. The statistic for our model is 61.56, and follows a chi-square distribution with one degree of freedom. The appropriate chi-square statistic is 10.83 ( ), indicating that our model’s predictions are better than chance [7].
The discriminant loadings or structure correlations show how closely a variable and the discriminant function are related. The discriminant loadings reflect the variance that the independent variables share with the discriminant function and can be used to assess the relative contribution (i.e., practical significance or im-portance) of each independent variable to the discriminant func-tion. A common rule of thumb is that any variables exhibiting discriminant loadings greater than or equal to 0.30 are consid-ered significant [7]. As shown in Table IV, percent software use two years and five years ago, and number of activities provide a significant contribution to the discriminant function. The results of the discriminant analysis clearly indicate that these variables are strong discriminating factors, both individually and together, for extent of PM software usage.
Interestingly, the sign of the discriminant loading for the number of projects is negative, indicating that those respondents using software for all of their projects tend to work on a fewer number of projects. This finding is due at least in part to the fact that people working on fewer projects tend to work on projects with larger numbers of activities as evidenced by the negative correlation between these variables (Table II). The weakness of this correlation may relate to the fact that the typical project selected by the respondent may not be the largest one that was being managed. When a respondent works on projects with both large and small numbers of activities, the larger project(s) are likely to induce software use for all projects.
One might argue that including percent software use two years and five years ago into our discriminant model limits the insight gained. Both of these variables are strongly correlated to percent software use during the year prior to the study and can be thought of as simply reflecting historical momentum. Therefore, we eliminate both of these variables to see if the remaining three variables alone can offer similar levels of predictive accuracy. The Wilks’ lambda of 0.873 (chi-square 26.762, degrees of freedom 3, 0.001, 201 valid cases) indicates that the model is still significant. The discriminant function classifies 70.6% of the cases correctly, which exceeds by 39% the hit ratio of 50.8% that would be expected due to chance. The F-statistics show that percent work in PM, number of projects, and number of activities are significant, and the discriminant loadings of these variables are all greater than or equal to 0.30 (Table V). These results support the inclusion of all five variables into the full discriminant model (Table IV).
C. H2: Use of PM Software for Planning Only versus Planning and Control
Table VI shows the results of the ANOVA tests for the equality of group means. Years of experience, initial year of PM software use, and number of projects are not significant at the 0.10 level and so are eliminated from further analysis. The discriminant analysis includes number of activities, firm size, percent work in PM, and percent of projects worked on that used PM software in the preceding year, two years earlier, and five years earlier as independent variables. According to the Wilks’ lambda of 0.816 (chi-square 37.090, degrees of freedom 6, 0.001, 187 valid cases) the discriminant function is significant in explaining the difference between those respondents using PM software for planning only versus those using it for planning and control.
TABLE VII
ANOVA TESTS OFEQUALITY OFGROUPMEANS FORLOW VERSUS. HIGH-END
PM SOFTWAREPACKAGES
group sizes, the hit ratio that would be expected due to chance is 73.1%. Applying the 25% rule of thumb, the discriminant function would have to classify 91.4% of the cases correctly, an extremely difficult task. Although number of activities, firm size, percent work in PM, and percent of projects that used PM Software in the preceding year, two years earlier, and five years earlier were significant individually in distinguishing between those respondents using software for planning versus planning and control, the discriminant function does not meet the difficult classification threshold established because of the uneven group sizes.
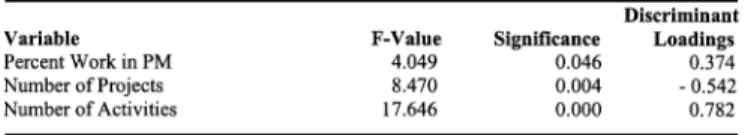
D. H3: Level of PM Software Package
Table VII shows the results of the ANOVA tests for the equality of group means. Years of experience, percent work in PM, and number of projects are not significant at the 0.10 level and so are eliminated from further analysis. Interestingly, percent PM software use two and five years prior have higher levels of significance than software use during the preceding year in explaining package level selected. This finding may indicate that the respondents are reluctant to change package level even if percent software use changes.
The discriminant analysis includes number of activities, firm size, initial year of PM software use, and percent of projects worked on that used PM Software in the preceding year, two years earlier, and five years earlier as independent variables. Ac-cording to the Wilks’ lambda of 0.859 (chi-square 24.611, degrees of freedom 6, 0.001, 167 valid cases) the dis-criminant function is significant in explaining the difference be-tween those respondents using low-end PM software packages and those using high-end packages.
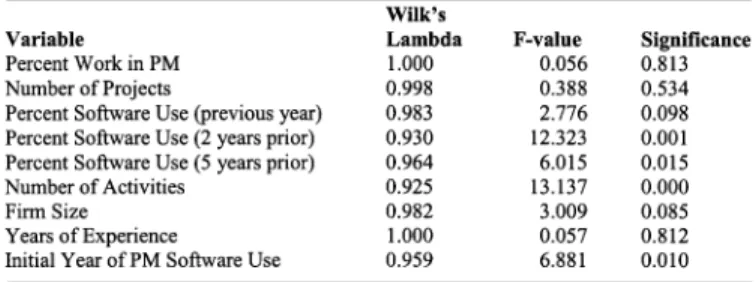
The discriminant function classifies 68.9% of the cases cor-rectly, which satisfies the rule of thumb mentioned previously since the result exceeds by 25.3% the hit ratio of 55.0% that would be expected due to chance. The individual correct clas-sification rates are 71.8% for the low-end package group and 63.2% for the high-end package group. Press’ statistic for our model is 23.77 ( 0.001), indicating that our model’s predictions are better than chance. As shown in Table VIII, the magnitudes of the discriminant loadings show that all of the variables included in the model are strong discriminating fac-tors. The negative sign for the initial year of PM software use discriminant loading indicates that those respondents that use high-end packages were earlier adopters of PM software. The
TABLE VIII
DISCRIMINANTANALYSIS OFLOW VERSUS. HIGH-ENDPM SOFTWARE
PACKAGES
results of the discriminant analysis indicate clearly that number of activities, firm size, initial year of PM software use, and per-cent of projects worked on that used PM software in the pre-ceding year, two years earlier, and five years earlier, are strong discriminating factors, both individually and together, for level of PM software package used.
We note that years of experience in PM is never significant in explaining the differences found across the respondents relating to extent of PM software use, planning only versus planning and control, and level of package use. Experience as measured by initial year of software use is a discriminating factor in package level used. The number of activities in a typical project and per-cent of PM software use are significant variables for all three hypotheses tested.
VI. CONCLUSION
Our results suggest that usage of PM software took off in the 1980s with the advent of the personal computer, and reached saturation at 90%–95% of PM professionals as of the middle of the 1990s. The strongest self-reported factors influencing PM software usage, both positively and negatively, are the size and complexity of projects (larger and more complex projects pushing PM professionals to use the software more). The two packages that stand out in usage are Microsoft Project and P3, although there are significant differences in the packages chosen within different industry groups. In particular, older industries with a strong history of PM (construction and engineering ser-vices) make heavier use of the more high-end packages (such as Primavera), while the newer, more technological industries (computer software/data processing and telecom services) make heavier use of the simpler, less-expensive packages (such as Mi-crosoft Project). This seems to reflect a basic relationship be-tween the age of the industry and the level of PM software used. Overall, the sophistication of PM software usage is very high, with 80% of PM professionals using it for both planning and control.
The results also suggest that use of PM software for planning only versus planning and control is significantly influenced in-dividually by the number of activities in a typical project, firm size, the extent of PM software usage, and percent of work in PM. Higher levels of each variable are associated with planning and control. These relationships make sense intuitively, since work complexity increases the need for formalized control, and since experience with the software and higher involvement in PM would also tend to be associated with more sophisticated uses of the software. Unfortunately, the highly unequal group sizes make a useful discriminant analysis model unattainable.
Finally, our results indicate that the level of PM software package selected by PM professionals is significantly influ-enced individually by the number of activities in a typical project, firm size, the initial year of PM software use, and the extent of PM software usage. Higher levels of each variable are associated with use of higher-end packages, with the only exception being initial year of PM software use. In the latter case, earlier use of the software is associated with higher-end package selection, as would be expected. The other relation-ships also seem logical, since higher levels of complexity and higher use of the software would tend to be associated with more specialized and sophisticated uses of the software, in addition to the fact that larger firms can usually afford more expensive software. We were able to identify a discriminant analysis model that makes excellent predictions of package level based on these variables.
It is interesting to note that years of experience is not a signif-icant predictor for any of the dependent variables that were used in testing the three hypotheses. Other work environment factors are much more important. Perhaps the effects of understanding the field of PM better and having more recent initial training (likely to involve more technology) neutralize each other.
The results of this study may be of assistance to PM pro-fessionals in deciding whether or not to use PM software, in selecting a package, and in deciding how they want to use the software. The results suggest that, depending on their work en-vironment, especially their industry, firm size, percent work in PM, number of projects worked on and typical number of ac-tivities in each project, and their history of PM software usage, their choices for all of these decisions should probably be quite different.
Some results that we hoped to obtain were not possible be-cause of the nature of the data itself, such as not being able to
inevitable.
EDITORIALSTATEMENT
This paper analyzes and assesses the demographic, work en-vironment, and software-related factors that influence the extent of usage, type of usage (planning only versus planning and con-trol), and selection of PM software packages by professionals in the field. Adopters of PM software are advised to consider these results and the findings concerning industry practice as well as their specific needs when selecting and deciding how to use PM software packages.
APPENDIX
See the following Survey on the Use of Project Management Software at the end of the paper.
ACKNOWLEDGMENT
The authors would like to acknowledge the assistance of PMI in survey administration, and the support of their graduate assis-tants, C. Hyppolite and C. Smith.
REFERENCES
[1] A. Allnoch, “Choosing the right project management software for your company,” IIE Solutions, vol. 29, no. 3, pp. 38–41, 1997.
[2] G. Bounds, “The last word on project management,” IIE Solutions, vol. 30, no. 11, pp. 41–43, 1998.
[3] W. Dillon, T. Madden, and N. Firtle, Marketing Research in a Marketing Environment, 3rd ed. Burr Ridge, IL: Irwin, 1994.
[4] A. Feibus, “Project leaders,” Inform. Week, no. 694, pp. 1a–10a, 1998. [5] T. L. Fox and J. W. Spence, “Tools of the trade: A survey of project
management tools,” Project Manage. J., vol. 29, no. 3, pp. 20–27, 1998. [6] Gartner Group, private communication, 1999.
[7] J. F. Hair, Jr., R. E. Anderson, R. L. Tatham, and W. C. Black, Mul-tivariate Data Analysis, 5th ed. Englewood Cliffs, NJ: Prentice-Hall, 1998.
[8] T. M. Hegazy and H. El-Zamzamy, “Project management software that meets the challenge,” Cost Eng., vol. 40, no. 5, pp. 25–33, 1998. [9] H. A. Levine, Project Management Using Microcomputers. Berkeley,
CA: Osborne McGraw-Hill, 1986.
[10] “PM software survey,” PM Network, vol. 8, no. 5, pp. 33–41, 1994. [11] “PM software survey,” PM Network, vol. 10, no. 9, pp. 27–40, 1996. [12] B. Pollack-Johnson and M. J. Liberatore, “Project management
soft-ware usage patterns and suggested research directions for future devel-opments,” Project Manage. J., vol. 20, no. 2, pp. 19–28, 1998. [13] R. A. Prasad, “Are individual differences germane to the acceptance
of new information technologies?,” Decision Sci., vol. 30, no. 2, pp. 361–391, 1999.
[15] SPSS for Windows, Release 10.0.7. Chicago, IL: SPSS Inc., 2000. [16] J. Walsh, “Primavera, Microsoft to face off on project management,”
Infoworld, p. 29, June 2, 1997.
Matthew J. Liberatore received the B.A. degree in
mathematics and the M.S. and Ph.D. degrees in oper-ations research, from the University of Pennsylvania, Philadelphia.
He joined Villanova University, Villanova, PA, in 1983 and served as Chair of the Department of Man-agement from 1989 to 1995 and as Associate Dean from 1996 until 1999. He is currently the John F. Con-nelly Chair in Management and Professor of Decision and Information Technologies in the College of Com-merce and Finance, Villanova University. He previ-ously taught at Temple University, Philadelphia, PA, and held management po-sitions at RCA, Philadelphia, PA, and FMC Corporation, Princeton, NJ. He has published over 60 papers in the fields of management science, information sys-tems, PM, and research and engineering management. His current research fo-cuses on project schedule uncertainty analysis and decision support systems for health care and technology-based organizations.
Dr. Liberatore currently serves on the Editorial Boards of the IEEE TRANSACTIONS ONENGINEERINGMANAGEMENTand the American Journal of Mathematical and Management Sciences. He previously served on the Board of Entrepreneurship Theory and Practice. He is a member of the Decision Sciences Institute, the Institute for Operations Research and Management, and the Project Management Institute. He previously served as an Area Editor for production and operations management for Interfaces.
Bruce Pollack-Johnson received the B.A. degree in
sociology (with a minor in education) from Brandeis University, Waltham, MA, the M.A. degree in applied mathematics from Temple University, Philadelphia, PA, and the M.S. and Ph.D. degrees in operations re-search from the University of Pennsylvania, Philadel-phia.
He has previously taught at Oberlin College, Oberlin, OH, and is currently an Associate Professor of Mathematical Sciences, Villanova University, Villanova, PA. He has published dozens of papers on PM, forecasting, educational modeling, and on teaching applied mathematics, as well as a two-volume text on business calculus and finite mathematics (par-tially funded by grants from the U.S. Department of Education’s Fund for the Improvement of Postsecondary Education, the National Science Foundation, and Prentice-Hall). His current research is on modeling uncertainty in project scheduling.