SERIE DOCUMENTOS DE TRABAJO
No. 106
Agosto 2011
BEYOND DIVIDE AND RULE: WEAK DICTATORS, NATURAL
RESOURCES AND CIVIL CONFLICT
Beyond Divide and Rule: Weak Dictators, Natural
Resources and Civil Conflict
∗
Giacomo De Luca
†Petros G. Sekeris
‡Juan F. Vargas
§August 2011
Abstract
We propose a model where an autocrat rules over an ethnically divided society. The dictator selects the tax rate over domestic production and the nation’s natural resources to maximize his rents under the threat of a regime-switching revolution. We show that a weak ruler may let the country plunge in civil war to increase his personal rents. Inter-group fighting weakens potential opposition to the ruler, thereby allowing him to increase fiscal pressure. We show that the presence of natural resources exacerbates the incentives of the ruler to promote civil conflict for his own profit, especially if the resources are unequally distributed across ethnic groups. We validate the main predictions of the model using cross-country data over the period 1960-2007, and show that our empirical results are not likely to be driven by omitted observable determinants of civil war incidence or by unobservable country-specific heterogeneity.
“While Two Dispute, the Third Enjoys”.
Popular Italian proverb.
∗We thank Gani Aldashev, Agnese Sacchi, Marijke Verpoorteren, Andeas Zenth¨ofer, and participants at
the NEUDC 2010 conference, the Global Economic Costs of Conflict 2011 conference, and several depart-mental seminars for their valuable comments.
†LICOS - University of Leuven, Belgium. E-mail: giacomo.deluca@econ.kuleuven.be.
‡Belgian National Research Fund (FNRS) post-doctoral researcher at CRED, University of Namur,
Bel-gium. E-mail: psekeris@fundp.ac.be.
1
Introduction
In many countries around the world, autocrats impose highly rapacious policies on their
population and yet manage to remain in power for long periods of time. Surprisingly, such
practices have also been observed in countries plagued by internal civil strife in spite of
the potential threat these conflicts constitute to the government’s stability (Reno 1998).
The weakly institutionalized environment characterizing these societies implies that
demo-cratic instruments available to balance the power of the ruling elites are limited and highly
dysfunctional: legislators and interest groups are typically co-opted by the elite and, as a
consequence, elections fall short of disciplining ill-performing leaders (Gandhi and Przeworski
2006). Such de facto dictatorships have been studied by scholars who emphasize the web of
personal ties and targeted transfers which guarantee the stability of the elites (Bates 1981
and Jackson and Rosberg 1984).1
Acemoglu et al. (2004) explore a strategy - which they call Divide-and-Rule - adopted
by rulers who seek to implement more profitable kleptocratic policies by weakening the
opposition. They propose a model whereby the ruler can be overthrown only if a sufficiently
large opposition is mobilized. The ruler prevents this collective action by providing selective
incentives, thereby making it impossible for a successful challenging coalition to emerge.
Padro i Miquel (2007) considers an alternative strategy of regime survival implemented by
rent-extracting autocrats in ethnically divided societies. The proposed mechanism rests on
what the author defines asThe Politics of Fear. Indeed, “[T]he fear to fall under an equally
inefficient and venal ruler that favors another group is sufficient to discipline supporters”
(Padro i Miquel 2007: 1260). In other words, by dampening the livelihood of the other ethnic
groups, the ruler obtains support from his own group and still manages to extract rents from
them. The co-ethnics’ obedience is rooted in the fear of receiving a worse treatment under
the potential rule of a non co-ethnic leader.
1
In line with Padro i Miquel (2007) we propose a model whereby an autocrat rules over
an ethnically divided society. The ruler selects the tax rates on income and on natural
resources that maximize his private rents under the threat of rebellion: While the ruler
is not accountable to the people through elections, his power can be challenged through
popular uprising. If the rebellion is successful, the ruler loses the capacity to levy taxes.
We characterize the equilibrium conditions under which it is in the interest of the ruler to
let an civil conflict among ethnic groups to escalate within the boundaries of his country.
Inter-group violence weakens the citizens’ potential to collectively revolt against the ruler,
hence allowing the latter to increase the fiscal pressure without risking his power.
Our simple model delivers three novel predictions. First, we show that weaker rulers
profit more from the emergence of a civil strife. Second, we show that the ruler’s gains
from internal conflict are larger the greater is the country’s endowment of natural resources.
Indeed, when the ruler’s income is mainly derived from taxing natural resources, the costs
of inter-ethnic violence are lower since violence affects especially labor production. In turn,
the potential gains from conflict are large because in the face of weakened ethnic groups the
ruler can capture a larger share of the natural resources without triggering a revolution.2 Third, the ruler’s gains from internal conflict are larger if resources are distributed unequally
across ethnic groups.
While the salience of ethnic divisions in triggering civil conflicts has received mixed
sup-port by empirical studies (Fearon and Laitin 2003, Collier and Hoeffler 2004, Montalvo and
Reynal-Querol 2005), ethnic violence has been widely studied in conflict theory. Yet, most
contributions explain ethnic conflicts by exploring only the incentives of the parties directly
involved in the dispute (Caselli and Coleman II 2006, Esteban and Ray 2008, Esteban et al.
2010). Instead, we emphasize a mechanism that highlights the incentives of an individual
ruler above and beyond his ethnic identity. Indeed, the private interests of a rent seeking
2
autocrat are not necessarily aligned with those of his ethnic base. Considering the ruler as a
separate agent is an abstraction that helps us explore the proposed mechanism theoretically.
The incentives for a ruler to stress the ethnic divide have already been addressed in
the literature (E.g. Fearon and Laitin 2000). According to Snyder and Ballentine (1996)
and Snyder (2000), political elites exploit the nationalistic argument in newly democratizing
countries as a way to preserve their dominant position. Similarly, Glaeser (2005) proposes
a theory in which political leaders dig existing societal cleavages by conveying messages
that exacerbate hatred between groups with the ultimate goal of fostering electoral support
for particular policies. We push this argument one step further and argue that a ruler
might consciously let inter-ethnic violence degenerate into a destructive conflict in order to
maximize his personal rents.3
We illustrate our formal argument with case studies from the recent history of Africa.
Most importantly, however, we provide robust cross-country empirical evidence which is
consistent with our main theoretical predictions. In particular, using a dataset on
con-flict incidence as well as novel data on presence of oil and diamonds fields over the period
1960-2007, we show that the likelihood of autocratic and ethnically-polarized countries
expe-riencing civil war is higher when weak rulers govern states endowed with natural resources.
This finding is robust to controlling for the variables identified by the recent literature on
civil war as the most robust correlates of conflict (Collier and Hoeffler 2004; Fearon and
Laitin 2003), as well as to the inclusion of regional dummies. In addition the results survive
the inclusion of country and time fixed effects. This suggest both that our theory can also
account for the within-country variation overtime in the exploitation of natural resources,
the autocracy level, and the relative weakness of the ruler, and that the results are not driven
by year specific shocks common across countries.
3
The rest of the paper is organized as follows. Section 2 discusses anecdotal evidence
from recent conflict among ethnic groups in Nigeria and Kenya, which were exploited by
the countries’ rulers to pursue their personal interests. We develop the theoretical model in
section 3 and present the empirical analysis in section 4. Section 5 concludes.
2
Anecdotal evidence from recent history
2.1
Nigeria
In 1993, in the middle of widespread economic downturn, General Sani Abacha seized
po-litical power and was the de facto President of Nigeria until 1998. Driven by the drop of
oil prices, Nigeria was facing balance of payment difficulties, increasing deficits and debt
burden, and high inflation rates (Bolanle 1999, Ikelegbe 2001). In addition, old patronage
politics were collapsing partly because of the cut in external support after the end of the
Cold War (Reno 1998). Due to the diversion of large shares of the oil revenue to the pockets
of the political elite, the popularity of the regime was particularly low among the Ogoni, an
ethnic group located in the oil-rich southeastern region.
Abacha’s government heavily depended on oil revenue and could not afford to give in
to the pressing requests of the Ogoni. Instead, the president dealt with the hostility by
destabilizing the Ogoni region through the use of state violence in the form of killings, rapes,
and looting by the security forces, and with deliberate attempts to foster conflicts between
the Ogoni and their neighboring ethnic groups (Reno 1998). Indeed, the regime constantly
tagged as ethnic rivalries attacks that independent observers attributed to the regular army
(Ibeanu 2000, Human Right Watch 1995, Reno 1998). For instance, when four traditional
chiefs were killed during an Ogoni rally in 1995, Abacha blamed local Ogoni activists for the
killings and sentenced them to death (Ifeka 2000, Ikelegbe 2001). The evidence that emerged
afterwards, however, suggests that Abacha’s regime was behind the murders (Reno 1998).
that point, the implosion of MOSOP [Movement for the Salvation of Ogoni People] was
completed and the struggle became Ogoni against Ogoni”.
A similar strategy was adopted to instigate violence between Nembe and Kalabari ethnic
groups. According to witness reports, regular army soldiers killed fourteen Nembe, whereas
officials claimed it was part of a Kalabari plot to appropriate Nembe’s land. According to
Reno:
The militarization of local factions is an effective way to ensure that communities
in oil-producing areas cannot unify to challenge the regime. This tactic effectively
destroys civil society, replacing it with sets of rival ethnic organizations [...] (Reno
1998, p. 206).
This strategy enabled Abacha to contain successfully the outbreak of rebellion. His
five-year rule over Nigeria was primarily used for his own benefit and in favor of his associates,
despite his relative weakness and the unfavorable economic conditions (Bolanle 1999). After
Abacha’s death on June 7 1998, his family members were forced to give up thirty-seven
residences and $750 million. It has been estimated, however, that before his death Abacha
managed to secure about $5-7 billion abroad (Reno 1999).
2.2
Kenya
Kenya has experienced repeated episodes of ethnic violence over the last 20 years. The
ethnic legacy passed from the British colonialists to Jomo Kenyatta in 1964 is one of deep
antagonisms, reflecting the divide-and-rule policy pursued during the colonial years. Both
Kenyatta, an ethnic Kikuyu, and his successor Daniel arap Moi, an ethnic Kalenjin,
im-plemented redistribution policies favoring their ethnic group, thus further nourishing the
pre-existing ethnic tensions (Burgess et al. 2011). On the eve of the 1991 elections, as well
as in the aftermath of both the 1991 and the 2007 elections, the country experienced severe
in-ternally displaced people. Most analysts converge on blaming the resource-greedy elites for
having engineered these violent events to serve their personal interests (Kahl 2006, Kagwanja
2009, and Rutten and Owuor 2009).
The 1991-1993 events are particularly telling. The intensification of pro-multiparty voices
compelled president Moi to repeal in 1991Section 2A, a constitutional amendment that made
Kenya a single-party state. The response of the ruling elite was immediate and came in the
form of a series of political rallies (known as the Majimbo rallies) organized by the Kenya
African National Union’s (KANU) across all the country. The speeches of officials during
these meetings conveyed particularly violent messages of hatred and intolerance towards the
Kikuyu and Luo ethnic groups. The elites accused them of stealing the ancestral lands of the
Kalenjin and the Maasai (Africa Watch 1993, Kahl 2006: 143). KANU officials radicalized
local populations by explicitly demanding land evictions by violent means, while emphasizing
that the bravery of Kalenjin and Maasai “warriors” would not tolerate the usurpation (Africa
Watch 1993: 12-18, Klopp 2001).
As a result of the ethnic confrontation over 1500 were killed and over 300,000 were
forcibly displaced over the 1991-1993 period (Africa Watch 1993, Kahl 2006). While the
authorities emphasized their inability to cope with the situation because of lack of resources,
posterior court testimonies revealed the active role of highly ranked KANU figures in the
organization of death squads recruited from the cities’ slums (Kagwanja 2009). In addition,
many argue that the length of the confrontation and the idleness of security forces reveal the
unwillingness of the ruling party to deter the ethnic conflict, irrespective of the ethnicity of
the victims (Kahl 2006).
That the conflict appears to have been orchestrated by a weakened central regime that
exploited existing enmities, inequalities and grievances between the country’s various ethnic
groups has been emphasized by various scholars.4 This strategy was crafted at the end of the Cold War era, when the power of the ruling elite was significantly reduced and political
4
opposition from other parties became a real threat. In this context ethnic clashes eventually
allowed the ruling elite to retain power and pursue their extractive policies.
These stories motivate the argument that we now formalize in the next section.
Sub-sequently, however, we show that the scope of our argument goes beyond the case studies
emphasized here, by highlighting robust longitudinal empirical patterns that support the
predictions of our theory.
3
The Model
3.1
Set up
We consider a country populated by two equally-sized ethnic groups respectively designated
by A and B, and a ruler L. Each group i is composed of n agents who control the natural
resources located on their own territory. Thus group iowns a shareϕi of the country’s total
resources R, with ϕA +ϕB = 1. Each ethnic group decides on the manpower to allocate
to productive, wi, and fighting, fi, activities. The production technology is assumed to be
linear and hence the total income of group i equals ϕiR +wi. The ruler can tax all the
nation’s income by applying group-specific taxes, τA and τB.5
If group i decides to allocate manpower to fighting, fi > 0, this force may serve two
purposes: On the one hand this militia can be used to loot the resources of the other ethnic
group, in which case we have a conflict. On the other hand it may serve to mount a rebellion
against the ruler so that the group can avoid paying taxes. If a rebellion occurs, the ruler’s
army fights the rebels and no taxes are collected if the rebellion succeeds. The ruler controls
an army of force a, and decides how to divide it between protecting himself from a potential
rebellion, aL, and deterring potential inter-group conflicts from arising, aD.
5
Given the above description of the agents’ actions, we now turn to the associated payoffs.
In the absence of acivil war (superscript C) and of a rebellion (superscript R), the country
is at peace (superscript P), and ethnic group i’s payoff is given by its after tax income:
UiP = (1−τi) (ϕiR+wi) (1)
Meanwhile the tax proceeds are entirely consumed by the ruler whose utility therefore is:
ULP =X i
τi(ϕiR+wi) (2)
If in the absence of civil conflict group i decides to mount a rebellion (superscript P R),
its payoff equals:
UiP R = fi
aL+fi
(ϕiR+wi) (3)
where fi
aL+fi is a simple ratio-form contest success function that constitutes the probability
that groupi’s rebellion is successful, and hence it can stop paying taxes. Similarly, the ruler’s
utility becomes:
ULP R = aL
aL+fi
ϕiR+τ−i(ϕ−iR+w−i)
(4)
where aL
aL+fi is the probability that the rebellion is unsuccessful in which case the ruler
appropriates all the rebelling group’s natural resources, and enjoys the revenues from taxing
the other group.
When group i initiates a conflict over the control of group j’s natural resources (a civil
war), but refrains from rebelling against the ruler, it obtains:6
UiC = (1−τi)
fi
aD+fi+f−i
(R+wi) (5)
where the contest success function features the ruler’s effort to deter inter-groups’ conflict,
6
aD, a share of the army which we assume is deployed to help the targeted group. Equation
(5) also assumes that only natural resources and not the production of the rival ethnic are
appropriated through conflict. In case of defeat, however, an ethnic group is not able to
carry on production successfully.
The attacked group’s payoff is then given by:
U−Ci = (1−τ−i)
aD+f−i
aD +fi+f−i
(R+w−i) (6)
The ruler’s payoff takes into account that, absent rebellion, taxes on both groups can
still be levied. Hence:
ULC =τi
fi
aD +fi+f−i
(R+wi) +τ−i
f−i+aD
aD+fi+f−i
(R+w−i) (7)
Lastly, when there is both civil war and rebellion (superscriptCR), the rebelling group’s
payoff is:
UiCR = fi
a+fi+f−i
(R+wi) (8)
In such event, the ruler backs the non-rebelling group, which he keeps taxing. His utility
is therefore:
ULCR =τ−i
a+f−i
a+fi+f−i
(R+w−i) (9)
3.1.1 Timing
The timing of the game is as follows:
1. The ruler decides the pair τ = {τA, τB}, and the allocation of the army between
protecting himself aL from rebellion, and deterring civil conflicts aD.
either group initiates hostilities, civil war ensues.
3. Each ethnic group individually decides whether or not to mount a rebellion against
the ruler.
We solve the model backwardly by looking at Subgame Perfect Equilibria.
3.2
Analysis
Stage 3:
The optimal response of groupiat stage 3 depends on the outcome of stage 2, i.e. whether
the country experiences civil war not.
i) Suppose the outcome of stage 2 is not civil war.
Group i should decide whether or not to rebel. If it rebels it then optimally allocates
its n individuals between production activity and rebellion. The maximization problem of
group i is therefore:
max fi
fi
aL+fi
(ϕiR+n−fi)
(10)
Subject to the manpower constraint: ni =fi +wi.
The optimization yields the following interior solution:
fiP R = (aL(aL+n+ϕiR))1/2−aL (11)
Replacing this value in (3) gives:
UiP R =h(aL+n+ϕiR)1/2−a1L/2
i2
(12)
On the other hand, if the the group does not rebel, it allocates all the manpower to the
UiP = (1−τi) (ϕiR+n) (13)
The group thus decides to mount a revolution if UP R
i > UiP. Rearranging this inequality allows us to identify the tax rate, τP
i , above which group i would opt for rebellion:
τiP = 1− h
(aL+n+ϕiR)1/2−a1L/2
i2
ϕiR+n
(14)
ii) Suppose the outcome of stage 2 is civil war.
Denote by fC
i the number of fighters allocated by group i to the inter-group conflict in stage 2. In stage 3, if group i decides to rebel, it adjusts the number of fighters to optimize
the following problem:
max fi
fi
a+fC
−i+fi
(R+n−fi)
(15)
Starting a rebellion would mean facing the entire army (both the share deployed to guard
peace and the share protecting the ruler) as well as the other group’s army. On the other
hand, no taxes are paid to the ruler in case of a successful rebellion.
The interior solution to this problem is given by:
fiCR = a+f−Ci
a+f−Ci+n+R
1/2
− a+f−Ci
(16)
Thus implying that group i’s utility of rebelling [by replacing (16) in (8)] equals:
UiCR =h a+f−Ci+n+R
1/2
− a+f−Ci
1/2i2
(17)
On the other hand, not rebelling implies that group i gets taxed at some group specific
rate τC
i where superscriptC designates the fact that the two groups are at conflict. Group
UiC = 1−τiC f
C i
aD+f−Ci+f
C i
R+n−fiC
(18)
where aD is the share of the army deployed by the ruler to guard peace in the country in
the first stage of the game. The comparison of equations (17) and (18) allows us to compute
the threshold tax rate τC
i above which group i would rebel. This yields:
τiC = 1−U
CR i
UC i
(19)
Stage 2:
Taking into account the optimal responses of stage 3, we now solve for the two groups’
optimal allocation of manpower between production and fighting in stage 2, where players
choose whether or not to initiate a civil conflict. From ethnic groupi’s perspective, provided
it is profitable to provoke a civil war, the problem consists on maximizing (5) with aD set
to zero since at equilibrium a ruler will never reduce his own defense by deploying part of
the army across the country if civil war can not be prevented.7 For interior solutions, the optimal strength to deploy in a civil war from i’s perspective (in expectation of a civil war)
can be shown to be:
fiC = n+R
3 (20)
The utility derived by group iif an ethnic conflict occurs and if no rebellion is mounted
is therefore given by:
UiC = (1−τiC)n+R
3 (21)
To determine whether a civil conflict occurs, it is necessary to derive the payoff an ethnic
7
group would obtain if it was to deviate from a peaceful situation. This in turn will allow us
to deduce whether any group has incentives to deviate from a peaceful equilibrium. In other
words, we need to determine the optimal size of a militia for groupi, when the other ethnic
group (−i) has allocated all its manpower to the productive activity, and given the forcesaD
deployed by the ruler to guard peace. From group i’s perspective, the problem consists in
maximizing (5) for f−i = 0. The utility obtained by groupi if it was to deviate from peace
equals:
UiC = (1−τi)
h
(aD +n+R)1/2−a1D/2
i2
(22)
Stage 1:
Since we have derived the ethnic groups’ best responses to the ruler’s tax rates and
optimal army deployment, we can solve the game’s first stage. In order to reap the maximal
wealth from its citizens, the ruler uses two tools: the tax rates and the army deployment.
Let us first consider the latter tool. The ruler decides the amount of troops aD that will
be deployed across the country to deter the ethnic groups from clashing each other. For
deterrence to be successful, it is necessary that both ethnic groups are unwilling to initiate
hostilities given that the other group is unprepared for fighting. Since both groups are
endowed with the same fighting technology and face the same opportunity cost of mobilizing
fighters, the ethnic group whose resources endowment is the lowest has the highest incentives
to start a conflict. Without any loss of generality assume ϕA > 1/2. If the deterrent force
is to be effective, therefore, the following condition should be satisfied: UC
B ≤ UBP. Using equations (13) and (22) for groupB, we can easily determine the minimal amount of troops
the ruler needs to deploy for the deterrent strategy to be effective, ¯aD:
¯
aD =
(ϕAR)2 4 (n+ϕBR)
(23)
deploying part of the army across the country instead of using it to protect themselves
would be suboptimal. Indeed, the lower the protection of the ruler, the easier it is to mount
a coup, which eventually translates into a lower optimal tax rate. Similarly, any aD > ¯aD
would unnecessarily reduce the ruler’s defense. We thus conclude that aD = {0,¯aD}. In
other words, the ruler will either just deter a conflict from occurring or abstain entirely from
any deterrent activities.
The optimal vector of taxes from the ruler’s perspective is such that he extracts the
maximum wealth from the two groups without causing a rebellion.8 In other words, the ruler will set the taxes such that the subjects are exactly indifferent between rebelling and
not. Therefore, if the ruler deploys the deterrent contingent ¯aD, the optimal tax rate is given
by (14), whereas if civil conflict is anticipated, the optimal tax rate is given by (19).
Our discussion around the optimal level of aD yields a first result.9
Proposition 1. Civil conflicts always occur if the ruler is too weak.
Proof. A ruler with an army of size a < ¯aD cannot deter a civil war. Indeed, attacking the
other group when aD <¯aD always yields a larger payoff to A than under peace. The claim
in Proposition 1 follows directly.
The utility of a ruler with an army a≥a¯D who chooses to deter civil conflict is given by
(2), which after substituting for the optimal tax rates yields:10
ULP = 2n+R− X
i=A,B
h
((a−¯aD) +n+ϕiR)1/2 −(a−a¯D)1/2
i2
(24)
If the ruler, however, does not deploy a deterrent contingent, the ethnic groups always
deviate from the peaceful situation. Thus, whenever aD = 0, a civil conflict will occur.
8
It can be shown that there always exists a tax vector for which the utility of the ruler is higher than under rebellion.
9
Throughout the paper the results presented in the propositions hold for the entire range of admissible parameters’ values. Both interior and corner solutions are formally dealt with in the Appendix.
10
Notice thatUP
The utility of the ruler is then given by equation (7) after replacing fC
A and fBC by their equilibrium value (20), and after setting the tax rates to their optimal (conflict) value τC
i . This yields:
ULC = 2 3
n+R−h(4 (n+R) + 3a)1/2−(n+R+ 3a)1/2i2
(25)
The ruler therefore decides whether or not to deploy the deterrent forces by comparing
(24) to (25). On the one hand, averting a civil conflict grants the ruler the largest tax base.
Indeed, when the ethnic groups enter into an armed struggle, potentially productive resources
are diverted to fighting activities. On the other hand, despite the partial reduction of the
ruler’s tax base, civil conflict reduces the contestants’ capacity of rebellion and strengthens
the defenses of the ruler, thereby increasing the tax rates the ruler can impose. In the context
of an on-going conflict between the ethnic groups, the group willing to mount a rebellion
will have to fight both the other ethnic group and the ruler’s army. We now turn to analyze
the trade-off between tax-base and tax rate when varying the model’s key parameters.
The following proposition describes how the ruler’s strength as measured by the size of
his army will influence the equilibrium:
Proposition 2. There exists a unique ruler’s strength level above which he preserves peace
and below which a civil conflict occurs.
Proof. A formal proof is provided in Appendix A.1.
Propositions 1 and 2 deserve a brief discussion. These results suggest that a country
ruled by a weak dictator is expected to experience internal conflicts. Indeed, very weak
dictators (a <¯aD) do not have the sufficient strength to deter the most motivated group in
the society from starting a conflict over natural resources. Interestingly, countries ruled by
relatively weak dictators (who nevertheless control an army a > a¯D) are also expected to
experience civil conflicts. Unlike in the previous case, this is the result of a rational calculus
he can impose larger tax rates. Refraining from deploying a peace-keeping force results in
a civil war which destroys part of the tax base. The gains from larger tax rates, however,
exceed the tax base loss.
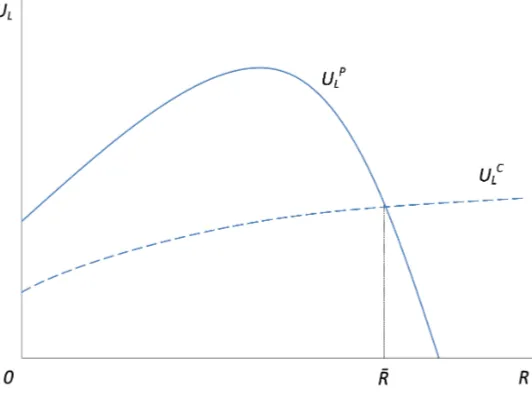
Figure 1 plots the outcome of a simulation exercise to help visualize the result of
Propo-sition 2. While the horizontal axis represents the strength of the ruler, the vertical axis
measures his utility. A ruler whose army is weaker than ¯aD is unable to deter a civil conflict.
As a consequence, for that range of a, only UC
L (dashed curve) is defined. For intermediate strength values (a∈[¯aD,˜a]), the burden of preserving peace exceeds the increase in tax base,
thus the ruler refrains from preventing civil conflict. Interestingly, fora >a¯D, increasing the
ruler’s strength reduces the gap in the tax rates under peace and conflict, while the gap in
tax bases remains constant. Indeed, the tax base loss under conflict is entirely determined
by the amount of resources (n andR) at stake, sinceaD = 0 (see equation 20). The waste of
resources under conflict eventually makes the peace-preserving strategy more profitable for
sufficiently strong rulers (a >˜a).
A consequence of this finding is that a negative shock on the personal power of a strong
autocratic rulercan be conducive to civil conflict, either because the ruler is no longer able to
support peace (if the shock affects the ruler strength such that his resulting army a < ¯aD),
or because it is no longer in his interest to do so.
Another parameter of interest in the analysis isR, the amount of natural resources. The
next proposition summarizes our findings on the effect of natural resources:
Proposition 3. There exists a unique stock level of natural resources below which the ruler
preserves peace, and above which civil conflict occurs.
Proof. A formal proof is provided in Appendix A.2.
Like in Proposition 2, the intuition behind this result lies in the effect of natural resources
on the ruler’s taxing ability under the two scenarios. Indeed, increasing the amount of natural
resources increases the tax base. Interestingly, the tax base increment under peace is larger
than under conflict as in the latter scenario more natural resources divert more labor from
production to fighting. On the other hand, however, increasing natural resources also inflates
the cost for the ruler to preserve peace in terms of soldiers to deploy (¯aD) to deter a civil
conflict. As a consequence, larger resource stocks reduce the forces dedicated to directly
protecting the central regime from a potential rebellion, thereby pushing downwards the tax
rate that can be imposed under the peace scenario. For large resource stocks this last force
prevails. Thus, for a sufficiently large amount of natural resources, the ruler should deploy
the entire army for deterrence to be successful. This, however, makes the ruler powerless
vis-a-vis the potentially rebellious ethnic groups. As a consequence the ruler’s payoff is nil.
When the presence of abundant resources makes the country very unstable, the ruler finds
it more profitable not to avert a civil conflict and to profit from it (by imposing larger tax
rates), instead of devoting a large share of his army to maintain peace.
It is worth stressing that the ruler’s decision depends on the amount of natural resources
relative to labor productivity. Throughout this paper we consider a unit marginal
produc-tivity of labor. Had we allowed for a more efficient production technology this would have
increased the threshold level of natural resources conducive to a conflict equilibrium without,
however, qualitatively modifying the findings.
In Figure 2 we present the results of a simulation that helps visualizing Proposition 3.
While the horizontal axis represents the level of natural resources in the country, the vertical
axis measures the utility of the ruler. The dashed curve describes the utility of the ruler
under conflict. Instead, the solid curve represents the utility of the ruler if he decided to
maintain peace in the country.
While UC
L is monotonically increasing in R, ULP experiences a decrease in R for large stocks of natural resources. Indeed, for large values ofRsecuring peace leaves the ruler with
relatively little forces to face a potential rebellion. As a consequence the effect of additional
eventually exactly offsets the increase in the tax base. This occurs for the level of resources
for which the solid curve reaches its maximum. For any larger stocks of natural resources,
the tax base expansion does not compensate for the reduction in the tax rates. The negative
slope of UP
L for large resource stocks in Figure 2 captures these dynamics. Eventually, for
R >R¯, the ruler is better off under civil conflict.
The last comparative statics exercise highlights the role of inequality, i.e. whether and
how the initial distribution of natural resources across the two ethnic groups influences the
ruler’s policy decisions. The next proposition addresses this issue.
Proposition 4. Higher inequality in initial resource endowments increases the occurrence
of civil conflicts.
Proof. A formal proof is provided in Appendix A.3.
The impact of inequality on the emergence of an internal conflict has been widely
inves-tigated in the literature.11 From our model we can show that a more unequal distribution of natural resources across groups in the society makes the deterrence strategy more costly
for the ruler because of the higher incentives for the society’s poorest group to violently
appropriate resources. As a consequence, when governing a society characterized by high
inequality in the distribution of resorces, a ruler finds it more profitable to have an inefficient
conflict over resources, and to exploit his subjects through higher tax rates.
We can now summarize the main findings of the model. We have shown that it may
be in the interest of an autocratic ruler to foster an inefficient internal conflict in a divided
society by foregoing the peace-keeping role of the army under his control. Such conflicts
imply a partial loss of the ruler’s tax base since otherwise productive labor gets diverted
towards fighting. By protecting himself with the entire army, on the other hand, the ruler
11
can impose higher tax rates which more than compensate the loss in terms of tax base.
Our comparative statics predict that internal conflict is more likely to be fostered: (i) by a
relatively weak ruler, (ii) in the presence of abundant natural resources, and (iii) in societies
where natural resources are distributed less equally.
The next section confronts these predictions to cross-country data on civil wars in recent
history.
4
Empirical evidence
We now test the main predictions of the model. We focus for our main empirical analysis on
Propositions 1 to 3, which describe the effect of ruler weakness (Propositions 1 and 2) and
the stock of natural resources (Proposition 3) on the probability that a civil conflict occurs
in an autocratic country that features an ethnic divide. Since we do not have good data
on the distribution of natural resources within countries, our test of Proposition 4 is only
suggestive and we leave it in the appendix (see section A.4).
Note that, taken together, Propositions 1 to 3 imply that civil conflicts (in ethnically
polarized, autocratic societies) occur if two conditions are met: the autocrat must be weak
enough, and there should be enough natural resources. We can test this empirically by
looking at the effect on the probability of civil war occurrence of the interaction between
natural resources and some proxy of the dictator’s weakness in the subsample of autocratic,
ethnically polarized countries. Such is the essence of our empirical strategy, which we explain
in detail after we describe the data.12
12
4.1
Data and sample
The dependent variable is a dummy that describes whether a civil conflict took place in
country i at year t. The source is the Uppsala/PRIO conflict dataset, available from the
Uppsala Conflict Data Program (Gleditsch et al. 2001).13
We use the Polity IV dataset (Marshall and Jaggers 2002), which assigns to each country
(each year) a score in the autocracy–democracy spectrum. Because our story is one of
the incentives of autocratic rulers, we keep only the subsample of countries closer to pure
autocracy using as threshold the median of the distribution of country-years in the regime
type spectrum. Our results are robust to variations in the arbitrary cutoff.
Similarly, and in line with our model which highlights that the perverse incentives of
the autocratic ruler occur in ethnically polarized societies, our sample of country-years gets
further reduced when we take the countries above the median of the ethnic polarization
index of Montalvo and Reynal-Querol (2005). Again, our results are robust to variations in
this cutoff.
Mainly because of the availability of income data for a large set of countries (source:
PWT 6.3, Heston et al. 2009), our sample covers the period 1960–2007.
Table 1 reports the summary statistics of the main set of variables used in the analysis.
We report the summary statistics for the entire sample of autocrats, that of ethnically
polarized autocracies, and also that of ethnically polarized autocracies that have an unequal
distribution of natural resources according to our proxy of resource distribution.14 In the sample of autocracies (top panel of Table 1) civil war occurs in 14.4% of the country-years.
The middle panel of Table 1 shows that the mean incidence of civil war is reduced slightly
13
While we use the benchmark 25 battle-deaths per year thresholds from Uppsala/PRIO to code the incidence of civil conflict, our results are robust to different thresholds.
14
(13.5%) when looking at the sample of ethnically polarized autocracies.15
Our proxy for the presence of natural resources is a time-varying dummy that equals
one if a country produces either oil or diamonds. We compute this using two recent and
comprehensive datasets that record longitudinal world-wide production of the two minerals
(oil: Lujala et al. 2007; diamonds: Gilmore et al. 2005). Roughly 41-42% of the observations
produce either or both minerals and this is true both for the sample of autocracies and for
that of ethnically polarized autocracies (Table 1).
We control in our regressions for the variables identified by the recent cross-country
literature as the most robust correlates of civil war (Collier and Hoeffler 2004 and Fearon
and Laitin 2003). These include population, which we also add as a scale control, per capita
GDP and its rate of growth, and the proportion of mountainous terrain which controls for the
geographic characteristics facilitating the mobilization of rebellious movements. In addition,
we control for how open countries are to international markets and add regional dummies.
The descriptive statistics of these variables are reported on Table 1.
4.2
Empirical strategy
Propositions 1/2 and Proposition 3 of our model imply that, within the sample of ethnically
polarized autocracies, civil conflicts are more likely to occur in places with natural resources
(which constitute an incentive to engage in war against other groups) and when the autocrat
is weak (which makes him less likely to devote soldiers to prevent inter-group fighting).
Our main empirical specification looks at these predictions jointly by looking at the
effect on the probability that civil war takes place in a given country at a given time, of
the interaction between the dummy for resource presence and our proxy for weakness of the
dictator.
For the latter we exploit the time variation provided by the end of the Cold War, an event
which has been widely identified as a negative shock to regimes that received aid from either
15
the US or the Eastern Bloc. Indeed, Reno (1997, 1998), and Ndulu and O′
Connell (1999)
document how the end of the Cold War came with the decline of interest for the African
continent. In addition, Boschini and Olofsgard (2007) estimate that the amount of foreign
aid from the West was systematically higher in periods of increased security concerns, as
measured by estimated military expenditures in the former Eastern Bloc, only during the
Cold War era. Similarly, Fleck and Kilby (2010) demonstrate that foreign aid has not
targeted the neediest countries during both the Cold War and the War on Terror (after
2001). Moreover Berthel´emy and Tichit (2004) emphasize that since the beginning of the
1990s, aid was directed according to economic criteria as opposed to global strategic reasons.
Thus, we estimate:
Yi,t =α+β1P ostColdW art+β2N atResi,t+γ(P ostColdW ar×N atRes)i,t+δXi,t+εi,t (26)
where Yi,t is a dummy that equals one if civil wars took place in country i at year t,
P ostColdW artis a time dummy that takes value one starting in 1990,N atResi,t is a dummy
that equals one if country i produces either oil or diamonds at time t, Xi,t is a vector of
time-varying controls, andεi,t is the error term.
The coefficient of interest is γ, which captures the effect on the incidence of civil war of
the interaction between the presence of natural resources and the weakness of the dictator.
4.3
Main results and robustness
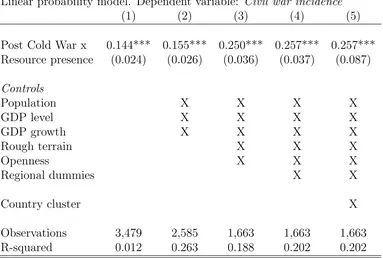
We estimate equation (26) with a linear probability model.16 Table 2 reports the benchmark results focusing on γ, the coefficient of interest.
The difference between columns 1 and 2 is that, while the former uses the entire sample
of autocracies, column 2 is closer to our model in the sense that it looks at the subsample
16
with higher values in the ethnic polarization index. Interestingly, the positive effect of the
interaction between the post Cold War dummy and the presence of natural resources on
the likelihood of civil war incidence is higher in the latter subsample, and we stick to it for
the remainder of the empirical analysis. According to the estimated coefficient of column 2,
which is significant at the 1% level, the probability that an ethnicaly polarized autocracy
experiences civil war increases by 8.8 percentage points when the autocrat is weak and the
country has natural resources.
Columns 3 to 6 illustrate the robustness of our result by additively including various
controls. We start with the variables identified in the cross country empirical literature as
the most robust correlates of civil war (column 3). These are population size, per capita
GDP (both of which we measure in logs) and the rate of growth of the economy.17 The size of the coefficient is virtually unchanged compared to the regressions without controls.
Column 4 adds two additional controls, also frequently significant in the empirical literature,
namely the roughness of the terrain (as measured by the proportion of mountainous terrain
from Fearon and Laitin’s dataset) and openness. The coefficient does not lose significance
but doubles in magnitude. Now the interaction of interest increases the probability of civil
war in 17 percentage points. This estimate remains very similar (16 percentage points) when
introducing regional dummies that capture continent-specific heterogeneity (column 5). The
last column of Table 2 shows that clustering the standard errors at the country level does
not kill the significance of the effect.18
17
The other variable robustly associated with civil war is the presence of natural resources, especially oil. This specific variable is part of our interaction of interest and we include the non interacted version of it [recall equation (26)].
18
4.4
Additional robustness checks
The empirical association reported on Table 2 between the incidence of civil war and the
interaction of natural resources with the weakness of the ruler is very supportive of our theory.
We have shown that this association is robust to controlling for the relevant correlates of civil
war identified in the cross-country empirical literature and that it survives the inclusion of
continent dummies and even a stringent correction of the standard errors (when we cluster
them at the country level). We now look at the robustness of this association to additional
tests and alternative measures of our independent variables of interest.
Table 3 presents the additional robustness checks. The first two columns include,
ad-ditively, country and year fixed-effects. This controls for country specific time-invariant
heterogeneity, as well as for time shocks that are common across countries. That is, we
estimate the following variant of the model described in (26):
Yi,t =αi+λt+b2N atResi,t+g(P ostColdW ar×N atRes)i,t+δXi,t+ǫi,t
where, in addition to the terms already defined, αi andλt are respectively country and year
fixed effects.19
The coefficient on our interaction of interest (in this case g) remains positive and
signif-icant.
Our main proxy for the weakness of the autocrat is a dummy for the post Cold War
period. One limitation of this variable is that it presents no time variation across units
or in terms of intensity. As shown respectively in columns 3 and 4 of Table 3, our results
are robust to using two other proxies of weakness. Borrowed from the dataset constructed
by Humphreys (2005), we look at the interaction of the presence of natural resources with
a measure of regime instability as well as a measure of regime strength, both country and
time-varying. Results are still consistent with our theoretical predictions: the interaction
19
Note that the variableP ostColdW aris not included in its non interacted version. This is because it is
between natural resources and regime stability is positive and significant and, conversely,
that between natural resources and regime strength is negative and significant. While this
robustness is reassuring, our preferred proxy is the dummy for the post Cold War period
because the Humphreys variables are not available for the whole sample and they may also
have endogeneity problems that are less likely to be present when using the dummy.
Finally, the last two columns disaggregate our benchmark measure of natural resources’
presence (a dummy that equals one if a country produces either oil or diamonds in a given
year) into two: a dummy for production of oil only (column 5) and one for the production
of diamonds. The estimated coefficient is significant in both cases which suggests that the
results are not driven by having the two commodities simultaneously.20
Overall, we find a strong support in the data for our political economy story of the
perverse incentives of autocrats to profit from ethnic strife in weakly institutionalized and
ethnically polarized societies.
5
Conclusions
The observation that some weak autocrats ruling over ethnically divided societies seem
to have avoided intervening to control the escalation of violent conflict in their countries
(if not favored such escalation altogether) is puzzling and, to the best of our knowledge,
no explanation has been offered in the social science literature. We propose a theoretical
framework that, by emphasizing the private incentives of autocrats in natural resource-rich,
ethnically divided societies, provides a rational explanation to such behavior. In our model, a
rent maximizer dictator sets taxes on production and natural resources and allocates military
effort both to protect himself from a potential rebellion and to deter the occurrence of civil
conflict among the ethnic groups. The occurrence of civil conflict undermines the tax base by
disrupting production but also lowers the probability that a group revolts, hence empowering
20
the ruler to set higher tax rates. We then show that weaker rulers (in the sense that are
less able to defend their regime) profit from the incidence of civil strife. When the primary
source of revenue comes from taxing natural resources the disruption that conflict has on the
production economy is lower. Thus a second prediction of our model is that the autocrat’s
gains from internal conflict are proportional to the country’s endowment of natural resources.
Moreover, we also show that the civil war dividend for the ruler is increasing in the inequality
of resource ownership across ethnic groups. This is explained by the predatory incentives of
the disadvantaged group toward the confiscating the assets of the other vis `a vis engaging
in a coup attempt.
But in the paper we go beyond the model and back its predictions with empirical evidence.
In line with the model’s setting, we look at the subsample of ethnically polarized, autocratic
countries over the period 1960-2007. Our dependent variable is the incidence of civil war
and our coefficient of interest is the interaction between a dummy for the presence of natural
resources and a dummy for the post Cold War period. The latter is our benchmark proxy for
the weakness of the autocrat since it identifies a period when most dictatorial regimes lost
both geo-strategic importance and access to financial resources. The coefficient associated
with the interaction, which supports our main theoretical predictions, is positive, significant,
and robust to a variety of controls and the inclusion of country and time-fixed effects: The
incidence of internal strife is higher in ethnically polarized countries ruled by weak dictators
and rich in natural resources. We also find suggestive evidence that this effect is bigger in
places with worse distribution of natural resources.
Our paper contributes to the recent political economy literature on the incentives of
autocratic leaders in ethnically polarized and weakly institutionalized societies. By
suggest-ing a driver of civil war that had not previously been emphasized in the literature, we call
attention to a seemingly unintended consequence of international efforts for weakening the
leaders of autocratic regimes. This suggests that embargos and other measures that aim at
against alternative policies when rulers have incentives to hold on to power by any means,
References
Acemoglu, D., G. Egorov, and K. Sonin (2008): “Coalition Formation in Non-Democracies,”Review of Economic Studies, 75, 987–1009.
Acemoglu, D., J. Robinson, and T. Verdier (2004): “Alfred Marshall Lecture. Klep-tocracy and Divide-and-Rule: A Model of Personal Rule,” Journal of the European Eco-nomic Association, 2, 162–192.
Africa Watch (1993): Divide and Rule: State-Sponsored Ethnic Violence in Kenya. Hu-man Rights Watch.
Angrist, J., and J.-S. Pischke(2008): Mostly Harmless Econometrics: An Empiricist’s Companion. Princeton University Press.
Bates, R. (1981): Markets and States in Tropical Africa. University of California Press.
Bolanle, A. (1999): “Conflict and Divergence: Government and Society in Nigeria,”
African Studies Review, 42 (3), 1–20.
Boschini, A., and A. Olofsgard (2007): “Foreign Aid: An Instrument for Fighting Communism?,” Journal of Development Studies, 43 (4), 622–648.
Burgess, R., R. Jedwab, E. Miguel, and A. Morjaria (2011): “Ethnicity Meets Politics: Road Building in Kenya 1963-2011,”mimeo.
Caselli, F., and W. J. Coleman II (2006): “On the Theory of Ethnic Conflict,” NBER Working Paper 12125.
Collier, P., and A. Hoeffler (1998): “On Economic Causes of Civil War,” Oxford Economic Papers, 50, 563–573.
(2004): “Greed and Grievance in Civil War,” Oxford Economic Papers, 56 (4), 563–96.
De Luca, G., and P. G. Sekeris(2011): “Land Inequality and Conflict Intensity,”Public Choice, forthcoming.
Egorov, G., and K. Sonin (2009): “Dictators and their Viziers: Endogenizing the Loyalty-Competence Trade-off,” Journal of the European Economic Association, forth-coming.
Esteban, J., M. Morelli, and D. Rohner (2010): “Strategic Mass Killings,” Institute for Empirical Research in Economics Working Paper Series, WP No. 486.
Esteban, J., and D. Ray (2008): “On the Salience of Ethnic Conflict,” American Eco-nomic Review, 98 (5), 2185–2202.
(2003): “Ethnicity, Insurgency, and Civil War,”American Political Science Review, 97, 75–90.
Fleck, R. K., and C. Kilby(2010): “Changing Aid Regimes? U.S. Foreign Aid from the Cold War to the War on Terror,”Journal of Development Economics, 91, 185–197.
Gandhi, J., and A. Przeworski(2006): “Cooperation, Cooptation, and Rebellion under Dictatorships,”Economics & Politics, 18 (1), 1–26.
Gilmore, E., N. P. Gleditsch, P. Lujala, andJ. K. Rod(2005): “Conflict Diamonds: a New Dataset,” Conflict Management and Peace Science, 22 (3), 257–292.
Glaeser, E. L. (2005): “The Political Economy of Hatred,” Quarterly Journal of Eco-nomics, 120 (1), 45–86.
Gleditsch, N.-P., P. Wallensteen, M. Eriksson, M. Sollenberg, andH. Strand
(2002): “Armed Conflict, 1946-2001. A New Dataset,”Journal of Peace Research, 39 (5), 615–637.
Gurr, T. (1970): Why Men Rebel. Princeton University Press, Princeton.
Heston, A., R. Summers, and B. Aten (2009): Penn World Table, Center for Interna-tional Comparisons of Production, Income and Prices at the University of Pennsylvania version 6.3 edn.
Hidalgo, D., S. Naidu, S. Nichter, and N. Richardson (2010): “Occupational Choices: Economic Determinants of Land Invasions,” Review of Economics and Statis-tics, 92 (3), 505–523.
Hodler, R. (2006): “The curse of natural resources in fractionalized countries,”European Economic Review, 50, 1367–1386.
HRW (1995): “The Ogoni Crisis: A Case-study of Military Repression in Southeastern Nigeria,”Human Rights Watch/Africa, 7 (5).
Humphreys, M. (2005): “Natural Resources, Conflict, and Conflict Resolution,” Journal of Conflict Resolution, 49 (4), 508–537.
Ibeanu, O.(2000): “Oiling the Friction: Environmental Conflict Management in the Niger Delta, Nigeria,” Environmental Change and Security Project Report, 6, 19–32.
Ifeka, C.(2000): “Conflict, complicity and confusion: unravelling empowerment struggles in Nigeria after the Return to ‘Democracy’,” Review of African Political Economy, 27 (83), 115–123.
Jackson, R., and C. Rosberg(1984): “Personal Rule: Theory and Practice in Africa,”
Comparative Politics, 16 (4), 421–442.
Kagwanja, P. (2009): “Courting Genocide: Populism, Ethno-nationalism and the In-formalisation of Violence in Kenya’s 2008 post-election crisis,” Journal of Contemporary African Studies, 27 (3), 365–287.
Kahl, C. H. (2006): States, Scarcity, and Civil Strife in the Developing World. Princeton University Press.
Klopp, J. M. (2001): “‘Ethnic Clashes’ and Winning Elections: the Case of Kenya’s Electoral Despotism,” Canadian Journal of African Studies, 35 (3), 473 – 517.
Lujala, P., J. K. Rod, and N. Thieme (2007): “Fighting over Oil: Introducing A New Dataset,”Conflict Management and Peace Science, 24 (3), 239–256.
Marshall, M. G., and K. Jaggers (2002): “Polity IV Project: Po-litical Regime Characteristics and Transitions, 1800-2002,” Version p4v2002e, http://www.cidcm.umd.edu/inscr/polity/index.htm.
Montalvo, J., and M. Reynol-Querol(2005): “Ethnic Polarization, Potential Conflict and Civil War,” American Economic Review, 95 (3), 796–816.
Murshed, M., and S. Gates (2005): “Spatial-Horizontal Inequality and the Maoist In-surgency in Nepal,” Review of Development Economics, 9 (1), 121–134.
Ndulu, B. J., and S. A. O’Connell (1999): “Governance and Growth in Sub-Saharan Africa,” Journal of Economic Perspectives, 13 (3), 41–66.
Olsson, O.(2007): “Conflict Diamonds,”Journal of Development Economics, 82 (2), 267– 286.
Padro i Miquel, G.(2007): “The Control of Politicians in Divided Societies: The Politics of Fear,”Review of Economic Studies, 74, 1259–1274.
Reno, W.(1997): “War, Markets, and the Reconfiguration of West Africa’s Weak States,”
Comparative Politics, 29 (4), 493–510.
(1998): Warlord Politics and African States. Lynne Rienner Publishers, London.
(1999): “Crisis and (No) Reform in Nigeria’s Politics,” African Studies Review, 42 (1), 105–124.
Reynol-Querol, M. (2002): “Ethnicity, Political Systems and Civil War,” Journal of Conflict Resolution, 46 (1), 29–54.
Rocco, L., and Z. Ballo (2008): “Provoking a Civil War,” Public Choice, 134, 347–366.
Rutten, M., and S. Owuor(2009): “Weapons of Mass Destruction: Land, Ethnicity and the 2007 Elections in Kenya,”Journal of Contemporary African Studies, 27 (3), 305 – 324.
Scott, J. (1976): The Moral Economy of the Peasant. Yale University Press, New Haven, CT.
Sekeris, P. G. (2011): “Endogenous Elites: Power Structure and Patron-Client Relation-ships,”Economics of Governance, 12, 237–258.
Snyder, J. (2000): From Voting to Violence: Democratization and Nationalist Conflict. The Norton Series in World Politics.
Snyder, J., and K. Ballentine (1996): “Nationalism and the Marketplace of Ideas,”
Table 1: Descriptive Statistics
Obs. Mean Std. Dev. Min. Max. Source
Sample of autocracies
Incidence of civil war 6,472 0.144 0.351 0 1 UCDP Log Population 6,472 7.926 2.150 2.249 14.095 PWT 6.3 Log Real GDP pc 5,220 8.365 1.180 5.733 11.624 PWT 6.3 GDP growth 5,124 2.269 8.249 -64.360 131.243 PWT 6.3 Log Mountainous terr. 4,696 2.053 1.453 0 4.557 F&L (2003) Log Openness 5,220 4.222 0.694 0.697 6.434 PWT 6.3
Dummy Prod. Nat. Res 6,472 0.416 0.493 0 1 Lujala et al. (2007)
Sample of ethnically polarized autocracies
Incidence of civil war 4,312 0.135 0.342 0 1 UCDP Log Population 4,312 7.815 2.150 2.249 14.095 PWT 6.3 Log Real GDP pc 3,225 8.425 1.161 5.743 11.624 PWT 6.3 GDP growth 3,162 2.356 8.891 -64.360 131.243 PWT 6.3 Log Mountainous terr. 3,064 2.249 1.415 0 4.557 F&L (2003) Log Openness 3,225 4.221 0.748 0.697 6.434 PWT 6.3 Dummy Prod. Nat. Res 4,312 0.414 0.493 0 1 CSCW/PRIO
Sample of ethnically polarized autocracies with unequal resource dist.
Incidence of civil war 3,479 0.101 0.301 0 1 UCDP Log Population 3,479 7.295 1.937 2.249 11.353 PWT 6.3 Log Real GDP pc 2,638 8.406 1.173 5.743 11.624 PWT 6.3 GDP growth 2,585 2.277 8.839 -46.877 131.243 PWT 6.3 Log Mountainous terr. 2,231 1.969 1.466 0 4.557 F&L (2003) Log Openness 2,638 4.296 0.719 0.697 6.434 PWT 6.3 Dummy Prod. Nat. Res 3,479 0.323 0.468 0 1 CSCW/PRIO
Table 2: Benchmark results
Linear probability model. Dependent variable: Civil war incidence
(1) (2) (3) (4) (5) (6)
Post Cold War x 0.069*** 0.088*** 0.082*** 0.171*** 0.164*** 0.164* Resource presence (0.019) (0.023) (0.026) (0.034) (0.033) (0.086)
Controls
Population X X X X
GDP level X X X X
GDP growth X X X X
Rough terrain X X X
Openness X X X
Regional dummies X X
Country cluster X
Observations 6,472 4,312 3,162 2,240 2,240 2,240 R-squared 0.019 0.019 0.146 0.124 0.160 0.160
Table 3: Additional robustness checks
Linear probability model. Dependent variable: Civil war incidence
Fixed effects Weakness measure Measure of N. Res.
Country fe Year fe Instability Strength Oil Diamonds
(1) (2) (3) (4) (5) (6)
Post Cold War x 0.113* 0.123* Resource presence (0.065) (0.066)
Instability x 0.140*
Resource presence (0.077)
Strength x -.131**
Resource presence (0.060)
Post Cold War x 0.051***
Oil presence (0.012)
Post Cold War x 0.150***
Diamonds presence (0.042)
Country fixed effects X X
Year fixed effects X
Observations 3,479 3,479 1,519 1,499 1,783 4,099 R-squared 0.024 0.047 0.040 0.043 0.013 0.006
Figure 1: The effect of the ruler’s strength.
[image:37.612.173.439.452.651.2]A
Appendix
A.1
Proof of Proposition 2
We need to prove the existence and uniqueness of an army size a such that UP
L < ULC,
∀a < a and UP
L > ULC, ∀a > a. In order to ease the exposition, it is useful to highlight some features that will be used throughout the proof. Notice that the groups’ militia reaction functions,fi(.), are monotonically increasing in the opponents’ strength. As a consequence, there always exists a level of a such that the optimal rebellion army equals n. Define by ˆ
a the ruler’s army size such that fP R
i = n, when ϕi = 1 (i.e. in the most unequal case). A second important feature directly linked to the previous point is that the utility of the ruler is the lowest whenϕi takes the extreme values of 0 or 1, thus implying that should our reasoning hold for ϕi = 1, it can always be reproduced for any ϕi.
Since the utilities UP
L and ULC behave differently for interior and corner solutions, we provide the proof for two subcases:
Case 1: R <2n which implies that at the conflict equilibrium, fC i < n
Case 2: R≥2n which implies that fC i =n
Case 1
The sketch of the proof is the following. We show that ∃a= ¯aD below which ULP is not defined, and at which UC
L(¯aD)> ULP(¯aD) = 0. We then show that both ULP andULC increase monotonically ina, withUP
L growing at a faster rate. Finally we show that∃a= ˆain which
UP
L(ˆa)> ULC(ˆa), thus implying that ULP and ULC cross only one time.
To prove the claim in the proposition it is sufficient to show the following conditions:
1. ∂UP
L/∂a > ∂ULC/∂a >0 2. UC
L = 0 for a = 0 3. UP
L = 0 for a = ¯aD 4. lima→∞ULC = 2
3(n+R) 5. UP
L (ˆa)≥lima→∞ULC
To verify whether condition 1 is satisfied we compute the two partial derivatives:
∂UP L
∂a =−4 +
(a−a¯D+n+ϕAR)1/2+ (a−a¯D+n+ϕBR)1/2
(a−¯aD)
−1/2
+(a−¯aD+n+ϕAR)
−1/2
+ (a−¯aD+n+ϕBR)
−1/2
(a−¯aD)1/2 (27)
∂UP L
∂a =−4 +
¯
XA1/2+ ¯XB1/2X
−1/2
+X¯A−1/2+ ¯XB−1/2X1/2 (28)
The partial derivative on UC
L is given by:
∂UC L
∂a =−4 + 2
(n+R+ 3a)1/2(4(n+R) + 3a)−1/2
+
2(n+R+ 3a)−1/2
(4(n+R) + 3a)1/2 (29)
Denoting (n+R+ 3a) by Y, and (4(n+R) + 3a) by ¯Y, this expression becomes:
∂UC L
∂a =−4 + 2
Y1/2Y¯−1/2
+Y−1/2¯
Y1/2
Notice that both derivatives contains terms with the same structure, which respect the following condition:
α β
1/2
+
β α
1/2
≥1 where α, β >0
This implies that both derivatives are weakly positive.
For (27) to be larger than (29), the following condition should hold:
¯
XA1/2 + ¯XB1/2X−1/2
+X¯−1/2
A + ¯X
−1/2
B
X1/2 >2Y1/2Y¯−1/2
+Y−1/2¯
Y1/2
which is true if the following two inequalities are satisfied:
(
¯
XA1/2X−1/2
+ ¯X−1/2
A X1/2 > Y1/2Y¯
−1/2
+Y−1/2¯
Y1/2 ¯
XB1/2X−1/2
+ ¯X−1/2
B X1/2 > Y1/2Y¯
−1/2
+Y−1/2¯
Y1/2 The first inequality is satisfied if:
X¯A−X
<
Y¯ −Y
Substituting the original values of ¯XA, X, ¯Y and Y, we obtain:
n+ϕAR <3(n+R)
which is always true. Similarly, the second inequality is satisfied if:
n+ϕBR <3(n+R)
which is always true. This establishes Condition 1. Condition 2 is verified by setting a= 0 in UC
L as given by (25). Similarly, condition 3 is verified by substituting a= ¯aD in (24).
tax base, which in the interior conflict equilibrium equals 2
3(n+R).
In order to tackle condition 5, we first compute ˆa. This value is found by setting the fighters’ best response when rebelling equaln. This level of a should then satisfy:
(ˆa−aD)1/2(ˆa−aD+n+R)1/2−(ˆa−aD) =n ⇔(ˆa−aD)(R−n) =n2
Using aD as given by (23) with ϕi = 1 yields:
ˆ
a= n
2
R−n + R2 4n
The utility of group i of rebelling under peace when constrained (a≥ˆa) is given by:
UiP R|a≥ˆa= n
n+a−¯aD
R (30)
Equating this expression to UP
i yields the ‘corner’ tax rate from which we can obtain the utility of the ruler in ˆa:
ULP(ˆa) = n+R− nR n+ Rn−2n
+τ−in= (2 +τ−i)n
Whereτ−inis the tax revenue collected on the non-rebelling group whose share of natural
resources is ϕ−i = 0.
It is straightforward to show that condition 5 holds for R <2n, and τ−i ≥0:
ULP = (2 +τ−i)n ≥
2
3(n+R) = lima→∞U
C L(a)
Case 2
It is useful to sketch the proof of this case as well. We first repeat the steps of the interior Case 1 (steps 1−3). We then verify that for values of a sufficiently large to induce all individuals in the rebelling group to specialize as fighters, fi =n, the utility of the ruler under peace grows at an even faster rate, thus implying that there is only one crossing between UP
L and ULC for the entire range of admissible values of a (condition 4).
To prove the claim in the proposition it is sufficient to show the following conditions:
1. ∂UP
L/∂a > ∂ULC/∂a 2. UC
L = 0 for a = 0
3. lima→∞ULC <lima→∞ULP
4. Denote by UPˆ
L the utility of the ruler under peace if the optimal rebellion for the wealthier group implies everybody rebelling. Then, ∂UPˆ
L/∂a > ∂ULP/∂a. Let us start by computing UC
L and ULP for R > 2n. Since for R ≥ 2n in the conflict scenario all agents are fighters, in case of rebellion and conflict all agents would be fighters as well (because fCR
i is increasing in the opponents’ strength). The equilibrium conflict tax rate and UC