STRUCTURAL ANALYSIS AND CONTROL OF VIBRATING HOPPERS FOR
HARVESTED GRAPES IN A WINE CELLAR: A CASE STUDY
PACS 43.40
V. Debut (1,2), O. In ´acio (1)
(1) InAcoustics Engenharia Ac ´ustica, Vibrac¸ ˜oes e Ambiente, Lda., R. Dr. Carlos Pires Felgueiras, 173 -6.o B, 4470-157 Maia, Portugal
(2) Instituto de Etnomusicologia, M ´usica e Danc¸a, Faculdade de Ci ˆencias Sociais e Humanas, Universidade Nova de Lisboa, 1069-061 Lisboa, Portugal
vincentdebut@ctn.ist.utl.pt, octavio.inacio@inacoustics.com
Abstract
Excessive vibrations in the work environment not only harm exposed workers but can also affect the integrity of building structures. This problem was detected in a wine cellar in Alij ´o, Portugal, where a concrete slab is driven to resonance by two vibrating hoppers. In order to address the problem, a strategy combining physical modelling techniques and in-situ vibratory measurements have been developed. The general objective was first to reproduce the qualitative trends observed and then to assess the effectiveness of the proposed solution. The strategy developed here allowed to study how to decrease the vibration amplitude without making structural modifications on the slab, nor serious changes to the vibrating equipment.
1
Introduction
The Gran Cruz Winery is an industrial unit dedicated to centralize the production, storage and treatment of wines from Douro and Porto, located in northwest Portugal in Alijo. The project has represented a significant investment in the wine industry by including state-of-the art architectural and technological solutions for the transformation of grapes to wine ready for the market. For the reception and distribution of the harvested grapes to other equipments, the installation is equipped with two large vibrating hoppers. However, their operation has rapidly induced excessive floor vibrations so that their practical use has been severely limited. Indeed, the vibration problem is particularly critical for the installation since both hoppers are mounted on a
flexible cantilevered concrete platform, with area of 150 m2and 30 cm thick, at 8 metre above groundfloor.
The equipment has therefore been operated under sub-optimal conditions and until recently, an empirical but safe solution has consisted in changing the supply frequency of the electric motovibrators of the hopper in order to operate in a frequency range higher than the natural frequencies of the platform, thus decoupling the excitation from the slab response. However, it has been inevitable for the winery to address the vibration issue for both economical and safety reasons, and the main objective of this work is to describe the general developed strategy for the design of a reliable and robust solution which has been implemented at Gran Cruz very recently.
for vibration control but no universal solution currently exist. Indeed, the solving-capabiblities of every technique remain strongly dependent on the specifities of the problem in view of the resonance frequencies, the type of excitation and the environmental condition. For instance, it is well known that resonance problems can be controled by tuned-mass dampers (TMD) but the use of such devices is ill-adapted to flexible systems displaying a large number of modes and operating under broadband excitation.
The large vibrating hoppers of the winery can operate at several discrete frequencies by controlling the rotational speed of the motors while the excitation amplitude can be regulated by acting on the relative position of two eccentric masses inserted in the motors. Preliminary vibrational data has revealed the occurence of large amplitude vibratory responses of the slab for several operating speeds, the slab being driven to resonance phenomenom in the frequency range from 7 to 20 Hz. Among the technically applicable solutions, one simple approach to the problem would consist in changing the excitation frequencies as initially proposed by the hopper manufacters, so that the operating frequencies does not overlap with the modal frequencies of the structure. Other possible approach could be to alter the modal behaviour of the structure by structural modifications [2]. However, as already mentioned, the first solution is not sustainable for the winery since the hoppers operate optimally for specific motor speed while architects would certainly not give their permission for significant changes in the design and spatial options of their original plans. Furthermore, altering the modes of such a large structure would remain very challenging. TMDs could also be an efficient solution if only a single mode of the slab would become unstable. However, since resonance occurs at different rotational speed of the motor, this would imply the design and delicate tuning of several TMDs. The implementation of active control solutions [3] could also be attempted to adjust the operation of the control device. They can actually better regulate the dynamics response of the system than passive solutions but it is worth pointing that the practical feasibility of this modern control approach, using control transducers and signal processing techniques, could be delicate in such operating environment besides its rather complexity and expensive cost. It finally remains one common solution to takle efficiently the problem: isolate the machinery from the fondation by elastic decoupling [4].
In the present paper, we present the overall strategy developed in this work for the design of a passive solution to mitigate the resonance problem and demonstrate the practicability and effectiveness of an air spring isolation system. The approach combined experimental and numerical modal analysis, physical modeling and optimization of the isolator characteristics in view of ensuring the correct elastic decoupling of the hoppers and the slab over the range of the motor excitation frequencies.
2
In-situ experiments
2.1
Vibratory reponses of the slab
A first serie of measurements was concerned with the assessment of the actual vibratory responses of the slab under forced excitation. Accelerometers were glued on the slab at several critical locations, close to the hoppers feet and near the slab corners. Measurements were performed by step-increasing the running speed of the motor and for simplicity, one hopper only was operating at a time. For each velocity, ten accelerations signals were averaged in the frequency domain and recorded on a Spectral Dynamics digital acquisition board (Model SigLab 20-42). Fig. 1 displays the measured acceleration power spectra for one hopper. Although the slab response remains rather small for low frequencies of excitation, there is a net increase of the slab vibratory reponse in the frequency range between 12 and 18 Hz. From the vibrational standpoint, this typically illustrates a resonance effect of the flexible slab which responds to the forcing of the motor according to its natural modes of vibration. Therefore the objective of this work is to address the resonance issue without making structural modifications on the slab, nor serious changes to the vibrating equipment.
2.2
Experimental modal analysis
5 10 15 20 25 30 10−6
10−5 10−4 10−3 10−2 10−1 100 101 102
PSD [ (m/s
2) 2 / Hz ]
5 10 15 20 25 30
10−6 10−5 10−4 10−3 10−2 10−1 100 101 102
PSD [ (m/s
[image:3.612.103.502.75.227.2]2) 2 / Hz ]
Figure 1: Power spectral density of the acceleration measured at the hopper foot (left) and slab corner (right) for the second equipment. Each color refers to one motor velocity.
0 5 10 15 20 25 30
10−6 10−5 10−4 10−3 10−2 10−1
Frequency [ Hz ]
abs ( H (f) )
Slab right corner Slab left corner Slab center
Hopper 1 foot 1 to slab right corner Hopper 1 foot 2 to slab right corner Hopper 2 foot 1 to slab left corner Hopper 2 foot 2 to slab left corner
Figure 2: Transfer functions obtained by impact testing.
Figure 3: First six modes of the isolated slab
computed by FEM. Dots refer as to the hopper contact points.
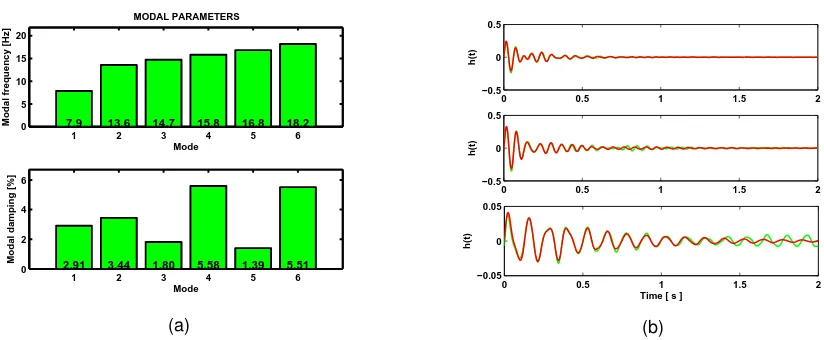
as well as other transfer functions performed between the hopper feet and slab. One accelerometer was used for measuring the concrete slab response while impact excitations were performed by using a large instrumented hammer to ensure a proper excitation of the low frequencies. The vibratory signals were recorded on the digital acquisition board and acquisitions were 3s-long. Fig. 2 displays the acquired transfer functions where several modes can be identified visually within the frequency range of the motor excitation. The slab modal frequencies and associated damping values have then been identified by implementing a sophisticated MDOF algorithm in the time-domain, the Eigensystem Realization Algorithm (ERA) which has been recognized as being very effective for the modal identification of complex systems [5, 6]. In essence, the algorithm is based on a state-space formulation of the system dynamics and attempts to identify a linear mathematical model to match the impulse responses of the structure, first by combining a set of free decay responses in the form of a generalized Hankel matrix and then, by using a singular value decomposition to estimate the minimum order of the mathematical model. The last step of the algorithm consists of computing the eigenvalues of the chosen minimum model from which the modal parameters of the system are extracted. Fig. 4 displays the identified modal parameters of the slab as well as a comparison between the measured and reconstructed impulse responses using the identified modal data to assess the successfull modal identification. Six modes have been identified in the frequency range 5 to 25 Hz, and two modes, slighlty damped, appear critical as they can easily contribute to the unsatisfactory operating performance.
[image:3.612.326.524.281.415.2] [image:3.612.87.277.283.432.2]1 2 3 4 5 6 0
5 10 15 20
7.9 13.6 14.7 15.8 16.8 18.2 MODAL PARAMETERS
Mode
Modal frequency [Hz]
1 2 3 4 5 6
0 2 4 6
2.91 3.44 1.80 5.58 1.39 5.51
Mode
Modal damping [%]
(a)
0 0.5 1 1.5 2
−0.5 0 0.5
h(t)
0 0.5 1 1.5 2
−0.5 0 0.5
h(t)
0 0.5 1 1.5 2
−0.05 0 0.05
Time [ s ]
h(t)
(b)
Figure 4: Modal identification results: (a) Identified modal parameters ; (b) Measured (green) and reconstructed (red) impulse responses.
parameters, namely the mode shapes and the associated modal mass. A Finite Element software was used to construct the FEM model of the isolated slab and carry out the numerical computation. For illustration, Fig. 3 presents the mode shapes of the first six modes stemming from FEM computations. As a result, the modal parameters identified by modal analysis could then be used to feed a physical model, described in the next section, for prediction analysis purpose.
3
Physical modelling of the hoppers/slab coupled system
3.1
Equations of the model
For a simple analysis, the vibrating hopper can be idealized by two rigid massesm1 andm2 connected by
an internal spring element, which responds to the external forcing provided by the motors. Its connection to the foundation which is provided by the vibration isolator to design, can be modelled by a elastic device with
stiffnessksand damping coefficientcsand which contacts locally to the slab. To account for the complex
[image:4.612.99.511.70.240.2]vibrational behaviour of the fondation, the slab can be viewed as a multi-modal flexible structure whose modal parameters stem from the modal analysis. For simplicity, the equipment is assumed to vibrate in the vertical direction which is actually the predominant direction of motion. Schematically, the system under study is depicted in Fig. 5.
Figure 5:Modelling of the coupled system: the two vibrating hoppers (blue), the two elastic vibration isolators
[image:4.612.192.423.532.686.2]In a modal framework, the dynamics of the sub-systems can be described by:
• For the upper mass of the hoppers, subjected to the forces induced by the internal mount and the
equipment motor excitation forcefi(t)acting on hopperi(i=1,2) :
m1X¨1(t) =−cvX˙1(t)−Y˙1(t)−kvX1(t)−Y1(t)+f1(t) (1a)
m1X¨2(t) =−cvX˙2(t)−Y˙2(t)−kvX2(t)−Y2(t)+f2(t) (1b)
• For the lower mass of the hoppers, subjected to the forces induced by the internal mount and the
relative machinery/foundation displacement:
m2Y¨1(t) =cv
˙
X1(t)−Y˙1(t)
+kv
X1(t)−Y1(t)
−cs
˙
Y1(t)−Z˙(xc1, t)
−ks
Y1(t)−Z(xc1, t)
(2a)
m2Y¨2(t) =cv
˙
X2(t)−Y˙2(t)
+kv
X2(t)−Y2(t)
−cs
˙
Y2(t)−Z˙(xc2, t)
−ks
Y2(t)−Z(xc2, t)
(2b)
wherexc1 andxc2 are the points where the hoppers contact the slab.
• For the flexible slab, excited by the forcef(x, y, t)provided by the isolators:
mnq¨n(t) +cnq˙n(t) +knqn(t) =
Z
S
f(x, y, t)φn(x, y)dS n= 1, . . . , M (3)
wheremn,kn andcnare the modal mass, stiffness and damping coefficient of moden, withφn(x, y)
the corresponding mode shapes andqn(t)its modal amplitude, and S the surface of the slab. The
external forcesf(x, y, t)come from the isolator spring and damping forces originated by the relative
machinery/foundation motions at contact pointsxc1andxc2. The associated modal forces are therefore
expressed by:
Z
S
f(x, y, t)φn(x, y)dS=f(xc1, yc1, t)φn(xc1, yc1) +f(xc2, yc2, t)φn(xc2, yc2) (4)
where
f(xci, yci, t) =−ks
h
Z(xci, yci, t)−Yi(t)
i
−cs
h ˙
Z(xci, yci, t)−Y˙i(t)
i
i= 1,2 (5)
withYi(t)andZ(xci, yci, t)the displacements of the lower mass of hopperiand the slab at the contact
point i respectively. The displacement of the slab in physical coordinates at location (x, y) can be
computed as:
Z(x, y, t) =
M
X
n=1
qn(t)φn(x, y) (6)
3.2
Dynamics of the coupled model
The dynamics of the coupled system can then be written into a compact matrix form consisting of (N =
Ns+ 4) modal equations:
m1 0 0 0 0
0 m2 0 0 0
0 0 m1 0 0
0 0 0 m2 0
0 0 0 0 M
¨ X1(t)
¨ Y1(t)
¨ X2(t)
¨ Y2(t)
¨ qS(t)
+
cv −cv 0 0 0
−cv cv+cs 0 0 D1
0 0 cv −cv 0
0 0 −cv cv+cs D2
0 D1 0 D2 C
˙ X1(t)
˙ Y1(t)
˙ X2(t)
˙ Y2(t)
˙ qS(t)
+
kv −kv 0 0 0
−kv kv+ks 0 0 E1
0 0 kv −kv 0
0 0 −kv kv+ks E2
0 E1 0 E2 K
X1(t)
Y1(t)
X2(t)
Y2(t)
qS(t)
=
f1(t)
0 f2(t)
whereD1,D2,E1andE2are coupling vectors for damping and stiffness effects given by:
D1=−[ksφ1(xc1, yc1), . . . , ksφM(xc1, yc1)], D2=−[ksφ1(xc2, yc2), . . . , ksφM(xc2, yc2)] (8a)
E1=−[ksφ1(xc1, yc1), . . . , ksφM(xc1, yc1)]
T, E
2=−[ksφ1(xc2, yc2), . . . , ksφM(xc2, yc2)]
T
(8b)
The matriceMis diagonal whileKandCare full matrices due to the hoppers/slab coupling which highlights
that all slab modes are coupled through the contact forces. They respectively take the form:
C=Cs+csΦ(xc1, yc1) +csΦ(xc2, yc2) (9a)
K=Ks+ksΦ(xc1, yc1) +ksΦ(xc2, yc2) (9b)
whereCsand Ks are the diagonal matrices for the modal parameters of the slab and Φ(xci, yci)are the
coupling matrices given by:
Φ=
φ1(xci, yci)φ1(xci, yci) φ2(xci, yci)φ1(xci, yci) . . . φM(xc, yc)φ1(xc, yc) ..
. ... ...
φ1(xci, yci)φM(xci, yci) φ2(xci, yci)φM(xci, yci) . . . φM(xci, yci)φM(xci, yci)
(10)
3.3
Modal behaviour of the physical model
It is well known that computations in the frequency domain can be insightful to study the effects of physical parameter changes on the dynamical behaviour of a mechanical system. Indeed, a simple comparison of the frequency response before and after the insertion of the vibrator isolator can provide a feel about the efficiency of the elastic decoupling. Also, parametric computations can be performed to study the changes in the modal frequencies and damping values as a function of the isolator’s mechanical characteristics. In a modal framework, this requires the knowledge of the modal parameters of the coupled system which are essential ingredients to build the system transfer function, in terms of acceleration response, according to:
H(r0,rr, ω) = N
X
n=1
−ω2ψ
n(r0)ψn(rr)
mn(ω2n−ω2+j2ωωnζn)
(11)
wherer0 andrrare the excitation and response locations respectively,ωn andζn the natural frequencies
and damping values of the system coupled modes andmnandψnthe corresponding modal mass and mode
shape. As classical in vibration analysis, one can assume harmonic solutions of the formw(t) =aejωntfor
free motion and then rewrite Eq. (7) in its first-order form to obtain a quadratic eigenvalue problem. The
eigenproblem is then easily solved by standard procedures, resulting in estimates ofωn andζn as well as
the eigenvectora. The mode shapes of the coupled systemψn(r)in physical space can then be computed
by modal recombination of the original sub-system mode shapes as:
ψn(r) =
M
X
j=1
ajφn(r)
[
4
X
j=1
ajφmn(r) (12)
whereφn(r)andφmn(xc) = 1are the modeshapes of the slab and the four rigid masses respectively. Once
the eigenvectors are known, the modal mass of the coupled system can be estimated by:
mn=diag(aTMa) (13)
where Mreferred as to the mass matrix of the coupled system of Eq.(7). Fig. 6 displays three transfer
functions computed in this way from the modal parameters obtained by modal analysis. As seen, the model reproduces the general trends of the modal measurements plotted in Fig.2 but no perfect matching between experimental and computed transfer functions have been achieved. There is several reasons to explain
these discrepancies. There are actually large uncertainties regarding the values of the masses m1 and
m2 of the upper and lower parts of the hopper as well as on the surface density of the concrete installed
0 5 10 15 20 25 30 10−6
10−5 10−4 10−3 10−2 10−1
Frequency [ Hz ]
abs ( H (f) )
DRIVING−POINT TRANSFER FUNCTION
[image:7.612.320.512.73.231.2]Right corner Left corner Middle
Figure 6: Slab driving-point transfer functions
computed by the physical model.
Figure 7: Optimal characteristics of the isolator stemming from the minimization of Eq.(14).
internal flexible mounts (modelEvidgom810784) separating the two parts of the hoppers. Some errors may
also have occured during the modal identification procedure since it still involves the user interaction for the determiniation of the order of the model. However, the model - even if not perfect - appears sufficient to investigate the attenuation provided by the vibration isolator as a function of its stiffness and damping properties.
4
Optimization of the isolator characteristics
The characteristics of the isolator have been sought by devising optimization strategies aiming at maximizing the effectiveness of the isolation between the hopper mass excited by the motor and the slab response at several critical locations. From the computations of the transfer functions with and without the isolator, given
by Eq.(11), we can define the following function errorε(ks, cs)to be minimized by the stiffness and damping
values of the isolator,ksandcsrespectively:
ε(ks, cs) =
3
X
j=1
max
ω1≤ω≤ω2
|Hˆ(xc1, xsj, ω, ks, cs)|
max
ω1≤ω≤ω2
|H(xc1, xsj, ω, ks, cs)| +
max
ω1≤ω≤ω2
|Hˆ(xc2, xsj, ω, ks, cs)|
max
ω1≤ω≤ω2
|H(xc2, xsj, ω, ks, cs)|
!
(14)
where Hˆ(xci, xsj, ω, ks, cs) and H(xci, xsj, ω, ks, cs) are the transfer functions for acceleration
response between hopper i and the slab location xj, with and without the vibration isolator
respectively, and ω1 and ω2 the lower and upper limits of the frequency range considered in the
optimization. As illustrated in Fig.7, minimization of this function is achieved using parameters
ks = 5.5×10⁴ N/m andcs = 20 Ns/m thus ensuring the optimal decoupling according to Eq.(14). As one
[image:7.612.80.275.74.232.2]degree of freedom and thus a new resonance to the dynamics of the coupled system. For the corresponding operating frequency, this can be particularly problematic during operation but fortunately, the model does not predict large difference in vibration amplitude for this running speed between the controlled and uncontrolled configuration.
0 5 10 15 20 25 30 35
−100 −80 −60 −40 −20
f [ Hz ]
[image:8.612.173.424.142.336.2]H( f ) [ dB ]
Figure 8: Computed transfer functions before (dash) and after (solid) the insertion of the isolator with characteristics defined by the minimization of Eq.(14). Excitation is on the upper mass of one hopper while response is given for three critical locations on the slab. Legend is the same as in Fig. 6. The vertical gray lines bound the frequency range considered in the optimization procedure.
5
Practical implementation and conclusions
Bridging the gap between the theoretical characteristics and the available commercial solutions is usually a delicate task even if manufacturer catalogues provide a large variety and type of solutions. If steel-spring axial isolator appears as a rugged and reliable solution for the practical realisation, the major difficulty here comes from the low stiffness value of the isolator to design which inevitably leads to very large static deflection for conventional springs. Other limitation is concerned with their height-to-width ratio which affects their axial stability, especially for such low frequencies. One commercial solution which can approach the requirements is air spring systems which have successfully solved vibration problems in many applications, including on vehicular suspensions. Air springs provide low frequency and zero-static deflection and can ensure constant operating frequency, even under varying load, by simple adjustment of the height of the mount through air supply control. We decided to implement a solution based on four air spring systems
(see Fig. 9) capable of 2 Hz natural frequency (CDM AIR Cushion 6”×2), uniformly positioned within the
equipment for dividing the load among the isolator and attached through some intermediate frame (see Fig. 10). Double convolution bellows have been preferred to gain axial stability and external mechanical stops, mounted in compression against the equipment, have been designed to increase the low damping of the mounts through friction and also reduce lateral displacements. Finally, soft elastic layers have been inserted between the isolator end retainer and the slab to decouple them on the whole surface of contact.
Figure 9: Example of CDM air cushion mounted on the equipment.
Figure 10: Anti-vibration solutions installed at Gran Cruz Winery.
Uncontrolled Controlled
velocity 4 114 dB 86 dB
velocity 10 101 dB 82 dB
(a) Left slab corner
Uncontrolled Controlled
velocity 4 115 dB 78 dB
velocity 10 114 dB 82 dB
(b) Right slab corner
Table 1: Mean acceleration (dB ref. 1e-6 m/s2) measured at two locations on the slab with one hopper
operating for two critical running speeds. Results before and after the implementation of the solution.
Acknowledgments
The authors thank Dr. Jos ´e Antunes, head of the Applied Dynamics Laboratory (IST/C2TN), for his valuable contribution to the experimental work and helpful discussions regarding modeling aspects. We are also greatly thankful to Andr ´e Prata, Andr ´e McDade and Filipe Martins from InAcoustics, and the collaborators
of Gran Cruz for their cooperation during the measurements and practical realisation. Vincent Debut
also aknowledges support from the Fundac¸ ˜ao para a Ci ˆencia e Tecnologia (FCT) under grant research FCSH/INET-md/UID/EAT/00472/2013.
References
[1] C. M. Harris, C. E. Crede. “Shock and Vibration Handbook”, McGraw-Hill, New-York, USA, 1976.
[2] J. He. “Structural modification”.Philosophical Transactions of the Royal Society, vol.A-359, pp.187-204,
2001.
[3] C.R. Fuller, S.J. Elliot and P.A Nelson, “Active control of vibration”, Academic Press Inc., San Diego, 1996.
[4] M. Moser, “Engineering Acoustics: an introduction to noise control”, Springer, Berlin, 2004.
[5] J. Juang, “Applied System Identification”, PTR Prentice-Hall, Inc., New Jersey, 1994.
[6] V. Debut, M. Cavalho and J. Antunes, “An objective approach for assessing the tuning properties of
[image:9.612.317.547.77.221.2]