Analytica Chimica Acta 638 (2009) 126–132
Contents lists available atScienceDirect
Analytica Chimica Acta
j o u r n a l h o m e p a g e :w w w . e l s e v i e r . c o m / l o c a t e / a c a
Evaluation of the odd–even effect in limits of detection for electron microprobe
analysis of natural minerals
Surendra P. Verma
a,∗, Kailasa Pandarinath
a, Fernando Velasco-Tapia
b, Rodolfo Rodríguez-Ríos
caDepartamento de Sistemas Energéticos, Centro de Investigación en Energía, Universidad Nacional Autónoma de México, Priv. Xochicalco s/no.,
Col Centro, A.P. 34, Temixco, Mor. 62580, Mexico
bFacultad de Ciencias de la Tierra, Universidad Autónoma de Nuevo León, Carretera Linares-Cerro Prieto km. 8, Linares, N.L. 67700, Mexico cFacultad de Ingeniería e Instituto de Geología, Universidad Autónoma de San Luís Potosí, Av. Dr. Manuel Nava No. 8, Zona Universitaria,
San Luís Potosí, S.L.P. 78240, Mexico
a r t i c l e i n f o
Article history: Received 14 March 2008
Received in revised form 18 February 2009 Accepted 18 February 2009
Available online 21 February 2009
Keywords: Electron microprobe Detection limit Odd–even Minerals
a b s t r a c t
Limit of detection (LOD), being a fundamental quality parameter for analytical techniques, has been recently investigated and a systematic behavior has been observed for most odd–even element pairs for many techniques. However, to the best of our knowledge very few LOD data are available in published lit-erature for electron microprobe analysis; these consist of three papers, two being on rare-earth elements and the third covering a large number of elements of atomic number between 21 and 92. These data con-firm the systematic behavior of LODs for many odd–even pairs. To initiate to full this gap, we determined LODs for several major rock-forming chemical elements from Na to Fe with atomic numbers between 11 and 26, during the microprobe analysis of common minerals (olivine, plagioclase, pyroxene, amphibole, quartz, and opaques) in volcanic rocks. The odd–even effect of nuclear stability seems to be present in LOD data for most odd–even pairs investigated. Nevertheless, the experimental strategy concerning the reference materials, calibration procedure, and blank measurements, should be substantially modified to better evaluate the systematic behavior of LOD values in microprobe analysis.
© 2009 Elsevier B.V. All rights reserved.
1. Introduction
During the evaluation of analytical techniques for the determi-nation of lanthanides (La–Lu) in geological materials and using a multi-laboratory compilation of concentration data in inter-national geochemical reference materials, the presence of the odd–even effect of nuclear stability and of natural abundances in inter-laboratory limits of detection (LODs) was observed and doc-umented in 2002 for several analytical techniques such as mass spectrometry, nuclear methods, and emission spectrometry[1]. The LODs fully mimicked the rare-earth element (REE) concentration patterns of natural earth and planetary materials (see Fig. 11 in
[1]; alsoFig. 1in the present work). This exciting observation of a systematic behavior of LODs for the lanthanides was immediately confirmed during 2003 in single laboratory data, specifically for these as well as other analytical techniques, either from compila-tion of analytical data from several laboratories (see Figs. 2 and 3 in
[2]) or actual chemometric experiments for high-performance liq-uid chromatography (see Fig. 4 in[3]) and later in 2007 for capillary electrophoresis (see Fig. 3 in[4]). The systematic behavior of LODs
∗ Corresponding author. Tel.: +52 55 56229745; fax: +52 777 3250018.
E-mail address:[email protected](S.P. Verma).
was also investigated in 2003 for other elements as well:74W to
92U (see Table 1 in[5]);55Cs to73Ta (see Figs. 1–3 in[6]); and, in
fact, in 2005 for most elements of the periodic table (see Figs. 1–3 in[7]). Such a systematic behavior in LODs has been independently confirmed (during 2004–2007) by other workers as well[8,9]and extensively discussed in a recent review in 2006[10].
In order to investigate if such a systematic behavior and odd–even effect in LODs also existed for electron microprobe anal-ysis technique, an exhaustive search of literature of LOD values was undertaken. Although a fairly larger number of published articles (e.g.[11–20]) and books (e.g.[21]) presented discussion on this technique and some of them on LODs, we failed to find too many publications that actually reported well-determined LOD values that could be used for the evaluation of the presence or absence of their systematic behavior[1–9]. Nevertheless, three papers are probably worthy of further discussion: two[22,23]for only the rare-earth elements and one for many elements but excluding most major-elements[24](see Section3).
This was the reason that motivated us to investigate the analyti-cal technique of electron microprobe for the determination of some elements in common igneous rock-forming minerals olivine, pla-gioclase, pyroxene, quartz, and amphibole, and accessory opaque minerals. We present a synthesis of the LOD values estimated in these three previous papers[22–24]and the odd–even effect in
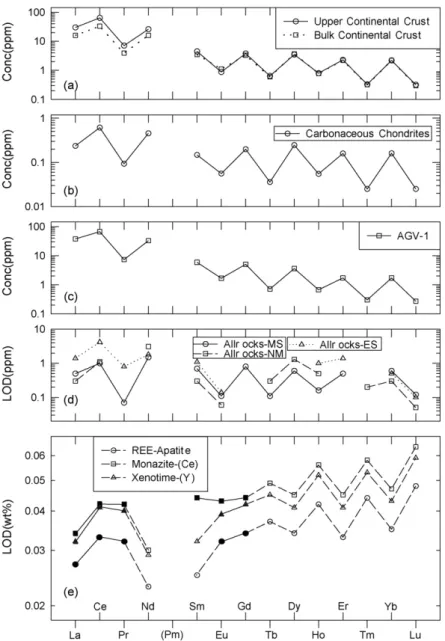
Fig. 1.Concentration data and limits of detection (LODs) for the rare-earth elements (REE). (a) Upper and bulk continental crust data[26]; (b) carbonaceous chondrite data[27]; (c) geochemical rock reference material andesite AGV-1 data[28]; (d) LODs for different analytical techniques obtained from inter-laboratory data on geochemical reference materials[1]; and (e) LOD data for electron microprobe analysis of rare-earth phosphates[23]. LODs of lanthanides indicated by filled symbols joined with continuous lines show the same trend as in (a–d), whereas the open symbols joined with dashed lines show the opposite trend.
LODs as well as the preliminary results of our LOD data for six odd–even pairs. To the best of our knowledge, this is the first study of LODs for the analysis of these eight major-elements with atomic numbers from 11 to 26 in geological materials.
2. The proposed systematic behavior and odd–even effect in LODs
To illustrate the well-known odd–even effect [25] (or Oddo–Harkins rule) in elemental abundances, we have included REE average concentration data for Earth’s continental crust (both upper and bulk,Fig. 1a[26]), carbonaceous chondrites (Fig. 1b[27]), and a geochemical rock reference material andesite AGV-1 from U.S.A. (Fig. 1c[28]). Note all samples show a similar zig-zag pat-tern, in which the odd atomic number lanthanides show smaller concentrations as compared to their nearest even-numbered neigh-bor elements. For example, Pr with odd atomic number of 59 shows smaller concentration values than its even atomic number neigh-bors Ce (atomic number 58) and Nd (atomic number 60)[1].
This odd–even effect in elemental natural abundances is related to the greater nuclear stability of even-numbered lanthanides as compared to odd-numbered ones [25]. The first indications of the odd–even effect reflected in LODs [1] for several analytical techniques (mass spectrometry, nuclear methods, and emission spectrometry) are also illustrated inFig. 1d. Note that the LODs from all techniques show the same zig-zag pattern as the concentration data in earth and terrestrial materials.
3. Synthesis of published literature on LODs
128 S.P. Verma et al. / Analytica Chimica Acta 638 (2009) 126–132
Fig. 2.Synthesis of limit of detection (LOD) data for electron microprobe analysis presented in the literature[24]. The symbols are explained as inset. (a) Actual LOD data for elements with atomic numbers between 21 and 92 under different operating conditions; and (b) odd/even LOD ratios calculated from the data presented in (a), the open circles represent smaller atomic number in the numerator and its next nearest neighbor element with greater atomic number in the denominator, whereas the filled circles are for the greater atomic number in the numerator and its earlier neighbor element with smaller atomic number in the denominator—see inset in (b). LODs for the elements plotted here were obtained with the same instrumental conditions (voltage = 20 kV, current = 100 nA and counting time = 300 s) except a few indicated by arrows.
LOD data for all REE[23]obtained from the study of three min-erals apatite, monazite and xenotime, are shown inFig. 1e. These authors used an electron microprobe analyzer equipped with three wavelength-dispersive spectrometers. Although the zig-zag pat-tern is represented in the LOD values, it is generally the reverse to that observed for other analytical techniques [1–9](see also
Fig. 1d). Only a few pairs identified by solid lines (Fig. 1e) show the pattern observed by numerous workers[1–9]. Possible reasons for these discrepancies may be related to the incapability in this work[23]to quantify the abundances of middle and heavy lan-thanides in two of their minerals and of light lanlan-thanides in the third mineral (see Table 2 in[23]), thus resulting in approximate LOD values. A better chemometric experiment with operating con-ditions optimized for the quantification of all trace-elements under consideration[11–21,24]will have to be performed to confirm the presence or otherwise of the systematic behavior as put forth by Verma and colleagues[1–7]and followed by Tsakanika et al.[8]
and Rodríguez-Ríos et al.[9]. The other problem concerning LODs in this work was that the total number of measurements (n= 6–15) for obtaining these LODs was also much smaller that the desired minimum number of 30 measurements suggested for this purpose
[7].
We summarize in Fig. 2 the results obtained in the third paper[24] on LODs of a large number of elements. Their elec-tron microprobe was equipped with four wavelength-dispersive spectrometers. These authors carried out LOD measurements for different operating conditions. The LOD values significantly decreased (Fig. 2a) when, at a given voltage, greater beam current or greater counting times were used. This behavior has been reported in the literature, e.g. see the discussion in[21]. We evaluated the most numerous LOD data corresponding to the operating condi-tions of 20 kV to 100 nA with 300 s counting times by examining all odd–even pairs (Fig. 2b). When odd/even LOD ratio is <1, the odd–even effect as documented by Verma and colleagues[1–7]is valid, whereas when this ratio >1, the zig-zag pattern of LOD values seems to be the opposite. More cases seem to lie in the lower part of the diagram (Fig. 2b) suggesting the existence of the systematic
pat-tern observed for other analytical techniques[1–7]. The exceptions may be due to the more complicated natural abundance patterns in planetary and earth materials for elements with smaller atomic number than for the REE[26,29].
In another study with electron microprobe[19]different instru-mental conditions were investigated for the measurements of Sr/Ca ratios in otoliths of anadromous salmonids, but these authors did not report any LOD data. In any case, Sr and Ca are not neighbor elements in the periodic table, so these values would not have been of much help to evaluate the odd–even effect.
4. Experimental
Thin sections from Mexican volcanic rock samples covering basaltic, andesitic, dacitic, and rhyolitic compositions were pre-pared for microprobe analysis. A JEOL electron microprobe, model JXA-8900M at the Centro de Microscopía Electrónica, Universi-dad Complutense de Madrid, was used for mineral analysis. This instrument is equipped with five wavelength-dispersive spec-trometers. The measurement conditions were: 15 kV accelerating voltage, 20 nA beam current, and spot diameter was about 1m
[30].
Different types for reference minerals are available for micro-probe calibrations[31–36]. Reference minerals used for calibration of major-elements Na to Fe with atomic number from 11 to 26 are listed inTable 1 [31,35]. No appreciable Na2O loss was detected in
plagioclase and hydrous reference minerals (e.g. amphibole) using these measurement conditions[37].
LOD values were estimated from the following equation taken from the manual of JEOL electron microprobe instrument:
LOD=Cs·2·
2·Ib
(Ip−Ib)·√t
(1)
Table 1
Geochemical composition of electron microprobe reference samples.
Composition (% m/m) Apatite USNM 104021[31] Microcline USNM 143966[31] Albite 131705 [35] Almandine 112140[35] Kaersutite 131928[35] Sillimanite 131013[35]
SiO2 0.34 64.24 68.07 38.40 39.60 37.10
TiO2 0.01 0.05 5.19
Al2O3 0.07 18.30 19.78 22.50 14.78 62.90
Fe2O3 0.06 0.09 1.19 12.34
FeO 0.04 0.24 25.45 0.72
MnO 0.01 0.04 2.18 0.12
MgO 0.01 0.03 8.34 12.42
CaO 54.02 0.02 1.74 10.42
Na2O 0.23 1.30 11.44 0.12 2.82
K2O 0.01 15.14 0.27 1.43
P2O5 40.78
contribution mainly originating from the X-ray continuum spec-tra was estimated by interpolating the intensity measured with the wavelength offset on each side of the peak. Note that the term
2·Ib/(Ip−Ib)·√tin Eq.(1)becomes without unit because both
IbandIpare in s−1andtis in s. Consequently, the units of LOD are the same as ofCs, i.e.,g g−1.
The LOD data for individual minerals were processed for possi-ble discordant outliers using single-outlier discordancy tests[38]. The application of such discordancy tests requires the availabil-ity of critical values at a given confidence level (in our case 99%). The calculated sample statistic is compared with the corresponding critical value in order to infer the nature of the outlying obser-vation whether discordant or pertaining to the same statistical sample. Until the recent work on the simulation of new critical val-ues[39–41], the literature critical values were less precise and even unavailable for certain statistical sample sizes. Therefore, for our present work we used the new, more precise and accurate critical values in a computer program UDASYS[42]. This data treatment is novel because the application of discordancy tests is mandatory for using mean and standard deviation values for central tendency and dispersion parameters, respectively [43]. It is interesting to note that some electron microprobe instruments are equipped with modified software that routinely applies this kind of discordancy tests before the count rate data are made available to the user[16].
5. Results
The names and concentrations of reference minerals used for calibration are summarized inTable 1. The reference minerals used in the calibration of the elements were as follows: Apatite—P; Microcline—K; Albite—Si, Na; Almandine—Fe, Mn; Kaersutite—Ti, Ca, Mg; and Sillimanite—Al. Mean background counts varied from about 5 cps for Na, P, Mn, and Fe, about 10 cps for Mg, Si, and K, up to about 15 cps for Al and Ca. For the reference materials used for calibration, the peak-to-background ratios were around 500:1 for Al and P, 250:1 for Si, at least 100:1 for Na, Mg, K, Ca, and Fe, around 15:1 for Mn.
For more abundant major-elements Mg, Al, Si, Ca, and Fe in the minerals of Mexican volcanic rocks, the peak-to-background ratio was often at least 100:1 whereas for less abundant major-elements Na and K it was at least 50:1, and less for the least abundant major-elements P and Mn. The background correction was almost negligible, but as concentration decreased, the background became more important.
LOD values for nine chemical elements were estimated using three common rock-forming minerals (olivine, plagioclase, and pyroxene) for experiments carried out during 2001–2003 and for these and four additional minerals (amphibole, quartz, ilmenite, and magnetite) for work during 2006. The results of LOD values for
three minerals for 2001–2003 and for eight minerals for 2006 mea-surements are presented inTable 2. For 2001–2003 data, because very few orthopyroxene samples were analyzed, they were grouped with clinopyroxene samples, thus calling the results as for pyrox-ene.
The number of measurements for the 2001–2003 data of olivine, plagioclase, and pyroxene were very large from 46 to 146 (with one exception15P in pyroxene), whereas for the 2006 data of olivine,
plagioclase, orthopyroxene, and amphibole these were between 28 and 105. However, for the remaining minerals clinopyroxene, quartz, ilmenite, and magnetite, these numbers were much smaller (6–19). Thus, most LOD measurements were based on considerably greater numbers than the minimum of 30 recommended by Verma and Santoyo[7].
6. Discussion
The authors of the review[10]specifically referred to the impli-cations of LOD values in mass spectrometric measurements and the need to investigate in detail the possible causes. Some of the factors that can control the LODs in mass spectrometry are isotopic com-positions and formation of different kinds of ions such as doubly charged ions and oxides.
However, the conventional microprobe analysis at present is not capable of distinguishing between different types of isotopes and is therefore element-sensitive only. Therefore, the differences in isotopic compositions of neighbor elements cannot affect LOD val-ues in this analytical technique as is the case of numerous other techniques such as liquid chromatography[3]and capillary elec-trophoresis[4].
LODs of the odd–even neighbor element pairs can be expressed in terms of following two equations for odd and even elements, respectively.
(LOD)o=
(Cs)o·2·
2·(Ib)o
((Ip)o−(Ib)o)· √
to
(2)
(LOD)e=
(Cs)e·2·
2·(Ib)e
((Ip)e−(Ib)e)· √
te
(3)
where the subscripts o and e refer to the odd and even number elements, respectively. The other symbols are the same as in Eq.
(1).
The odd–even LOD ratio can be expressed as follows:
(LOD)o (LOD)e =
((Ip)e−(Ib)e)
(Cs)e ·
(Cs)o ((Ip)o−(Ib)o)·
(Ib)o (Ib)e·
teto (4)
130 S.P. Verma et al. / Analytica Chimica Acta 638 (2009) 126–132
Table 2
Mean values of limits of detection (LODs) for nine elements determined by the analysis of common minerals in volcanic rocks.
Sample mineral Mean values of limits of detection ing g−1(n)
11Na 12Mg 13Al 14Si 15P 19K 20Ca 25Mn 26Fe
Minerals in basaltic to rhyolitic volcanic rocks from Acoculco caldera of the eastern Mexican Volcanic Belt and Sierra Chichinautzin of the central Mexican Volcanic Belt (measured during 2001–2003)
Olivine 143 (82) 170 (82) 123 (82) 410 (82) 153 (55) 115 (87) 129 (87) 294 (87) 315 (82) Plagioclase 166 (146) 153 (146) 136 (141) 491 (142) 151 (82) 109 (146) 123 (145) 278 (146) 291 (146) Pyroxene 145 (71) 159 (71) 132 (71) 483 (67) 161 (10) 114 (71) 135 (71) 300 (71) 306 (71) Minerals in andesitic to dacitic volcanic rocks from Sierra de la Cruces of the central Mexican Volcanic Belt (measured during 2006)
Olivine 147 (36) 171 (33) 111 (30) 374 (30) – 105 (31) 123 (31) 303 (36) 295 (30) Plagioclase 186 (105) 149 (105) 168 (105) 449 (99) – 104 (105) 121 (105) 282 (105) 289 (105) Clinopyroxene 151 (23) 162 (23) 129 (23) 459 (23) – 110 (23) 130 (19) 294 (23) 324 (23) Orthopyroxene 149 (65) 162 (65) 123 (65) 423 (60) – 109 (65) 126 (65) 302 (65) 320 (65) Amphibole 157 (36) 158 (36) 141 (36) 415 (28) – 110 (36) 129 (36) 303 (36) 315 (36)
Quartz 151 (7) 151 (7) 138 (7) 538 (7) – 104 (7) 117 (7) 267 (7) 298 (7)
Ilmenite 151 (6) 162 (6) 140 (6) 290 (6) – 128 (6) 150 (6) 355 (6) 374 (6)
Magnetite 152 (7) 160 (7) 142 (7) 276 (7) – 132 (7) 158 (7) 380 (7) 425 (7)
n= number of final LOD measurements; single-outlier discordancy tests[38–43]were applied and only the final number of measurements is reported here.
Fig. 3.Ratio of limits of detection (LODs) for odd–even pairs plotted against the odd–even element names (the pairs are identified by their chemical symbols) for electron microprobe analysis of common minerals obtained in the present work. Horizontal dashed and dotted lines schematically show the values of 1 and 0.5, respectively, for the y-scale. The error bars are±one standard deviation values. (a) Actual concentration patterns for elements from atomic number 11 (Na) to 26 (Fe) for average continental crust
counts for unit concentration of these odd–even elements) of the microprobe.
As explained above, the odd–even effect of nuclear stability[25]
and natural abundances[26–30], if present in LODs, should result in smaller LOD values for an odd-numbered element as compared to the neighbor even-numbered element, and therefore, the odd/even LOD ratio should be <1. The LOD data (Fig. 3) actually show that this ratio for six (Fig. 3b) and five pairs (Fig. 3c) is generally less than or close to 1. The ratios of <1 are thus consistent with the odd–even effect. Concentrations of these major-elements in nature are highly variable. Just to illustrate, two patterns of concentration data from the literature are included inFig. 3a[26,44]. In order to correctly evaluate the odd–even effect in LODs, concentrations of the elements of interest should be investigated in materials in and around the particular laboratory where the experimental work is to be undertaken.
Although during the analysis of common minerals a large num-ber of measurements of LODs were carried out (Table 2), more reliable results would be obtained if, instead of natural miner-als, synthetic materiminer-als, preferably glasses, having relatively low concentrations of elements of interest were used. The use of such “dilute” synthetic samples would be more consistent with the def-inition of LOD[45–47]. Thus, we may emphasize that some of the traditional problems with the estimation of LODs in microprobe work may be related to the convention of using natural materials. The heterogeneity of reference minerals is one of the most impor-tant problems[21]that would lead to larger variance both in the sensitivity and LOD values. The calibration procedure using only one or two reference materials is also generally very simple and probably inaccurate from the modern analytical point of view (e.g.
[48–50]). Besides, these practices may not be fully consistent with the definition of LOD[45–49].
In other instrumentation, LODs are obtained from most “dilute” synthetic standards and calibrations based on weighted least-squares linear regression (WLR) models[4,51–55]. Thus, although the WLR models constitute a standard statistical procedure, their application to instrumental calibration requires estimation of analytical uncertainties for both axes—concentration as well as instrumental response. These uncertainties are not routinely esti-mated, and the ordinary linear regressions continue to be the common practice for instrumental calibrations until recently. It would therefore be advantageous to implement these recent cali-bration trends of WLR models to more reliably estimate sensitivities and total analytical uncertainties from error propagation theory
[50,52,56]. We suggest that well-controlled (chemometric) experi-ments for major- and trace-eleexperi-ments should be undertaken to fully ascertain the presence of the odd–even effect in electron micro-probe technique.
The best strategy would be to investigate the lanthanide group because it has been proven to be the most useful group of elements for the purpose of evaluating the odd–even effect in LODs[1–7]. The main reason for this affirmation is that the natural abundances of the lanthanides show a more consistent zig-zag abundance pattern than the other elements of the Periodic Table[26,29]. However, one report on LODs for these elements[23]as inferred from the analy-sis of accessory minerals (apatite, monazite, and xenotime) shows that only some of the odd–even LOD ratios are consistent with the odd–even effect whereas others also show a zig-zag pattern but inverse to that observed for the concentrations of natural materials (Fig. 1). Nevertheless, the possible causes for these discrepancies were also discussed above.
7. Conclusions
Our preliminary LOD results are generally consistent with the presence of odd–even effect in this quality parameter. Well-planned
chemometric experiments through instrumental calibrations using WLR and a greater number of reference materials as well as synthetic low-concentration glass materials instead of natural min-erals, are required to better constrain this systematic behavior of LODs in electron microprobe technique.
Acknowledgements
This work was carried out under a cooperative program between the UNAM and UANL (Mexico) and Universidad Complutense de Madrid (Spain). We are grateful to José González de Tenango for guidance during the use of the microprobe equipment. We also thank the anonymous reviewers and the editor for helpful comments on an earlier version of this paper; these suggestions motivated us to significantly improve our presentation.
References
[1] S.P. Verma, E. Santoyo, F. Velasco-Tapia, Int. Geol. Rev. 44 (2002) 287. [2] S.P. Verma, E. Santoyo, Proceedings of the ISMAS Silver Jubilee Symposium on
Mass Spectrometry, Goa, India, vol. 1 (invited talks), 2003, p. 471. [3] E. Santoyo, S.P. Verma, J. Chromatogr. A 997 (2003) 171.
[4] E. Santoyo, R. García, K.A. Galicia-Alanis, S.P. Verma, A. Aparicio, A. Santoyo-Castelazo, J. Chromatogr. A 1149 (2007) 12.
[5] S.P. Verma, E. Santoyo, Proceedings of the ISMAS Silver Jubilee Symposium on Mass Spectrometry, Goa, India, vol. 2 (contributed papers), 2003, p. 511. [6] S.P. Verma, E. Santoyo, Anal. Bioanal. Chem. 377 (2003) 82.
[7] S.P. Verma, E. Santoyo, Accredit. Qual. Assur. 10 (2005) 144.
[8] L.V. Tsakanika, M.T. Ochsenkuhn-Petropoulou, L.N. Mendrinos, Anal. Bioanal. Chem. 379 (2004) 796.
[9] R. Rodríguez-Ríos, A. Aguillón-Robles, J.L. Leroy, Rev. Mex. Cienc. Geol. 24 (2007) 328.
[10] J.R. Bacon, K.L. Linge, R.R. Parrish, L. Van Vaeck, J. Anal. At. Spectrom. 21 (2006) 785.
[11] T.O. Ziebold, Anal. Chem. 39 (1967) 858.
[12] P.J. Potts, A.G. Tindle, M.C. Isaacs, Am. Mineral. 68 (1983) 1237.
[13] A. Kuczumow, G. Holland, Spectrochim. Acta, Part B: Atom. Spectros. 43 (1988) 743.
[14] D.R. Cousens, R. Rasch, C.G. Ryan, Micron 28 (1997) 231.
[15] E. Jarosewich, Electron microprobe reference materials for geologic analysis—a need for developing strategy, Microsc. Microanal. 4 (1998) 238–239. [16] M. Fialin, H. Rémy, C. Richard, C. Wagner, Am. Mineral. 84 (1999) 70. [17] E. Lifshin, R. Gauvin, Microsc. Microanal. 7 (2001) 168.
[18] J.J. McGee, K. Keil, Microsc. Microanal. 7 (2001) 1200. [19] C.E. Zimmerman, R.L. Nielsen, Fish Bull. 101 (2003) 712. [20] G.B. Morgan VI, D. London, Am. Mineral. 90 (2005) 1131.
[21] P.J. Potts, J.F.W. Bowles, S.J.B. Reed, M.R. Cave, Microprobe Techniques in the Earth Sciences, Chapman & Hall, London, 1995.
[22] V. von Seckendorff, Eur. J. Mineral. 12 (2000) 73.
[23] I.P. Laputina, V.A. Batyrev, A.I. Yakushev, J. Anal. At. Spectrom. 14 (1999) 465. [24] A.R. Ramsden, D.H. French, Can. Mineral. 28 (1990) 171.
[25] I. Kaplan, Nuclear Physics, Addition-Wesley, Reading, 1963. [26] S.R. Taylor, S.M. McLennan, Rev. Geophys. 33 (1995) 241. [27] W.F. McDonough, S.-S. Sun, Chem. Geol. 120 (1995) 223. [28] F. Velasco-Tapia, M. Guevara, S.P. Verma, Chem. Erde. 61 (2001) 69. [29] E. Anders, M. Ebihara, Geochim. Cosmochim. Acta 46 (1982) 2363. [30] F. Velasco-Tapia, S.P. Verma, Int. Geol. Rev. 43 (2001) 788.
[31] E. Jarosewich, J.A. Nelen, J.A. Norberg, Geostand. Newslett. 4 (1980) 43. [32] E. Jarosewich, I.M. MacIntire, J. Sediment. Petrol. 53 (1983) 677. [33] E. Jarosewich, R. Gooley, J. Husler, Geostand. Newslett. 11 (1987) 197. [34] E. Jarosewich, L.A. Boatner, Geostand. Newslett. 15 (1991) 397. [35] A.V. McGuire, C.A. Francis, M.D. Dyar, Am. Mineral. 77 (1992) 1091. [36] E. Jarosewich, J. Res. Nat. Inst. Stand. Technol. 107 (2002) 681. [37] A. Márquez, C. De Ignacio, Lithos 62 (2002) 35.
[38] S.P. Verma, Geostand. Newslett. J. Geostand. Geoanal. 21 (1997) 59. [39] S.P. Verma, A. Quiroz-Ruiz, Rev. Mex. Cienc. Geol. 23 (2006) 133. [40] S.P. Verma, A. Quiroz-Ruiz, Rev. Mex. Cienc. Geol. 23 (2006) 302.
[41] S.P. Verma, A. Quiroz-Ruiz, L. Díaz-González, Rev. Mex. Cienc. Geol. 25 (2008) 82.
[42] S.P. Verma, L. Díaz-González, Comput. Geosci., under review.
[43] V. Barnett, T. Lewis, Outliers in Statistical Data, third ed., John Wiley & Sons, Chichester, 1994.
[44] E.S. Gladney, C.E. Burns, I. Roelandts, Geostand. Newslett. 7 (1983) 3. [45] G.L. Long, J.D. Winefordner, Anal. Chem. 55 (1983) 713A.
[46] IUPAC, Analytical Chemistry Division, Spectrochim. Acta 33B (1978) 241. [47] Analytical Methods Committee, Analyst 112 (1987) 199.
[48] M. Otto, Chemometrics. Statistics and Computer Application in Analytical Chemistry, Wiley–VCH, Weinheim, 1999.
132 S.P. Verma et al. / Analytica Chimica Acta 638 (2009) 126–132
[50] S.P. Verma, Estadística Básica para el Manejo de Datos Experimentales: Apli-cación en la Geoquímica (Geoquimiometría), Universidad Nacional Autónoma de México, México, D.F., 2005.
[51] K. Baumann, Process Control Qual. 10 (1997) 75.
[52] P.R. Bevington, D.K. Robinson, Data Reduction and Error Analysis for the Physical Sciences, McGraw-Hill, Boston, MA, USA, 2003.
[53] M. Guevara, S.P. Verma, F. Velasco-Tapia, R. Lozano-Santa Cruz, P. Girón, Geo-stand. Geoanal. Res. 29 (2005) 271.
[54] S.P. Verma, L. Díaz-González, P. Sánchez-Upton, E. Santoyo, WSEAS Trans. Env-iron. Develop. 2 (2006) 997.
[55] J. Tellinghuisen, Analyst 132 (2007) 536.
![Fig. 2. Synthesis of limit of detection (LOD) data for electron microprobe analysis presented in the literature [24]](https://thumb-us.123doks.com/thumbv2/123dok_es/5422315.106922/3.892.215.665.78.435/synthesis-limit-detection-electron-microprobe-analysis-presented-literature.webp)

