Determination of Aflatoxins in Botanical Roots by a Modification
of AOAC Official Method
SM991.31: Single-Laboratory Validation
Carol M. Weaver and Mary W. Trucksess1
U.S. Food and Drug Administration, 5100 Paint Branch Pkwy, College Park, MD 20740
Abstract
AOAC Official MethodSM 991.31 for the determination of aflatoxins (AFs; sum of aflatoxins B1,
B2, G1, and G2) in corn, raw peanuts, and peanut butter by using immunoaffinity column cleanup
with LC has been modified and applied to the determination of AFs in botanical roots. The modifications were necessary to improve the performance of the method for matrixes beyond corn and peanuts. The extraction solvent was changed from a mixture of methanol and water to acetonitrile and water. The accuracy, repeatability, and reproducibility characteristics of this method were determined. Replicates of 10 test portions of each powdered root (black cohosh, echinacea, ginger, ginseng, kava kava, and valerian) at each spiking level (AFs at 0, 2, 4, 8, and 16 ng/g) were analyzed on 3 separate days. Test portions were extracted with acetonitrile–water (84 + 16, v/v), and the extracts were centrifuged, diluted with phosphate-buffered saline, filtered, and applied to an immunoaffinity column containing antibodies specific for AFs. After the column was washed with water, the toxins were eluted from the column with methanol and quantified by HPLC with fluorescence detection. All test materials except kava kava were found to contain AF at <0.1 ng/g. Kava kava was naturally contaminated with AFs at 0.5 ng/g. Average within-day and between-days recoveries of AFs from botanical roots ranged from 88 to 112 and from 86 to 118%, respectively. Total RSD values for within-day and between-days repeatability ranged from 1.4 to 15.9%. HorRat
values were <0.4 for all of the matrixes examined. The modified AOAC Official Method 991.31 was
found to be applicable to an analysis of the six botanical roots.
Botanicals or herbal plants have been consumed as food or used as medicines since the beginning of human history. With the advance of modern medicines, botanicals have become alternative medicines or dietary supplements and remain as traditional medicines in many parts of the world. Medicinal plants or botanicals are usually dried and preserved after harvesting. In spite of the long history and wide use of botanicals, there are very few publications on molds and mycotoxins in such plants when compared with publications on molds and mycotoxins in grains and oilseeds. Raw materials for medicinal use and herbal supplements are frequently contaminated with toxigenic fungi generated from the soil, or from the plants themselves, during harvesting or storage. Surveys of toxigenic molds in botanicals have found high levels of Aspergillus, Penicillium, and Fusarium spp. (1–3). Contamination of mycotoxins produced by these fungi could pose human health problems.
Mycotoxins, specifically the aflatoxins (AFs), a group of structurally related compounds
consisting of aflatoxins B1, B2, G1, and G2, are among the major mycotoxins found in
agricultural commodities. Studies from Egypt, India, Sri Lanka, Malaysia, and Indonesia
reported finding AFB1 in medicinal plants. In Egypt, nine of the 31 herbs and medicinal plants
analyzed by LC with UV detection contained average AFB1 levels of 49 µg/kg (4). In India,
15 different drug plant samples were collected from storehouses and analyzed for aflatoxins
NIH Public Access
Author Manuscript
J AOAC Int. Author manuscript; available in PMC 2010 July 8.
Published in final edited form as: J AOAC Int. 2010 ; 93(1): 184–189.
NIH-PA Author Manuscript
NIH-PA Author Manuscript
(5); 14 of the 15 samples contained AFB1 levels of 0.1–1.2 µg/kg. In another study in India,
60 samples of seeds of medicinal plants were screened for mycotoxins (6); 36 were positive
for AFB1 at levels ranging from 20 to 1180 µg/kg. In Sri Lanka, AFB1 at 500 µg/kg was
detected in Aerra lanata, one of the six Asian medicinal plants, by TLC (1). In Malaysia and
Indonesia, 16 of 23 traditional herbal medicine known as jamu and makjun were analyzed by
immunoaffinity column LC that contained low levels of AFB1 at 0.3 µg/kg (7). In 2008, a
comprehensive review of the occurrence of AFs and other mycotoxins in botanicals was published (8).
Many methods exist by which total AFs may be detected and measured in grains and nuts by using TLC, LC, ELISA, and LC/MS. As science and technology grow at an ever increasing rate, many analytical methods are capable of detecting mycotoxins at levels as low as 0.01 ng/ g. However, only a few reports of validation of these methods for botanicals have been published (9–11). Accurate results cannot be ensured without validation of the method and confirmation of the identities of the toxins. The first collaboratively validated method for AFs
and ochratoxin A in botanical roots, AOAC Official MethodSM2008.02, is applicable to
ginseng and ginger (12). Validated methods for AFs that are applicable to a wider variety of botanicals are also needed for consumer protection. The goal of this single-laboratory validation study was to determine the performance characteristics of a modification of AOAC
Official Method991.31 for the determination of AFs in black cohosh, echinacea, ginger, ginseng, kava kava, and valerian.
METHOD
Plant Test Materials
Six finely ground botanical roots were purchased. Ginseng (Panax quinquefolius) was
purchased from Schumacher Ginseng (Marathon, WI). Ground ginger (dried, ground rhizomes of Zingiber officinale Roscoe) was purchased from McCormick (Baltimore, MD). Ground kava
kava (Piper methysticum), black cohosh (Cimicifuga racemosa), echinacea (Echinacea
purpurea), and valerian (Valeriana officinalis) were purchased from Penn Herb (Philadelphia, PA).
Control Materials
At present, there is only one validated method, AOAC Official Method2008.02, for the
determination of AFs in botanicals. Therefore, Method 2008.02 was used to analyze the test
materials. Kava kava was found to contain AFB1 at 0.5 ng/g. AFs were found in the remaining
five roots at <0.1 ng/g AFB1. Similar results were found by using this modified AOAC Official
Method991.31.
Aflatoxin-Added Materials
Test portions were spiked with AF at 2, 4, 8, and 16 ng/g. A spiking solution containing a
mixture of the four AFs was used (AFB1:AFB2:AFG1:AFG2 = 4:1:2:1). All spiked test portions
were kept at room temperature for ≥1 h before analysis.
Apparatus
Orbital shaker.—VWR DS-500E (VWR International, Bridgeport, NJ), or equivalent shaker capable of 400 rpm.
a. Centrifuge tube.—50 mL, polypropylene.
b. Centrifuge.—Allegra X–22R (VWR International).
NIH-PA Author Manuscript
NIH-PA Author Manuscript
c. Glass microfiber filter paper.—11 cm (Whatman 934AH, Whatman, Inc., Clifton, NJ).
d. Immunoaffinity columns.—AflaTest WB column, (G1024, Vicam, Watertown, MA). The AF immunoaffinity columns contain monoclonal antibodies that are
cross-reactive with AFs B1, B2, G1, and G2; the columns should have a capacity of ≥100
ng total AF; they should give a recovery of ≥80% for AFs B1, B2, G1, and G2 when
5 ng of each AF is applied in 10 mL methanol–phosphate-buffered saline (PBS; 10 + 90, v/v). The columns should have a shelf life of 18 months at 4°C or 12 months at room temperature.
e. Column reservoir.—60 mL, polypropylene (Supelco, Bellefonte, PA) with luer tip or 25 mL glass syringe with luer tip, or equivalent.
f. Column manifold.—Vicam G1104 12-position stand, or equivalent.
g. LC system.—Waters Model 2690 Alliance separate system (Waters, Milford, MA) and Waters Model 2475 fluorescence detector or equivalent LC system. LC operating conditions—Column: Waters AQ12S031546WT, YMC ODS-AQ S-3, 4.6 × 150 mm,
or equivalent. Mobile phase: (1) For black cohosh, echinacea, ginger, ginseng, and
valerian: isocratic, mobile phase methanol–acetonitrile–water (25 + 15 + 60, v/v/v);
run time, 35 min. (2) For kava kava: gradient; 100% mobile phase A, methanol–
acetonitrile–water (25 + 17 + 60, v/v/v), from 0 to 22 min; 100% mobile phase B, acetonitrile–water (80 + 20, v/v), from 23 to 28 min; 100% mobile phase A, from 29 to 45 min. Flow rate: 0.8 mL/min. Detector: excitation wavelength, 362 nm; emission wavelength, 440 nm.
h. Photochemical reactor for enhanced detection (PHRED).—With low-pressure mercury lamp and knitted reactor coils, with a 25 m × 0.25 mm id coil. Used in postcolumn derivatization system for AF (AURA Industries, New York, NY).
Caution: Avoid looking at the UV lamp.
Reagents
a. Solvents and chemicals.—LC grade methanol and acetonitrile, ACS grade sodium chloride, PBS, pH 7.4 (Sigma P-3813; Sigma-Aldrich, St. Louis, MO), and Tween 20 (Sigma P-5927, Sigma-Aldrich).
b. Extraction solvent.—Acetonitrile–water (84 + 16, v/v). Mix solvents and equilibrate to room temperature.
c. PBS, 10 mM solution.—Dissolve one package Sigma P-3813 PBS powder in 1 L water.
d. AFs.—A 6636 (AFB1), A 9887 (AFB2), A 0138 (AFG1), and A0263 (AFG2;
Sigma-Aldrich).
e. AF stock standard solutions.—Prepare solutions of each of the four AFs at 10 mg/
mL in acetonitrile according to revised AOAC Method 971.22. Store, if necessary, at
−18°C.
f. Intermediate standard solution of AFs.—Prepare 400 ng/mL solution of AFs (mixture
of AFB1, AFB2, AFG1, and AFG2 at 200, 50, 100, and 50 ng/mL, respectively) by
adding an appropriate amount of each AF stock standard solution to the same volumetric flask and diluting to volume with acetonitrile. Use the intermediate standard as the spiking solution for recovery studies. Store intermediate standard
solution of AFs at −18°C. Equilibrate to room temperature for ≥30 min before use.
NIH-PA Author Manuscript
NIH-PA Author Manuscript
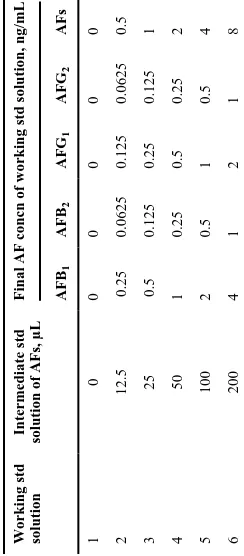
g. Working standard solutions of AFS.—Prepare daily six working standard solutions in separate 10 mL volumetric flasks according to Table 1. Dilute to volume with methanol–water (1 + 1, v/v).
Experimental Design
Replicate test portions for each botanical root were analyzed on 3 different days (n = 4, 4, and
2 for days 1, 2, and 3, respectively), providing 10 analyses for each level (0, 2, 4, 8, and 16 ng/ g). A total of 50 analyses was performed for each root sample. Results were subjected to statistical analysis using AOAC single-laboratory validation data workbook (13).
Extraction
Weigh a 5 g test portion in a 50 mL centrifuge tube. Add 0.4 g NaCl and 25 mL extraction solvent. Mix on a vortex mixer until sample particles and extract solvent are well mixed. Shake
tube at 400 rpm for 10 min. Centrifuge at 7000 rpm (g value = 5323 mm/s2) for 10 min. Pipet
10 mL extract into a 250 mL Erlenmeyer flask, add 90 mL 10 mM PBS containing 0.1% Tween 20, mix contents of flask, and filter through glass microfiber paper. Collect 50 mL filtrate (equivalent to 1 g test portion) into a 50 mL graduated cylinder, and proceed immediately with immunoaffinity column chromatography.
Immunoaffinity Column Isolation
Caution: After removing the immunoaffinity column from storage at 4°C, it must be
equilibrated to room temperature for ≥15 min before use. The immunoaffinity column contains
monoclonal antibodies that are cross-reactive with AFs at the optimum temperature, which ranges from 20 to 30°C.
Remove top cap from column, and connect column to reservoir of column manifold (the fit must be tight). Remove bottom cap from column, and let liquid in column pass through until liquid is about 2–3 mm above the column bed. Pass 50 mL filtrate into reservoir. Let filtrate flow through column by gravity force. Let column run dry. Wash column with 10 mL water. Let column run dry, then force 3 mL air through column with a syringe. Place a 3 mL volumetric flask under column. Elute with 1 mL HPLC grade methanol, collect AFs in a 3 mL volumetric flask, and let column drip freely. Let column run dry. Let column stand for 1 min, then elute with additional 1 mL methanol, and collect eluate in the same volumetric flask. Let column run dry, and force 10 mL air through column. Dilute eluate to volume with water, and perform LC analysis.
LC Analysis
Inject 50 µL reagent blank, AFs working standards, or test solution into LC column. Identify AF peaks in chromatogram of test solution by comparing retention times with those of
standards. AFs elute in the order of AFG2, AFG1, AFB2, and AFB1. After passing through the
PHRED cell, the AFG1 and AFB1 are derivatized to form AFG2a (derivative of AFG1) and
AFB2a (derivative of AFB1). The retention times of AFG2, AFG2a, AFB2, and AFB2a are
between about 15 and 28 min (Figure 1). The peaks should be baseline-resolved. Construct standard curve of each AF. Determine concentration of each AF in test solution from corresponding standard curve.
Standard Curves
Standard curves should be prepared for each of the AFs by using the working standard solutions containing the four AFs described. These solutions cover the ranges of 0.25–4 ng/mL for
AFB1, 0.0625–1 ng/mL for AFB2, 0.125–2 ng/mL for AFG1, and 0.0625–1 ng/mL for
AFG2. Construct the standard curves before analysis according to Table 1, and check the plot
NIH-PA Author Manuscript
NIH-PA Author Manuscript
for linearity by examining the correlation coefficient (R2 > 0.99) of concentrations and responses. If the area response of the test solution is outside (higher) the standard range, the purified test extract should be diluted with methanol–water (50 + 50, v/v) and reinjected into the LC column.
Quantitation and Calculation
The AFs should be quantified by measuring the peak area at each AF retention time and
comparing it with the relevant standard curve. Plot peak area (response, Y-axis) of each AF
standard versus concentration (ng/mL, X-axis) and determine slope (S) and Y-intercept (a).
Calculate level of toxin in test sample by using the equation shown below, where R is the peak area obtained for the test solution, and V is the final volume (mL) of the injected test solution. F is the dilution factor. F is 1 when V is 3 mL. W is 1 g test sample passed through the
immunoaffinity column. Total AF is the sum of AFB1, AFB2, AFG1, and AFG2.
Results and Discussion
When AOAC Method 991.31 was applied to the determination of AFs in botanicals, the average
recoveries for black cohosh, valerian, and echinacea were <50%; and that for kava kava was
<30%. Several modifications were necessary to improve the performance of the method: (1)
The sample size was decreased to 5 g instead of the 25–50 g typically used for grains and nuts, in order to decrease the volume of extraction solvent used. Powdered botanical roots and the contents of botanical capsules are fine particles; therefore, the distribution of AFs is
homogenous (14). (2) The extraction solvent was changed from methanol–water (70 + 30, v/
v) to acetonitrile–water (84 + 16, v/v) to achieve better recoveries of the added AFs. (3) The
dilution solvent was changed from water to 10 mM PBS to reduce the effects of the matrix on
the antibodies. (4) The dilution ratio was changed from 1:3 to 1:10 to lower the acetonitrile
concentration and, subsequently, to avoid denaturing the antibodies. For LC analysis, a step gradient was used for the kava kava test extract in order to rapidly eliminate the late-eluting compound (retention time of >35 min when the isocratic system was used).
All control roots (replicates for 10 analyses of each root) except kava kava were found to be free of AF (<0.1 ng/g). Statistical analysis was not performed for control test samples, except
for kava kava. The AFB1 contamination level in kava kava was 0.5 ng/g (n = 4). Tables 2–4
give results for test portions of spiked black cohosh, echinacea, ginger, ginseng, kava kava, and valerian. Average within-day and between-days recoveries of AFs from botanical roots ranged from 88 to 112 and from 86 to 118%, respectively (Tables 2 and 3). The total within-day and between-within-days SD and RSD values ranged from 0.05 to 0.84 ng/g and from 2.1 to 15.9%, respectively (Table 4).
Table 4 shows the HorRat values calculated for the present study, from 0.1 to 0.4. For single-laboratory validations, HorRat values between 0.3 and 1.3 are generally considered acceptable. A HorRat value of >1.3 indicates that the method exhibits unusually high variance (15). Recent advances in biotechnology have resulted in the development of immunoaffinity columns packed with antibodies with high affinity and specificity that are capable of purifying and isolating the target analytes from interferences. Using these columns greatly improves the precision and accuracy of analytical methods. Therefore, HorRat values of <0.3 were easily achieved.
NIH-PA Author Manuscript
NIH-PA Author Manuscript
Conclusions
The observed HorRat values indicate that the method for the concurrent determination of AFs in powdered botanical roots is reproducible and obtains results similar to those reported for a large number of other studies involving AFs in various matrixes. On the basis of the results of this study, we recommend that the determination of AFs in botanical roots by the method
described above be adopted as a matrix extension and modification of Method 991.31.
Acknowledgments
This work was supported in part by the Office of Dietary Supplements, National Institutes of Health, Bethesda, MD.
References
1. Abeywickrama K, Bean GA. Mycopathologia 1991;113:187–190. [PubMed: 1906136] 2. Halt M. Eur. J. Epidemiol 1998;14:269–274. [PubMed: 9663520]
3. Rizzo I, Vedova G, Maurutto S, Haidukowski M, Varsavsky E. Microbiol. Res 2004;159:113–120. [PubMed: 15293944]
4. Selim MI, Popendorf W, Ibrahim MS, El Sharkawy S, El Kashory ES. J. AOAC Int 1996;79:1124– 1129. [PubMed: 8823921]
5. Roy AK, Sinha KK, Chourasia HK. Appl. Environ. Microbiol 1988;54:842–843. [PubMed: 3132102] 6. Roy AK, Kumari V. Int. J. Pharmacognosy 1991;29:62–65.
7. Ali N, Nashim NH, Saad B, Safan K, Nakajima M, Yoshizawa T. Food Chem. Toxicol 2005;43:1763– 1772. [PubMed: 16019122]
8. Trucksess MW, Scott PM. Food Addit. Contam 2008;25:181–192.
9. MacDonald S, Castle L. Food Addit. Contam 1996;13:121–128. [PubMed: 8647302]
10. AriZo A, Herrera M, Estopañan G, Juan T. Int. J. Food Microbiol 2007;114:366–369. [PubMed: 17107730]
11. Trucksess MW, Weaver C, Oles C, D’Ovidio K, Rader J. J. AOAC Int 2006;89:624–630. [PubMed: 16792061]
12. Trucksess MW, Weaver CM, Oles CJ, Fry FS Jr, Noonan GO, Betz JM, Rader JI. J. AOAC Int 2008;91:511–523. [PubMed: 18567295]
13. Roman M. AOAC Single-Laboratory Validation Repeatability Template, personal communication, AOAC Web link pending. 2008
14. Whitaker TB, Trucksess MW, Weaver CM, Slate A, Giesbrecht FG. Anal. Bioanal. Chem 2009;395:1291–1299. [PubMed: 19529924]
15. Horwitz W, Albert R. J. AOAC Int 2006;89:1095–1109. [PubMed: 16915851]
NIH-PA Author Manuscript
NIH-PA Author Manuscript
Figure 1.
Liquid chromatograms of AF standard and AF in ginger (AF standard: AFB1, 50 pg; AFB2,
12.5 pg; AFG1, 25 pg; AFG2, 12.5 pg).
NIH-PA Author Manuscript
NIH-PA Author Manuscript
NIH-PA Author Manuscript
NIH-PA Author Manuscript
[image:8.612.92.214.401.679.2]NIH-PA Author Manuscript
Table 1
Preparation of standard solutions of AFs Working std solution
Intermediate std
solution of AFs, µL
Final AF concn of working std solution, ng/mL AFB
1
AFB
2
AFG
1
AFG
2
AFs
1
0
0
0
0
0
0
2
12.5
0.25
0.0625
0.125
0.0625
0.5
3
25
0.5
0.125
0.25
0.125
1
4
50
1
0.25
0.5
0.25
2
5
100
2
0.5
1
0.5
4
6
200
4
1
2
1
NIH-PA Author Manuscript
NIH-PA Author Manuscript
[image:9.612.91.253.363.682.2]NIH-PA Author Manuscript
Table 2
Within-day SD, RSD, and average recovery values obtained for AFs determined in spiked botanical roots
SD, ng/g
RSD, ng/g
Avg. recovery, %
a Added, ng/g Added, ng/g Added, ng/g Root 2 4 8 16 2 4 8 16 2 4 8 16 Black cohosh 0.05 0.1 0.2 0.47 2.9 2.9 2.7 3.3 88 88 92 88 Echinacea 0.03 0.1 0.16 0.82 1.6 2.6 2.2 5.8 91 94 95 90 Ginger 0.07 0.08 0.18 0.2 3.6 2 2.2 1.3 94 105 102 103 Ginseng 0.24 0.14 0.21 0.37 11.4 3.2 2.5 2.3 99 110 107 104 Kava kava 0.18 0.19 0.62 0.45 7.5 4.7 8.9 3.3 112 103 94 89 Valerian 0.08 0.05 0.13 0.17 4.3 1.4 1.7 1.2 99 91 93 92 Average 0.11 0.11 0.25 0.41 5.2 2.8 3.4 2.9 97 98 97 94
NIH-PA Author Manuscript
NIH-PA Author Manuscript
[image:10.612.92.253.362.683.2]NIH-PA Author Manuscript
Table 3
Between-days SD, RSD, and average recovery values obtained for AFs determined in spiked botanical roots
SD, ng/g
RSD, ng/g
Avg. recovery, %
a Added, ng/g Added, ng/g Added, ng/g Root 2 4 8 16 2 4 8 16 2 4 8 16 Black cohosh 0.01 0.02 0.15 0.34 0.7 0.6 2.0 2.4 88 89 90 89 Echinacea 0.06 0.12 0.25 0.16 3.6 3.4 3.4 1.1 87 90 93 88 Ginger 0.05 0.15 0.11 0.53 2.7 3.7 1.4 3.3 96 101 100 99 Ginseng 0.23 0.16 0.13 0.21 11.2 3.9 1.5 1.3 105 106 105 102 Kava kava 0.06 0.07 0.32 0.42 2.6 1.6 4.6 3.1 118 100 88 86 Valerian 0.05 0.12 0.09 0.1 2.8 3.2 1.2 0.7 96 95 94 93 Average 0.08 0.11 0.18 0.29 3.9 2.7 2.4 2 98 97 95 93
NIH-PA Author Manuscript
NIH-PA Author Manuscript
[image:11.612.91.250.372.678.2]NIH-PA Author Manuscript
Table 4
Total SD, total RSD, and HorRat values obtained for AFs determined in spiked botanical roots
Total SD, ng/g
Total RSD, ng/g