45º CONGRESO ESPAÑOL DE ACÚSTICA
8º CONGRESO IBÉRICO DE ACÚSTICA
EUROPEAN SYMPOSIUM ON SMART CITIES AND
ENVIRONMENTAL ACOUSTICS
INSERTION LOSS PROVIDED BY SONIC CRYSTAL TYPE BARRIER –
EXPERIMENTAL AND NUMERICAL EVALUATON ON A REDUCED SCALE
MODEL
PACS:43.50.Lj, 43.28.Js
Pedro Santos1; Jesus Carbajo2; Rui Dias1; Luís Godinho1; Paulo Amado Mendes1; Jaime Ramis Soriano2
1
CICC, Departamento de Engenharia Civil, Universidade de Coimbra, Rua Luís Reis Santos - Pólo II da Universidade, 3030-788 Coimbra, Portugal
{uc2006107489@student.uc.pt, uc2007108142@student.uc.pt, lgodinho@dec.uc.pt, pamendes@dec.uc.pt}
2
Dep. Física, Universidade de Alicante, Ap. de Correos 99, 03080 Alicante, España
{jesus.carbajo@ua.es, jramis@ua.es}
ABSTRACT
In a recent research work, a numerical model based on the method of the fundamental solutions to analyze the sound attenuation created by a periodic structure of the sonic crystal type has been developed. The comparison between the numerical results of the model with the ones obtained experimentally for a small scale model (1:5) for different kinds of barrier configuration revealed a good level of accuracy. Following the good results obtained, this present work aims to complete the previous one, with new results obtained for an even smaller scale model (1:10) and various types of configuration.
RESUMO
Num trabalho de investigação recente, um modelo numérico baseado no método das soluções fundamentais para analisar a atenuação sonora criada por uma estrutura periódica do tipo cristal sónica foi desenvolvida. A comparação entre os resultados numéricos do modelo com os obtidos experimentalmente para um modelo à escala reduzida (1: 5) para diferentes tipos de configuração de barreira revelou um bom nível de precisão. Na sequência dos bons resultados obtidos, este trabalho tem como objetivo completar o anterior, com novos resultados obtidos para um modelo de ainda menor escala (1:10) e vários tipos de configuração.
INTRODUCTION
then, different aspects of the behavior of sonic crystals have been studied, some of which were essentially theoretical studies, such as the influence of localized defects (Wu et al. [2]) or the creation of waveguides in which the sound propagates with low attenuation (Vasseur et al. [3]). Practical uses of sonic crystals have also been analyzed, and perhaps the most promising application is their use for the selective attenuation of sound, for example as traffic noise barriers (Sánchez-Pérez et al. [4]), since they can be a competitive solution when compared with classic noise barriers (Castiñeira-Ibáñez et al. [5]). Although a significant number of works has been published, the subject of sonic crystals is still under development and there are several issues that need further study. Recently, a 2D approach to deal with the acoustic behavior of sonic crystals based on the MFS (Method of Fundamental Solutions) was proposed by Martins et al. [6]. An initial comparison between results provided by the numerical model and the ones provided by the well-known Boundary Element Method (BEM) has shown good accuracy of the model as well its advantages in terms of computation times. Also the comparison between numerical and experimental simulations for a laboratory scale model (1:5) made of PVC revealed good agreement (Martins et al. [7]). Following the good results obtained in the referred works, this paper extends the previously presented developments by performing a more complete and extensive study over a smaller scale model (1:10). Here, the details of the experimental setup and of the numerical approach are presented, and a number of results comparing both approaches is given.
NUMERICAL SIMULATION
The methodology used in the numerical simulations is the previous one presented in Martins et al. [6, 7]. The propagation of sound in a two-dimensional space, in the frequency domain, can be represented by the Helmholtz equation as:
∇ + = 0, (1)
where ∇= +
, is the acoustic pressure, = / , = 2 , is the frequency and is
the propagation velocity within the acoustic medium.
Given the differential equation (1), it is possible to define an analytical solution for the particular case of free-field conditions, where the medium is considered as infinite, and the two-dimensional pressure field is generated by a harmonic sound source. The acoustic pressure is then given by:
Gx, x, = −H (2)
Where x is the source position, x is the receiver position and is the distance between the
source and the receiver, all in the 2D plane.
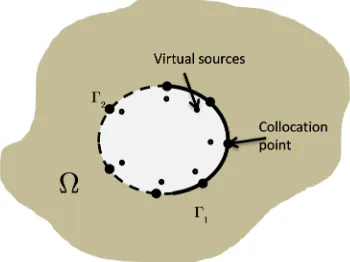
Additionally, boundary conditions of the problem are created by considering a set of virtual sources located outside of the field of analysis (inside the cylinders). The Method of Fundamental Solutions (MFS) is then used to obtain an approximation of the solution of the problem, by combining in a linear way the fundamental solutions of the real and virtual sources as:
px, = ∑$%&!'( Q!G"x, x!, # +∑$&*'(A*G"x, x*, #, 3
where the first and second summation represent the effect of the ,-. virtual sources (with amplitudes Qj) and the effect of the ,. real sources (with amplitudes
A
m), respectively. Figure 1 schematically represents the typical MFS model for the case of a single scatterer.Figure 1 – Schematic representation of the MFS model for a single scatterer. W represents the domain of the problem wich is delimited by the boundary contitions G1 and G2.
EXPERIMENTAL TESTS
[image:3.595.87.511.358.498.2]The tested models consisted on 1:10 scale models of a full-scale barrier. (Figure 2). A series of configurations were adopted for the sonic crystal barrier, basically consisting of variants to the traditional rectangular and triangular lattices.
Figure 2 - Example of a tested noise barrier (1:10 scale model).
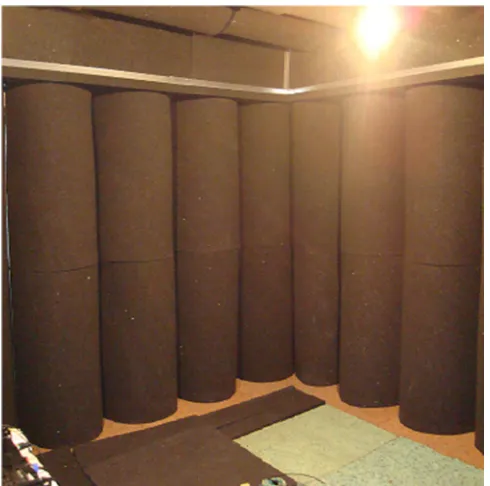
The experimental test layout was created to simulate, as close as possible, the 2D sound propagation assumed in the numerical model. For that, the scatterer was tested on a previously prepared closed quasi-anechoic space, in order to avoid possible interferences generated by reflections in the vicinity of the crystal (Figure 3). In the same line, all the materials placed within the test space, namely the source box, microphone support and barrier support, were covered with absorbing material. These aspects will be described below in more detail.
Figure 3 – Quasi-anechoic test chamber for the noise barriers.
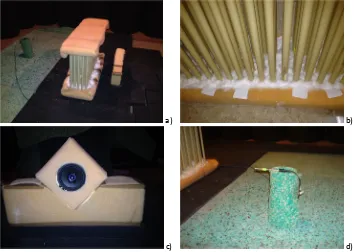
The sound source used for testing consisted of a coaxial speaker from Sony, model
XS-F1026SE (Figure 4c), with an effective frequency range within 65–22000 Hz; it was composed
of a cone-type woofer with 100 mm diameter, and of a tweeter of the balanced-dome type with 25 mm diameter. The source was placed at 0.25 m apart of the barrier and centered with it. In the numerical model, only the tweeter of this device was simulated, as it is the one responsible to produce the higher frequencies.
The sound pressure was evaluated with a microphone from
G.R.A.S Sound & Vibration
model 26AK that was successively placed in a quadrangular mesh over 25 points, with the closest position to the source placed 0.65 m apart from it; the grid of positions was defined considering equal spacing of 125 mm between points along each direction.Both source and microphone, were placed at the same height (half-height of the barrier) in order to get a situation as close as possible of a 2D dispersion for the evaluation of the sound pressure.
In the experimental tests, white noise was generated and the response was acquired as time signals, with an acquisition frequency of 51200 Hz, during 5 seconds, using 01dB’s Symphonie unit & dBBati 32 software. A Fast Fourier Transform (FFT) was then applied over the time signals, in order to compute the frequency domain response at discrete frequencies. Thin band responses were computed considering a band width of 100 Hz.
The Insertion Loss was evaluated as the difference between the Sound Pressure Level (SPL) measured with and without the barrier, using the average SPL obtained at the 25 receiver points.
RESULTS AND DISCUSSION
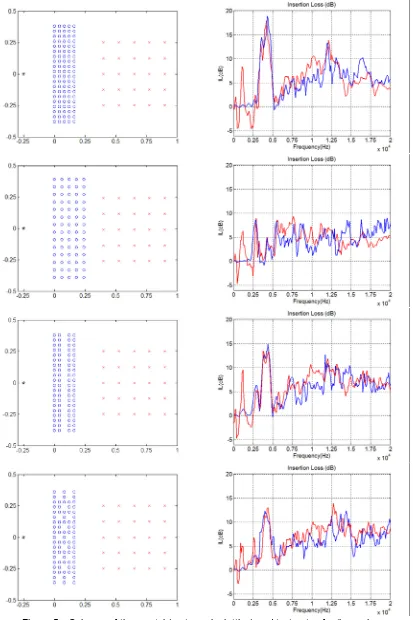
For all configurations, the barrier and the receivers were placed, as in the numerical models, apart from the source at 0.25m and 0.65m, respectively, as represented in the left column of Figures 5 and 6. The response was evaluated at the 25 receiver positions disposed over a square grid, equally spaced at 0.125m (red crosses in the left column of Figures 5 and 6).
a) b)
[image:5.595.121.475.144.396.2]c) d)
Figure 4 – Details of the experimental test setup: a) test layout; b) coating of the barrier; c) coating of the source support; d) coating of the microphone support.
The insertion loss was evaluated for a frequency range between 100 to 20000 Hz, considering thin bands with a width of 100 Hz. In all plots, the red line represents the experimental results and the blue one the numerical results (right column, Figures 5 and 6).
In general, the numerical results closely match the experimental measurements. In all cases, the exception is made for lower frequencies up to 2500 Hz. At these lower frequencies, it is possible that the deviations are due to an incorrect modeling of the sound source (which predominantly makes use of the woofer component), and to a less efficient sound absorption provided by the lining materials, which, in some cases, can influence the response by introducing spurious contributions.
Comparing the two basic barrier configurations, 5a) and 6a), with their corresponding configurations with higher spacing, 5b) and 6b), it is clear that the level of noise reduction decreases as the lattice constant increases, with a less pronounced band gap appearing at somewhat lower frequencies. Indeed, for the smaller spacing and considering the rectangular lattice, the central frequency of this gap seems to occur around 4000 Hz, and is then shifted to around 2500 Hz when the spacing is increased. A similar behavior is registered for the case of the triangular lattice.
Figure 5 – Scheme of the crystal (rectangular lattice) and test setup for the various configurations of the sonic crystal and comparison of the insertion loss obtained between
Figure 6 – Scheme of the crystal (triangular lattice) and test setup for the various configurations of the sonic crystal and comparison of the insertion loss obtained between numerical and
CONCLUSIONS
The present work presents recent developments concerning the previously published research by Martins et al. [7]. In this paper the numerical results using the developed methodology are compared with the ones obtained experimentally for a reduced scale model (1:10) of a real barrier. The results showed once more the efficiency of the proposed methodology for the analysis of this kind of structure for sound attenuation. It could also be stated the advantageous on the use of reduced scale models for experimental evaluation, mainly in quantity of materials used and construction time of the models as well the possibility of test the models at more controlled conditions (quasi-anechoic chamber), which could be limitative in terms of space for real scale models. Some interesting interpretations related to the efficiency of some specific configurations of sonic crystals could be performed, which are very much in line with observations performed by other researchers. One such observation is that more economical (with less scatterers) configurations can be obtained without significant loss of acoustical performance by introducing voids or even removing complete rows of scatterers of the sonic crystal structure.
ACKNOWNLEDGEMENTS
The research work presented herein was supported by FEDER funds through the Operational Programme for Competitiveness Factors - COMPETE and by national funds through the FCT (Portuguese Foundation for Science and Technology), under research project PTDC/ECMCOM/ 1438/2012.
REFERENCES
[1] Martínez-Sala R., Sancho J., Sánchez J.V., Gómez V., Llinares J. & Meseguer F., Sound attenuation by sculpture, Nature, 378, 241, 1995.
[2] Wu L.-Y., Chen L.-W., Liu C.-M., Acoustic pressure in cavity of variously sized two-dimensional sonic crystal with various filling fraction, Phys. Lett. A, 373, pp.1189–1195, 2009.
[3] Vasseur J.O., Deymier P.A, Djafari-Rouhani B., Pennec Y., Hladky-Hennion A-C., Absolute forbidden bands and waveguiding in two-dimensional phononic crystal plates, Phys. Rev. B, 77, 085415, 2008.
[4] Sánchez-Pérez J.V., Rubio C., Martínez-Sala R., Sánchez-Grandia R., Gómez V., Acoustic barriers based on periodic arrays of scatterers, Appl. Phys. Lett., 81, 5240, 2002.
[5] Castiñeira-Ibáñez S., Rubio C., Romero-García V., Sánchez-Pérez J.V., García-Raffi L.M., Design, Manufacture and Characterization of an Acoustic Barrier Made of
Multi-Phenomena Cylindrical Scatterers Arranged in a Fractal-Based Geometry, Archives of Acoustics, 37 (4), pp. 455–462, 2012.
[6] Martins, M., Godinho, L., Picado-Santos, L., Numerical Evaluation of Sound Attenuation Provided by Periodic Structures. Archives of Acoustics, 38 (4), pp. 503–516, 2013.